
Home/HighLevel/Guides/Build the Founder dashboard
HighLevel Guides · Volume 08 · Reporting
GoHighLevel reporting: build the Founder dashboard you review every Monday.
A Founder should not open six reports to find out how the week went. This build puts the pipeline, email activity, appointments and revenue on one custom dashboard inside your subaccount. At the end you will have a dashboard with trend badges, a sortable table and the right people allowed to see it. HighLevel is the same platform many people still search for as GoHighLevel.
What you are building
What you are building and why it matters.
The finished system is one custom dashboard in your subaccount that opens to the numbers you care about. Scorecards show opportunities, appointments and revenue against the prior period with a trend badge. A table chart lists the detail you need, sorted by the column you pick. The dashboard is shared with the team at the right access level, and reps who should only see their own data see only that. For reports you send to clients, see build a client reporting dashboard and client reporting for agencies.
- One named dashboard a Founder opens first thing Monday morning
- Widgets for opportunities, email activity, appointments and revenue, each with a comparison period and trend badge
- A table chart with the columns you choose, sorted by the column that matters most
- Permissions set so agency users, account admins and account users each get the right level of access
- A saved layout your team cannot break, because only the people you allow can edit it
- Conditions on each widget, so a rep can see only their own data
Before you start
What to have ready before you start.
Have these in place before you build so you are not stopped halfway through.
- A HighLevel subaccount on the $297 plan or higher. The sources say custom widgets and multiple dashboards need this tier.
- A login with Edit or Full permission on dashboards, or an agency admin login. Only the owner or a Full permission role can change a dashboard's permissions.
- At least one pipeline with real opportunities in it, so the pipeline widgets have data to show.
- A calendar with booked appointments, so the appointment widgets are not empty.
- Payments or opportunity values recorded, so the revenue widgets have something to count.
- A list of who on the team should see the dashboard and whether each person needs view or edit rights.
Part 01 of 06
Create the dashboard and name it.
A custom dashboard starts as a blank canvas. You create it from the dashboard menu, give it a name and decide at the start whether it is private or shared. You can change sharing later, but naming it clearly now keeps it easy to find.
- In your subaccount, click Dashboard in the left navigation menu.
- Open the Dashboard Selection Menu at the top of the page.
- Click + Add Dashboard.
- Under Create a Blank Dashboard, click Select.
- In the Dashboard Name field, type a name such as Monday Founder Review.
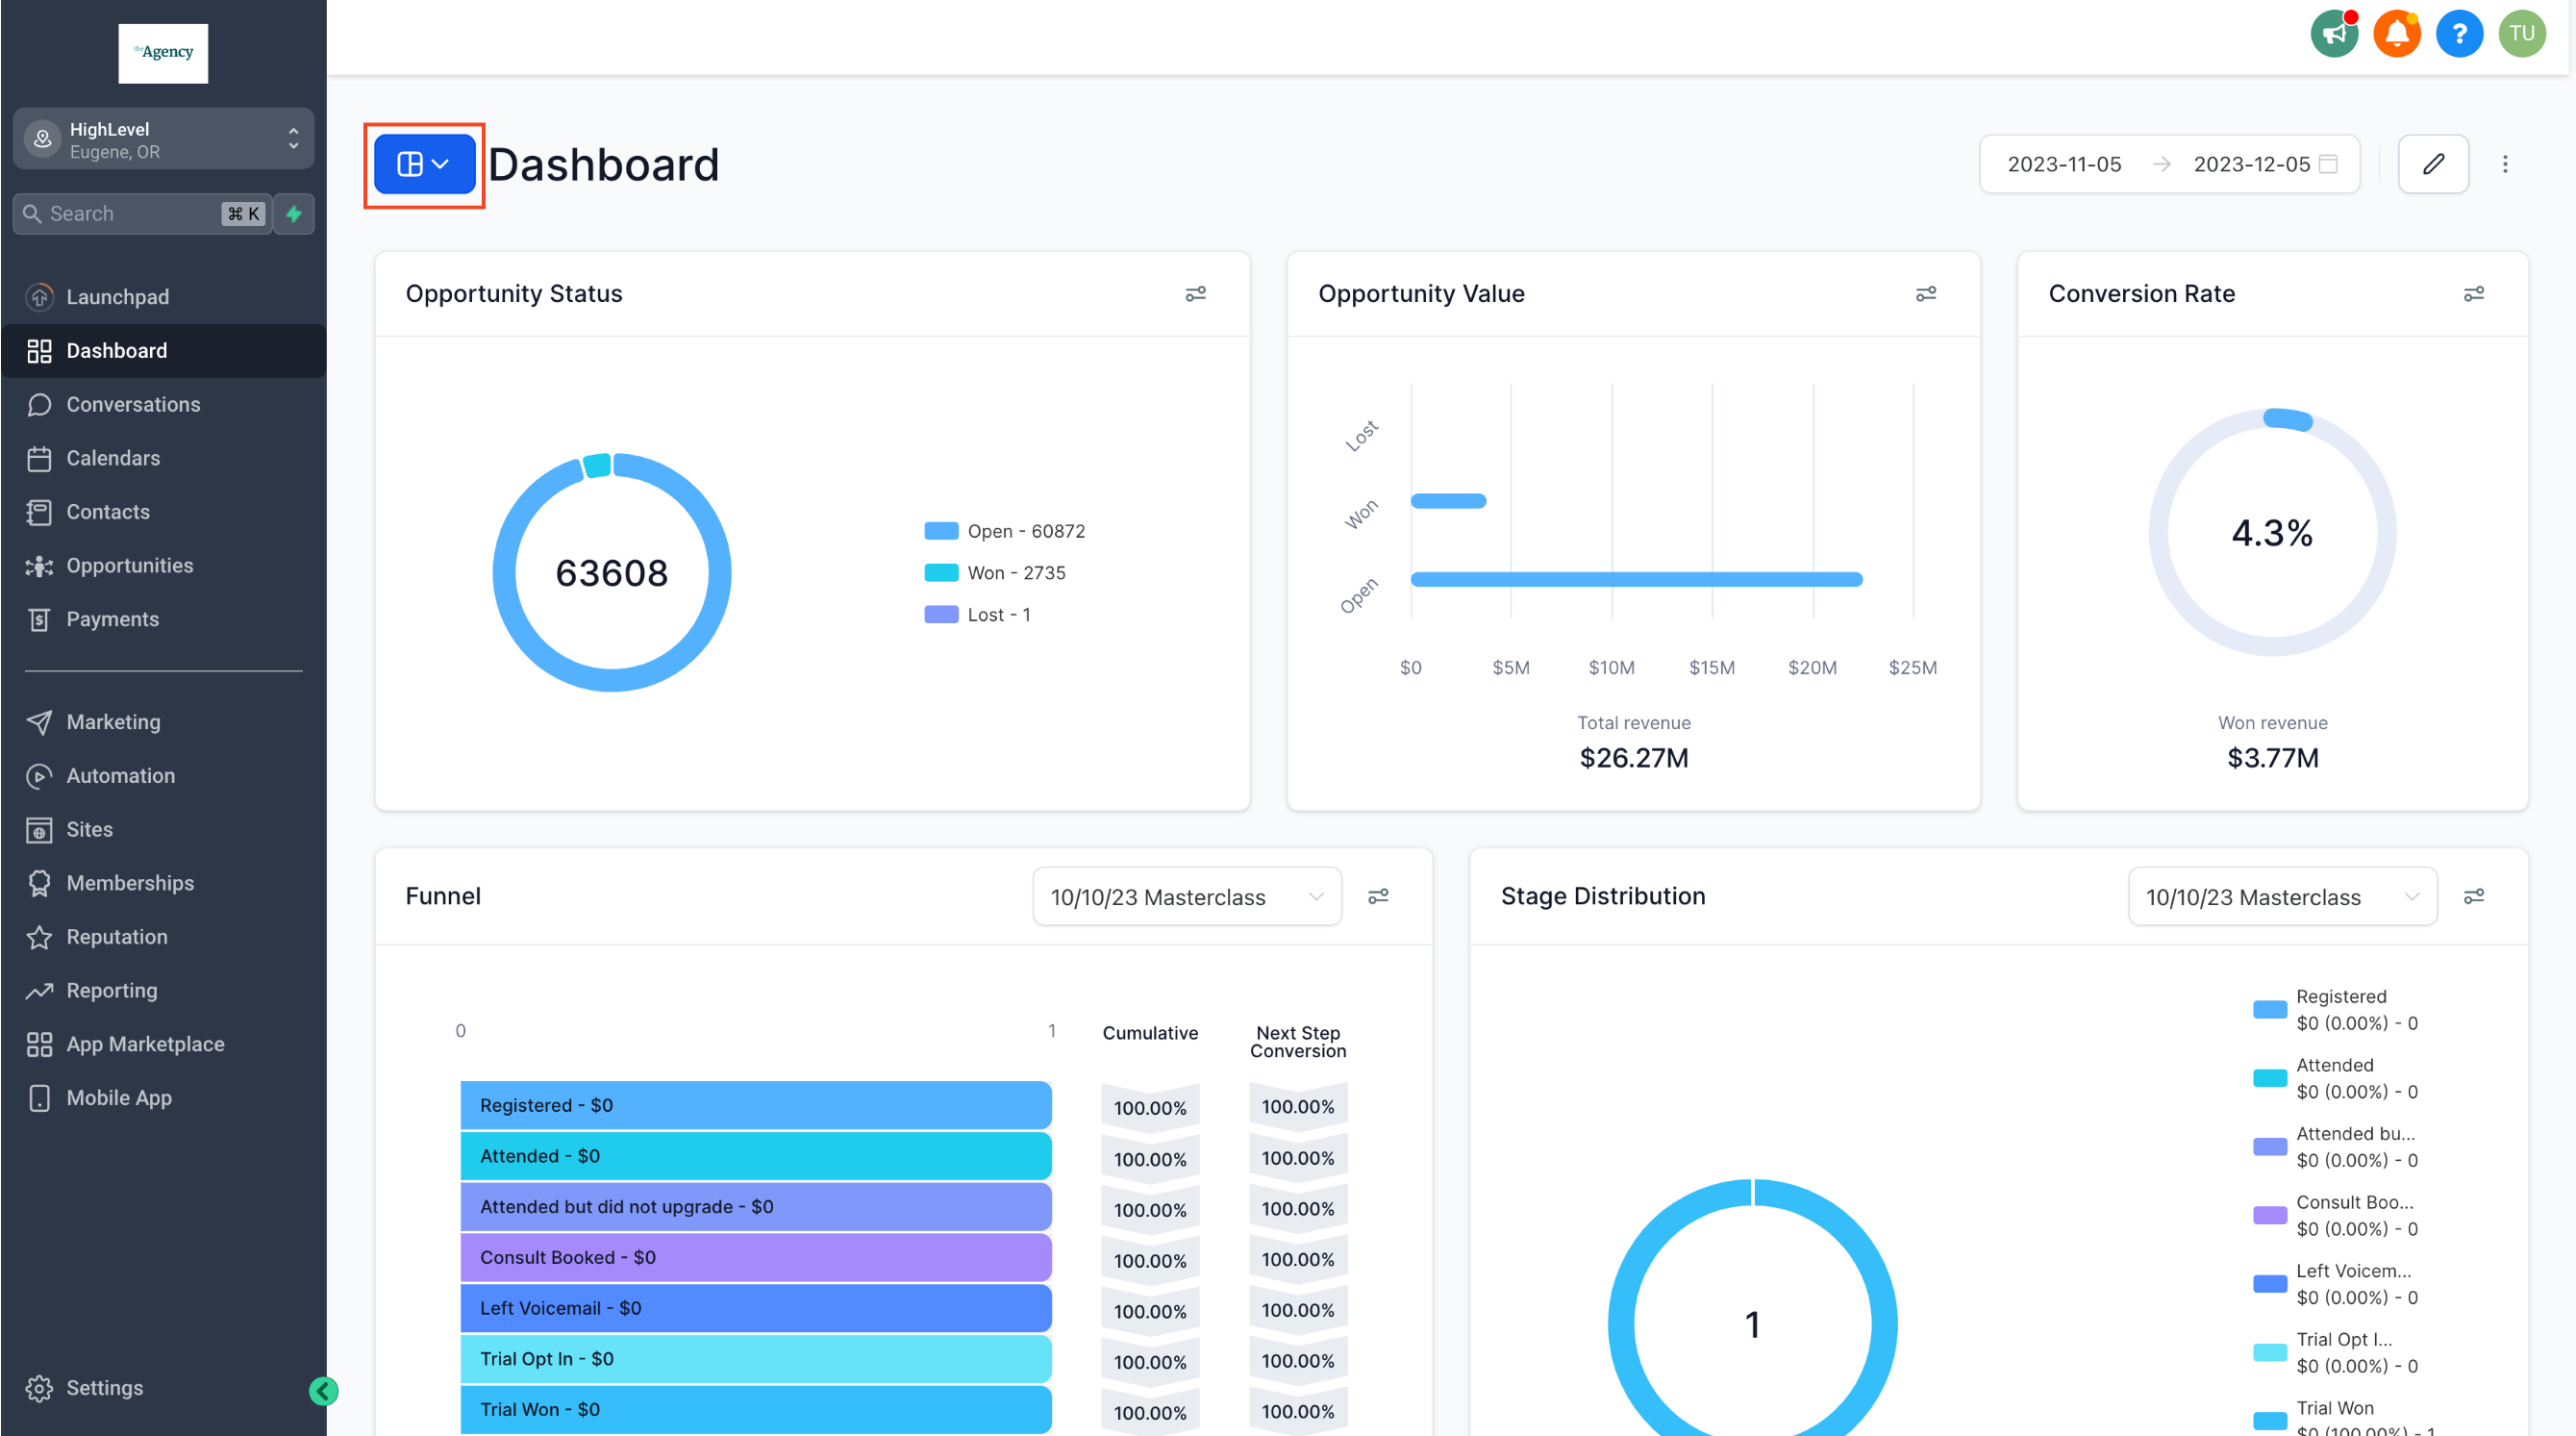
Name the dashboard and keep it private until the layout is done. - Leave the Private Dashboard toggle on for now. You will open it up to the team in the last part.
- Click Confirm to create the blank dashboard.
Part 02 of 06
Add the four widgets a Founder needs.
The Widget Gallery holds every built in reporting card. You search it by goal, preview the chart, and drop the widget on the canvas. For the Monday review you want four things: opportunities in the pipeline, email activity, appointments and money.
- On the new dashboard, click the pencil edit icon in the top right corner to enter edit mode.
- Click Add Widget to open the Widget Gallery.
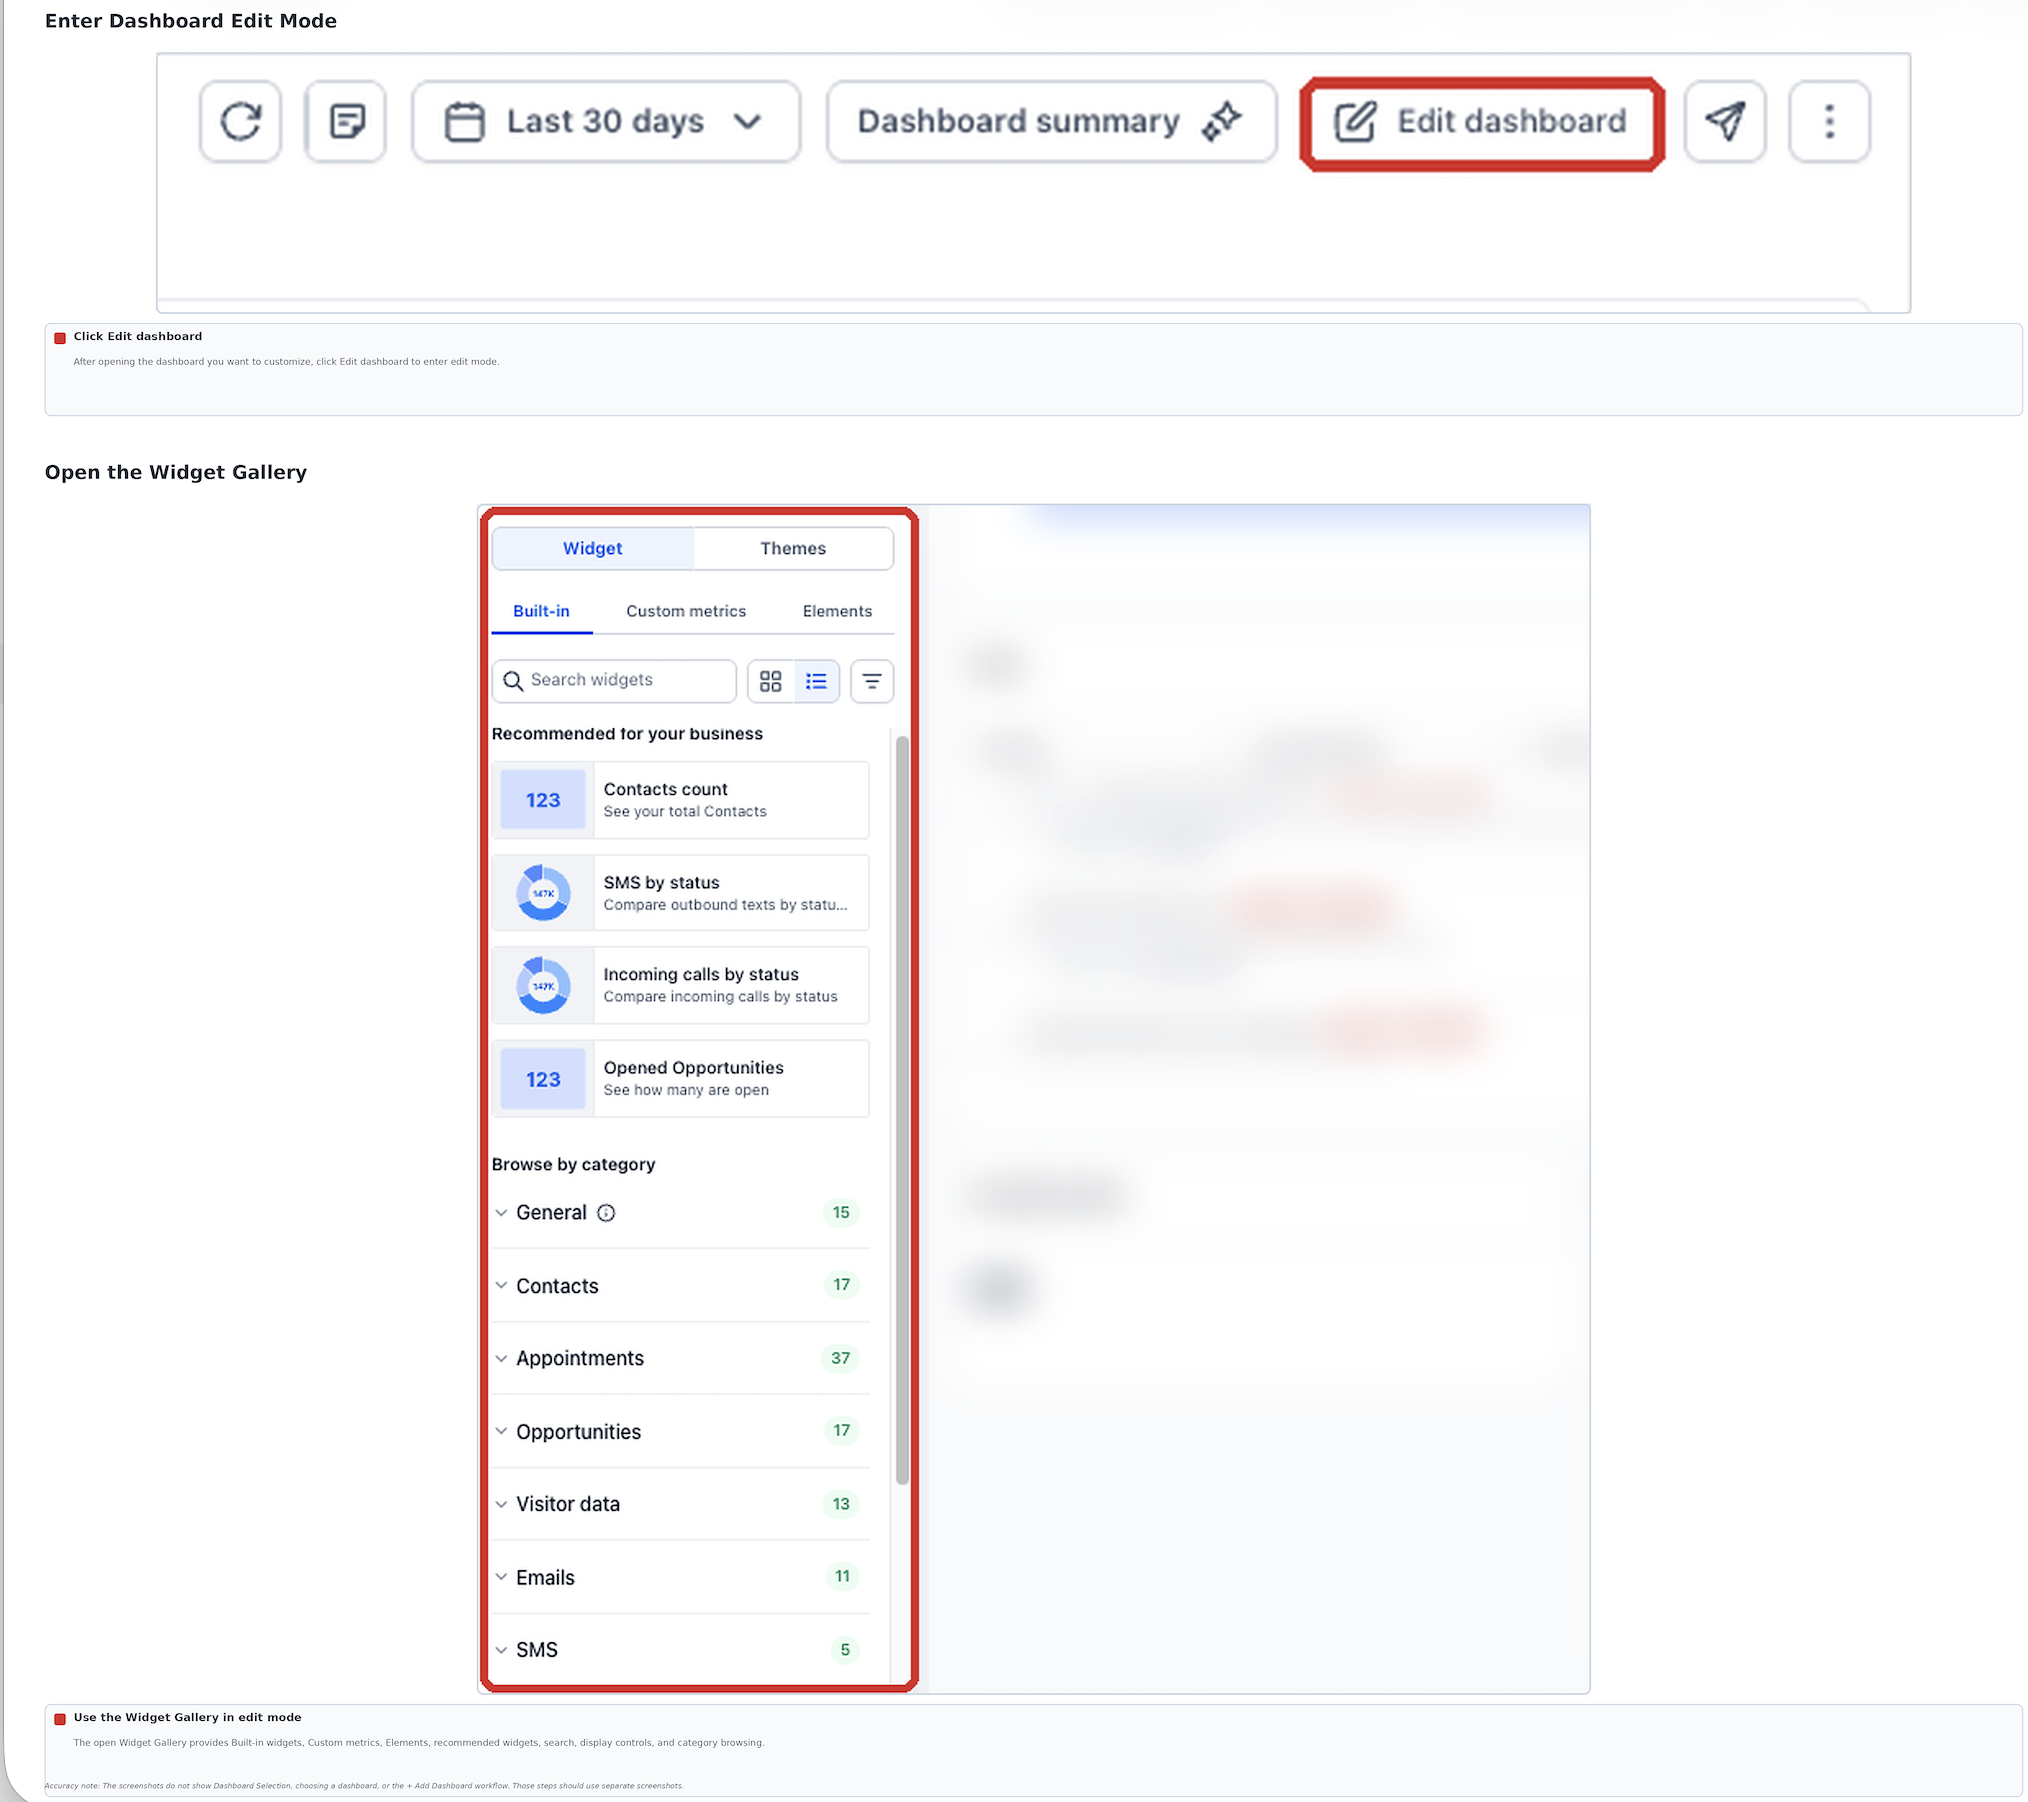
Search the gallery by goal, not by exact widget name. - Switch between Gallery view and List view with the view control, and use the module filters to narrow the list to one reporting area.
- In Search, type opportunities, hover the opportunity widget you want, and click the add control to place it on the canvas.
- Search for email, hover the email widget, and add it the same way. This is your conversation activity card.
- Search for appointments, then add the appointment widget. Try a search such as no show if you want that trend on the board too.
- Search for payments or revenue, then add the widget that totals money collected.
- Click Save Changes so the four widgets are stored before you start tuning them.
Part 03 of 06
Tune each widget so the number means something.
A raw count tells you nothing on its own. Each widget has a Configure tab where you rename it, pick the metric, pick the chart type and add a comparison period. The comparison period is what turns a number into a trend badge.
- In edit mode, select the opportunity widget, or open its menu (the three dots) and click Edit widget.
- Open the Configure tab.
- Change the Title to a plain label such as Open deals this week.
- Under Metrics, pick the data point you want. Use the Pipeline dropdown to show one pipeline instead of all pipelines added together.
- Pick the chart type. Use the number view for scorecards and Line or Bar when you want to see movement over time. Review the preview before you move on.
- Set Date Range Override only if this widget should cover a different period than the dashboard's global date range.
- Expand Advanced settings, set a Comparison date range, and under Specify whether a metric's increase or decrease is positive choose Increase is positive. For a no show widget choose Decrease is positive.
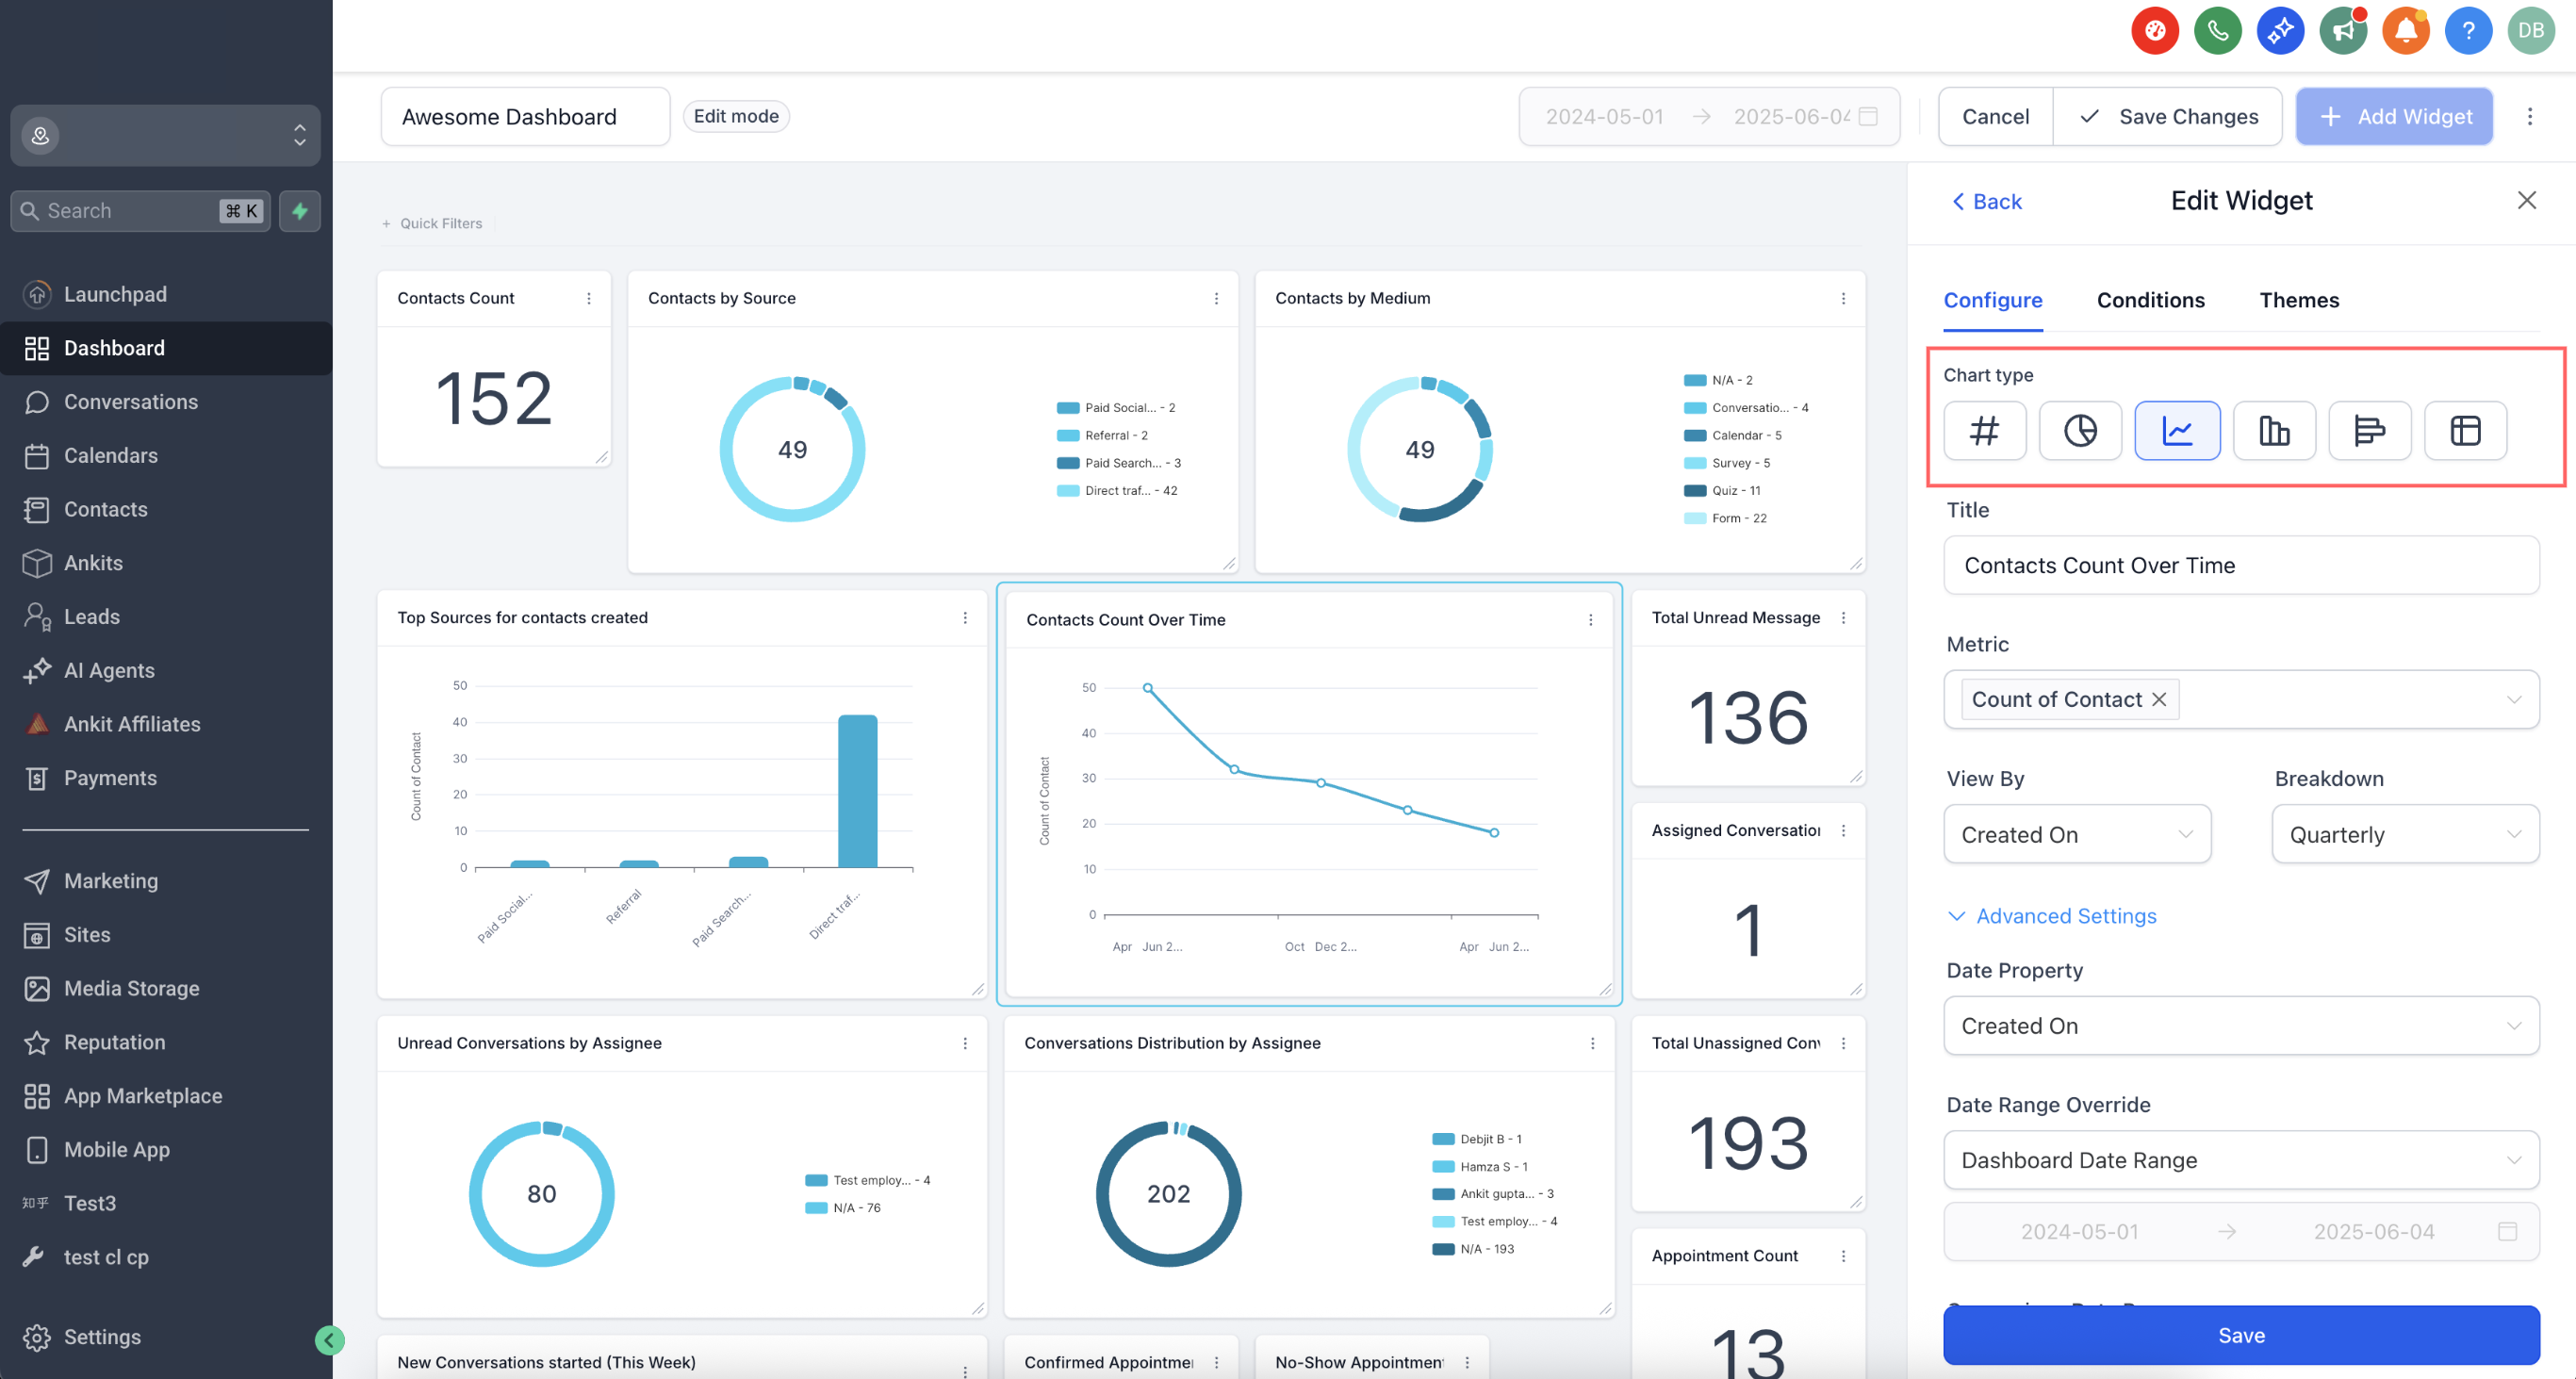
Every widget gets a title, a metric, a chart type and a comparison period. - Click Save changes, then repeat these steps for the email, appointment and revenue widgets.
Part 04 of 06
Add conditions to cut the noise.
Conditions filter a widget down to the records that matter. You can combine conditions with AND and OR, and you can build nested groups. This is also how you make a widget show only the logged in user's own data.
- Open the widget you want to filter and click the Conditions tab.
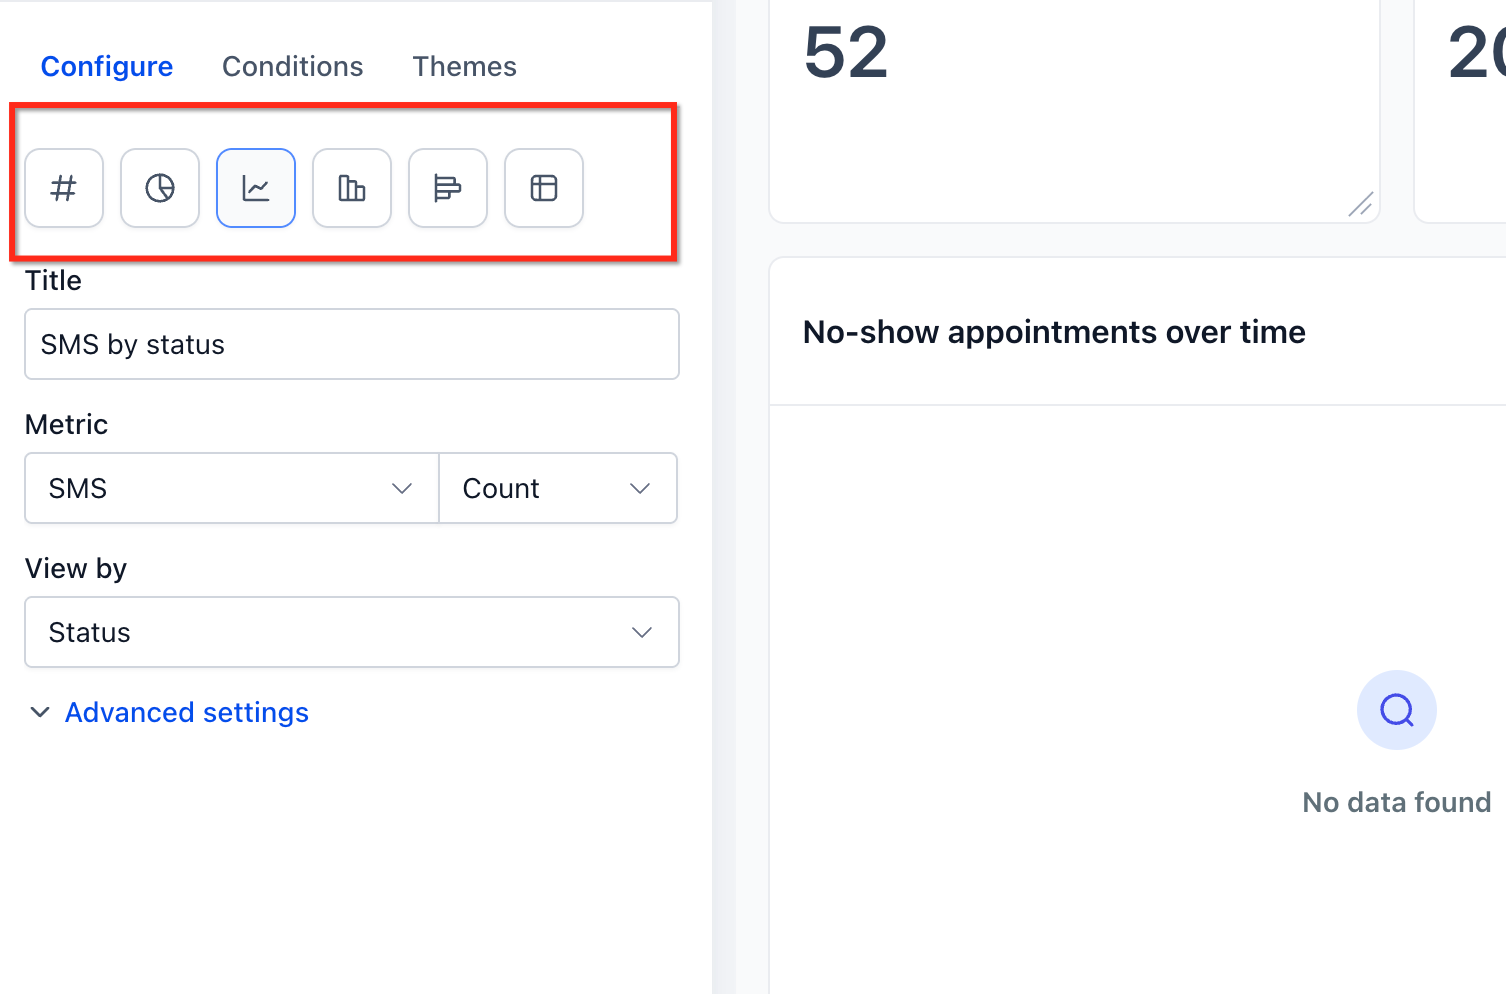
Conditions narrow a widget to the records you care about. - Click Add Condition.
- Choose the field, the operator and the value the records must match.
- Add more conditions with the AND or OR options.
- For a nested group, click Add Filter, use +AND for the conditions inside that group, then click +Add Filter for a second group joined by OR.
- If a rep should see only their own records in a widget, add the condition USER then LOGGED IN USER.
- Click Save. If the widget shows an inline warning that no data matches, loosen or remove a condition until at least one record matches.
Part 05 of 06
Add a table chart for the detail.
Scorecards give you the headline. A table chart gives you the rows behind it, sorted the way you want. On an email widget the table can also show which workflow step sent each email.
- In edit mode, click Add widget and add the widget whose rows you want to see, such as the email widget.
- Open the widget settings and go to the Configure tab.
- Change the chart type to Table.
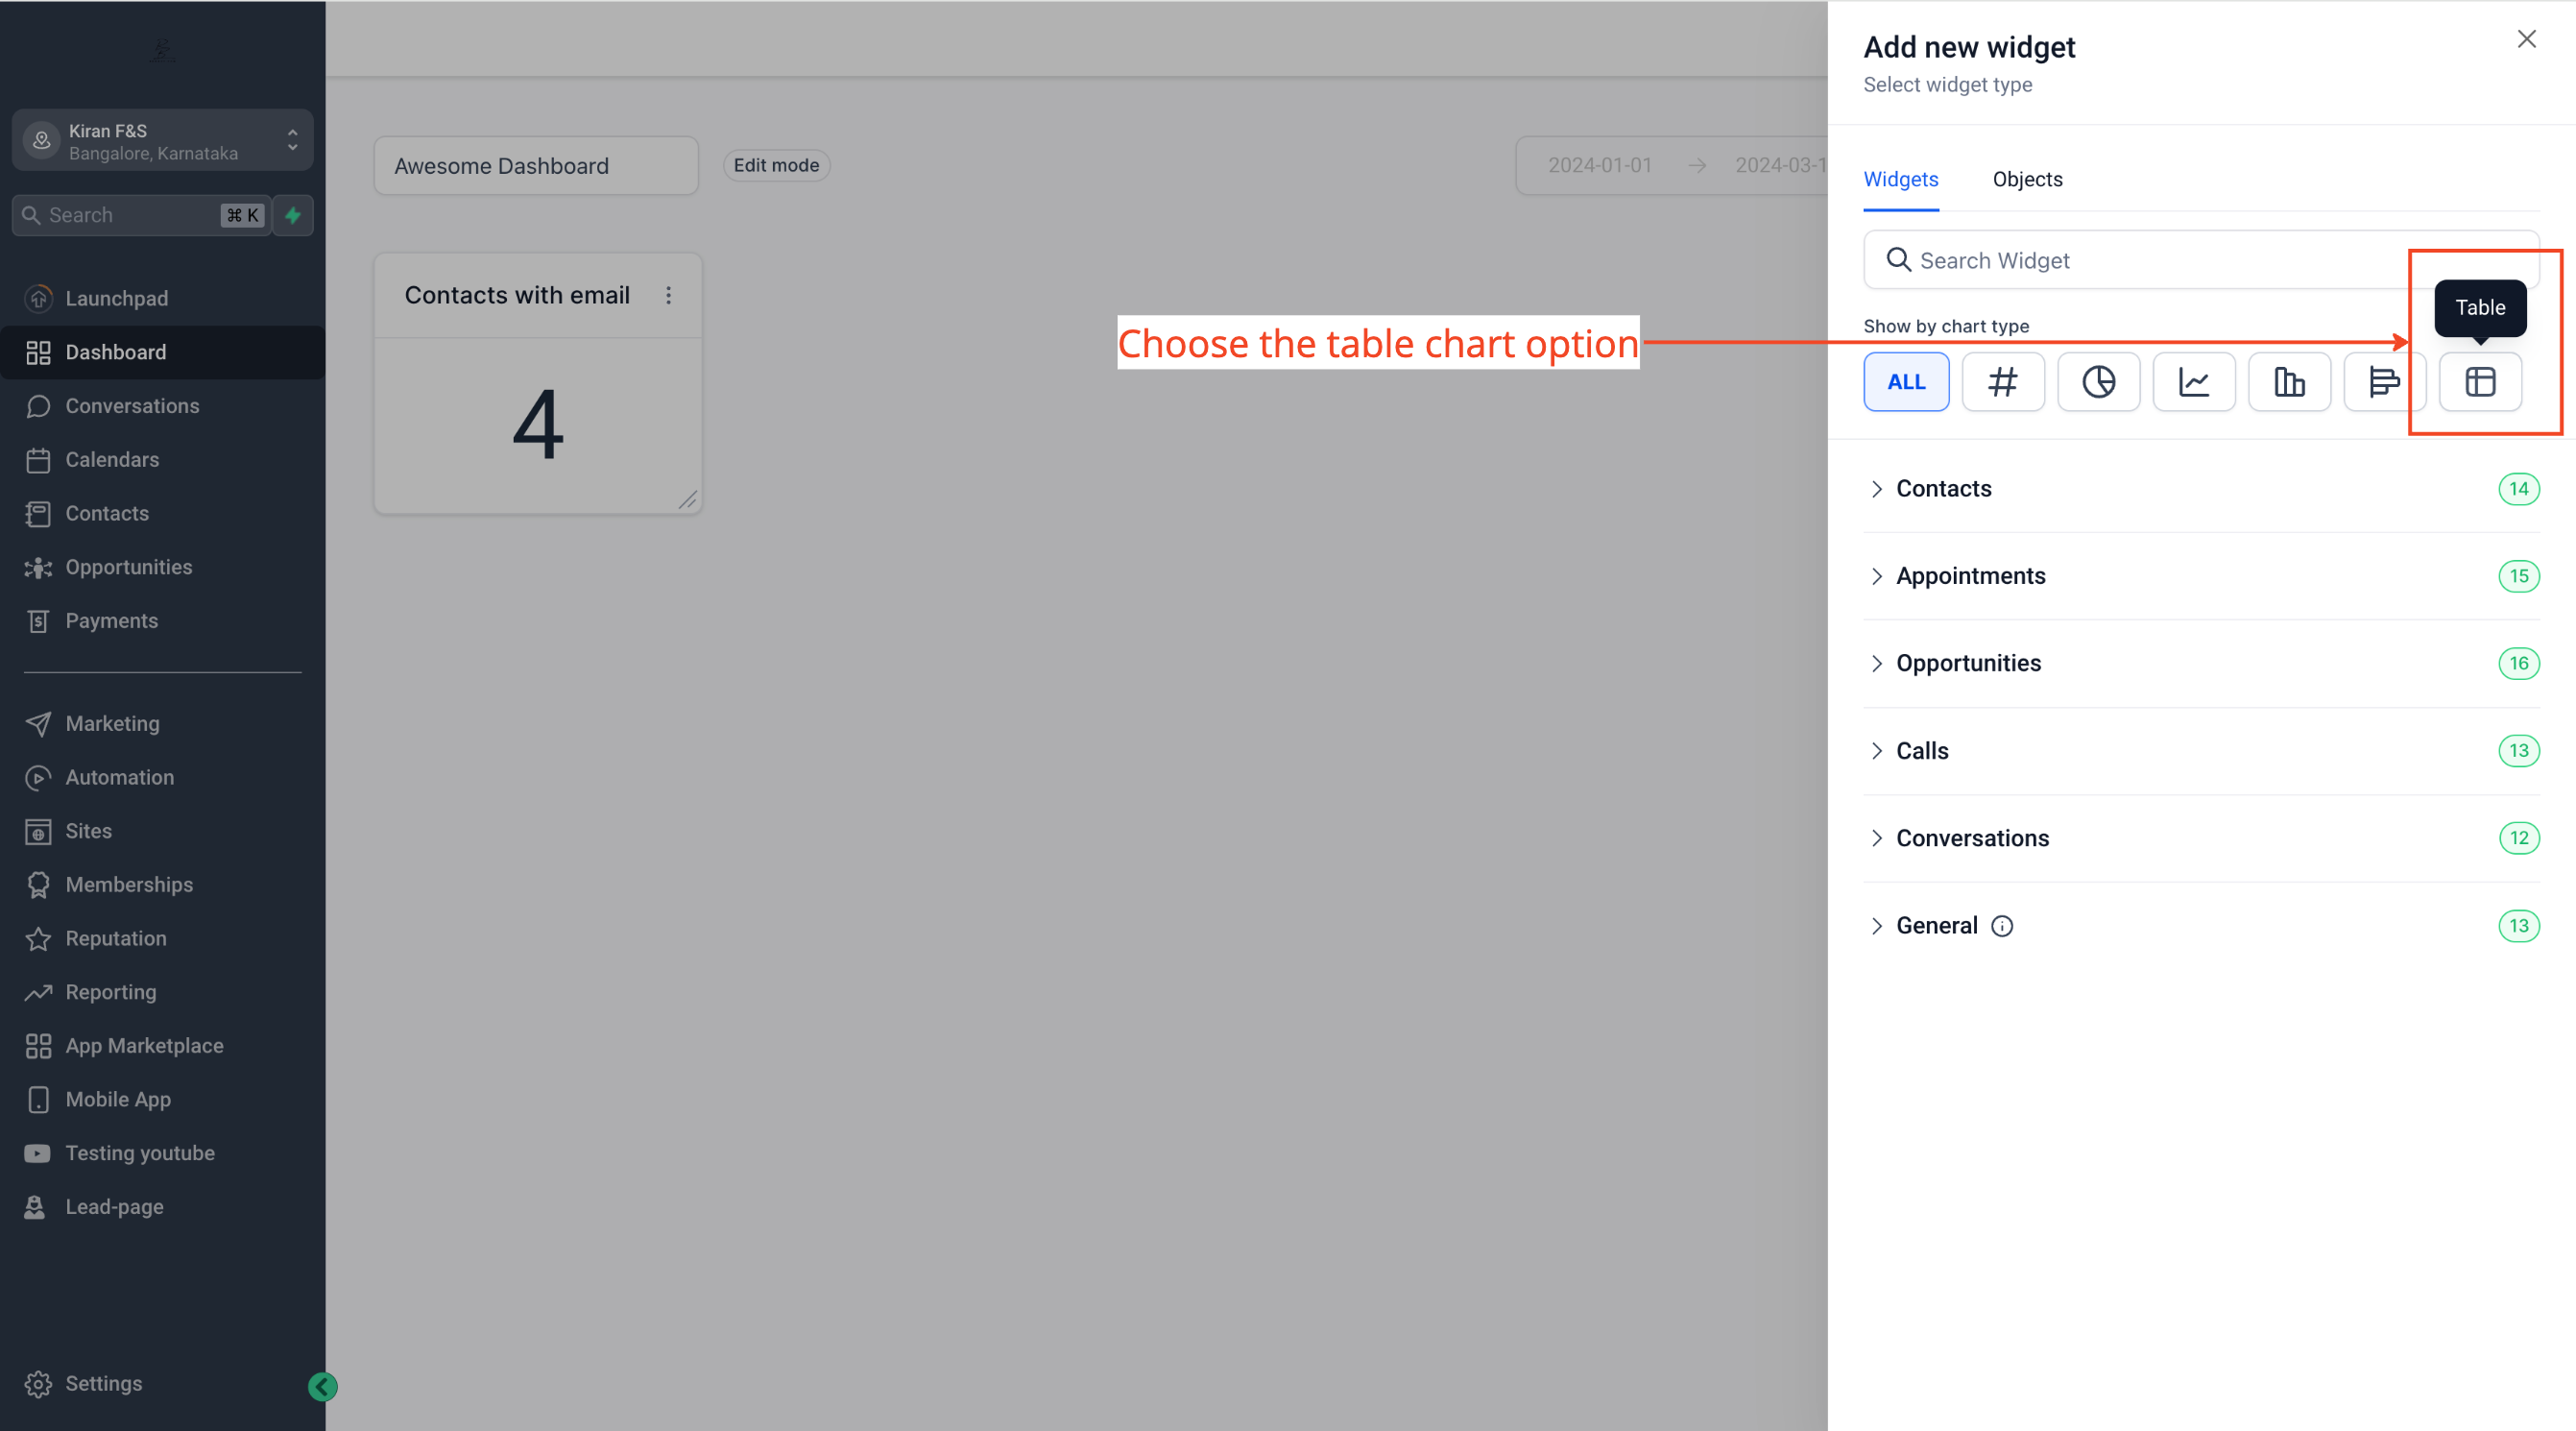
Pick the columns, then pick the column the table sorts by. - Under Select Columns, tick the columns that should appear in the table.
- On an email widget, include the Source Action Name column so each row shows the workflow step that triggered the email.
- Open Advance Settings and pick the ordering column the table should sort by.
- Click Save, then drag and resize the table on the canvas so it sits below the scorecards.
Part 06 of 06
Share it with the team at the right level.
Now the layout is done, open it up. Dashboard permissions have four levels, Full, Edit, View and No Access. Each user also needs the matching permissions in their staff settings or the widgets will show nothing.
- Click Save Changes to leave edit mode with the finished layout.
- Open the dashboard's permissions and turn the Private toggle off to show the sharing permissions list.
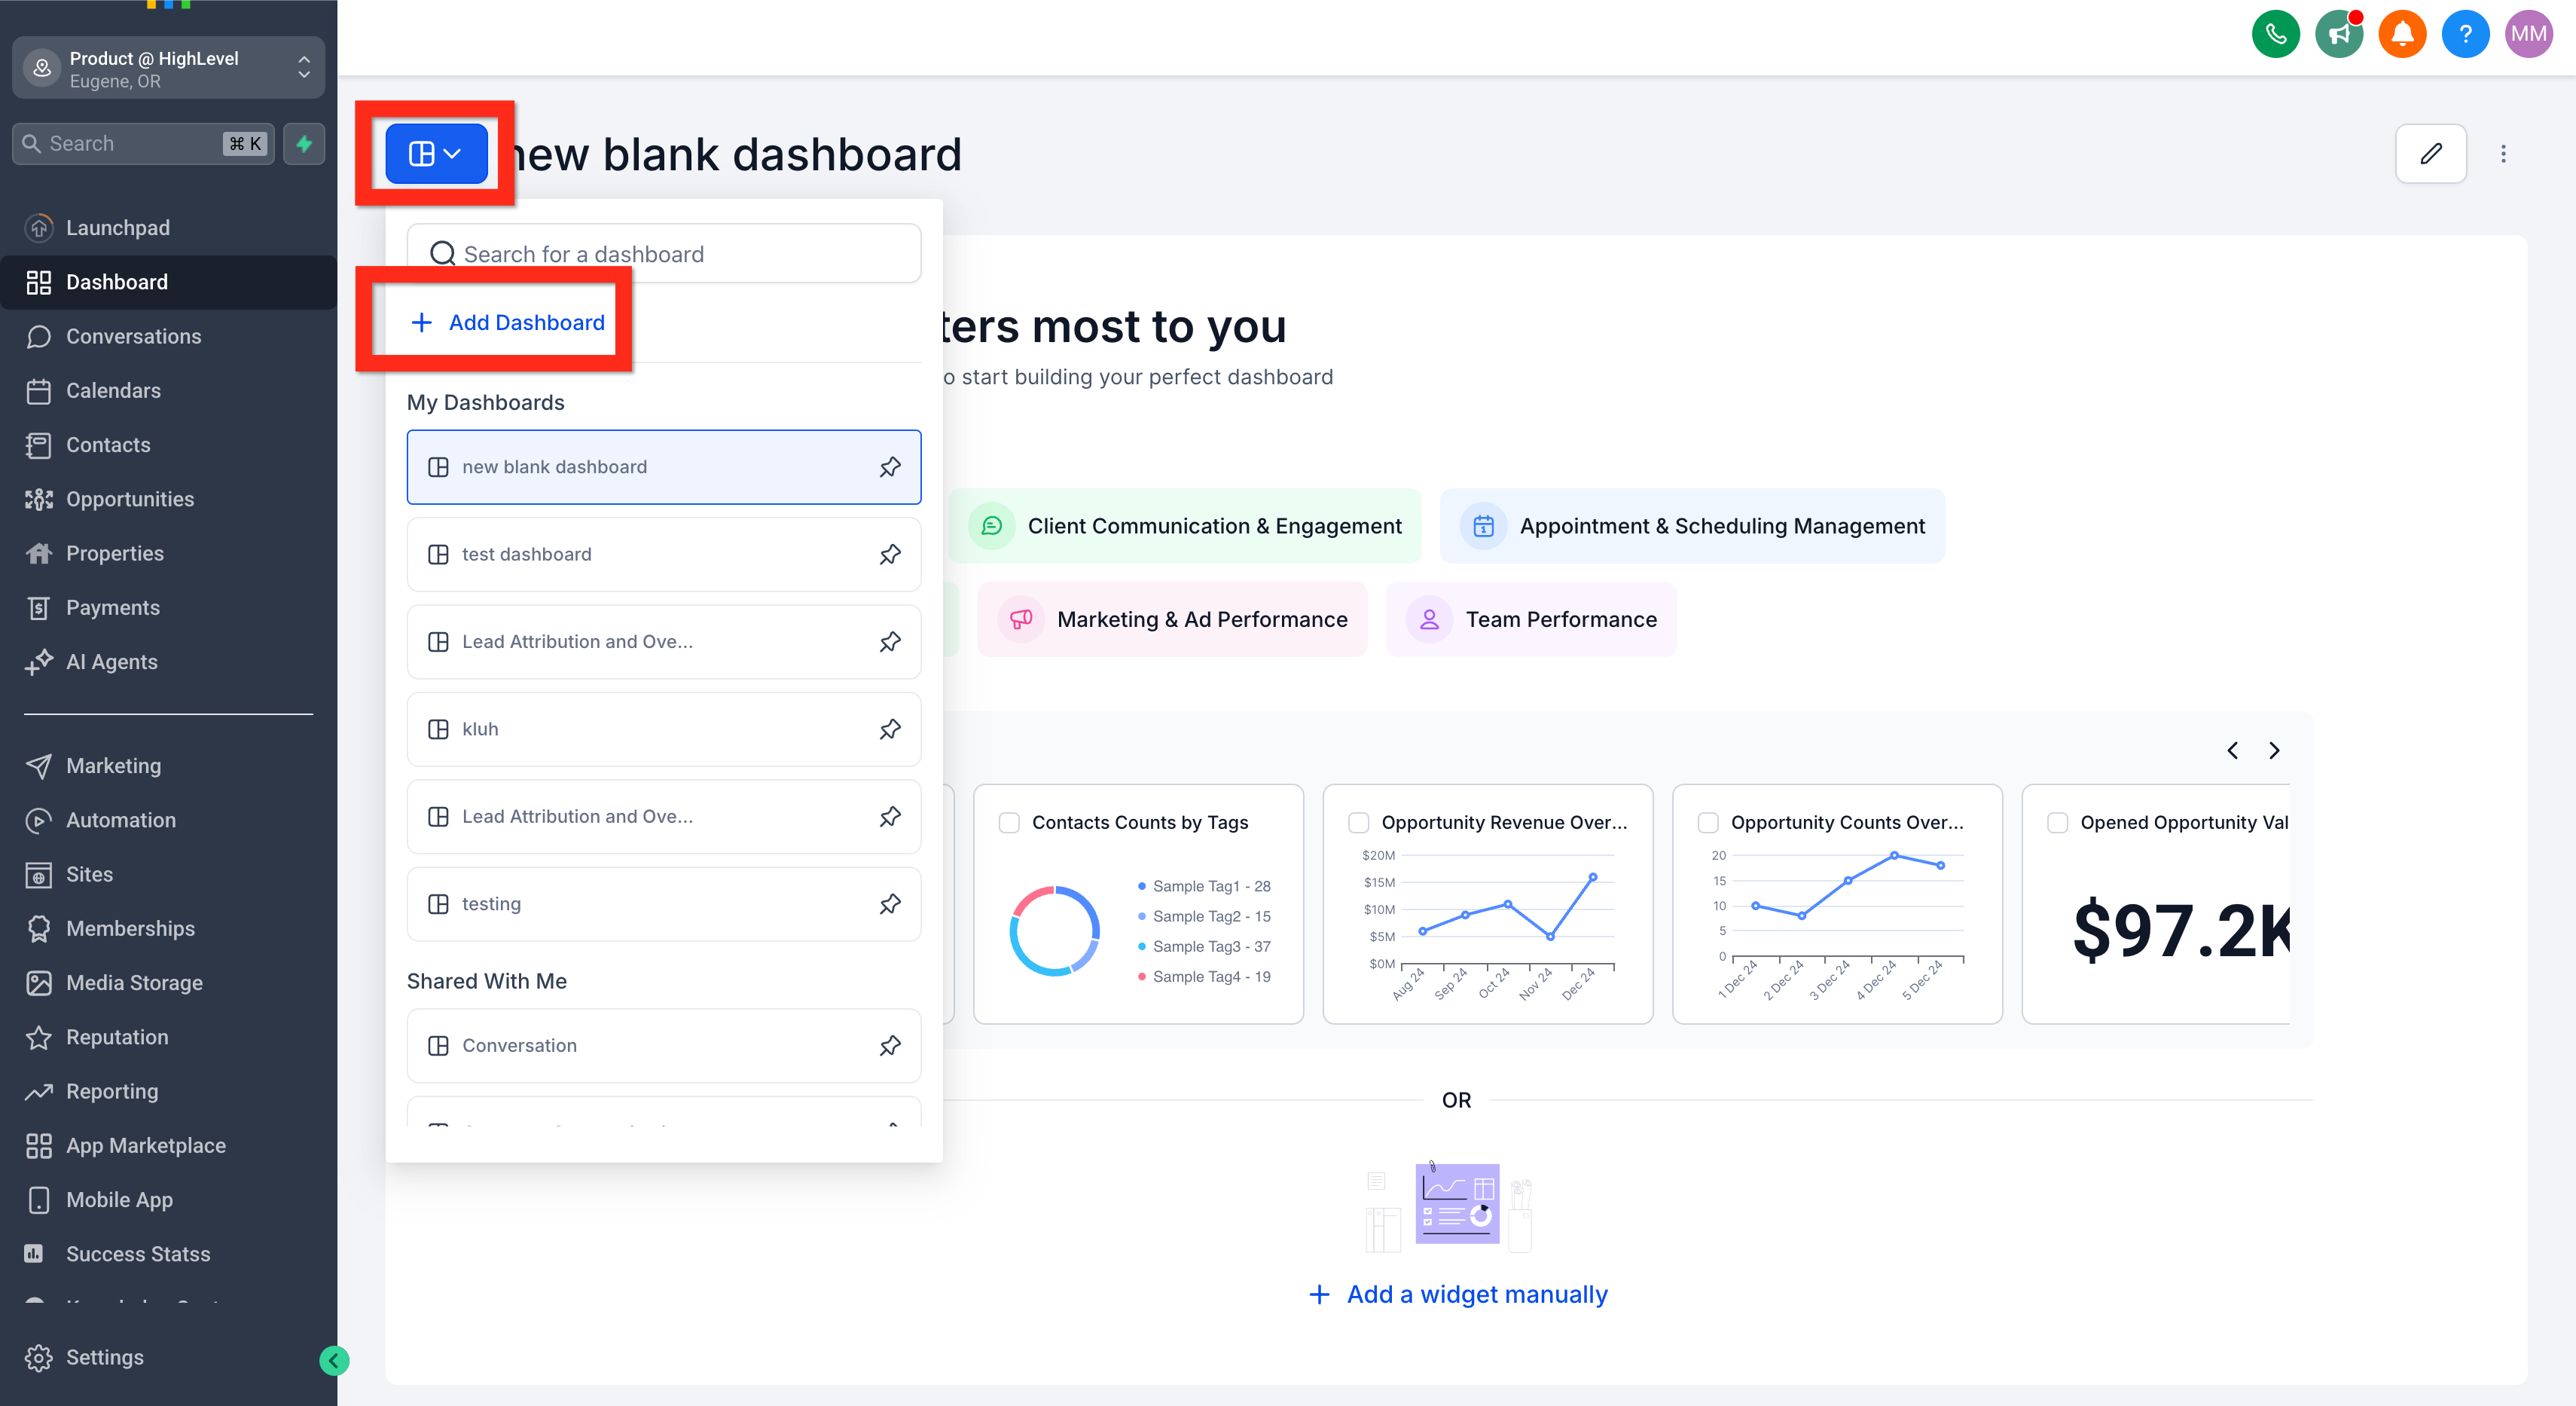
Turn Private off, then set each role to Full, Edit, View or No Access. - Set the access level for Agency User, Account Admin and Account User. Give the Founder and operations lead Edit or Full. Give everyone else View.
- Decide whether each role gets the Export data permission, which controls exporting data from widgets.
- Click Confirm to save the permissions.
- Go to Settings, then My Staff, and click Edit next to a team member.
- In User Permissions, turn on Dashboard Stats plus Contacts, Opportunity, Appointment and Lead value as that person needs them.
- Leave Only Assigned Data off for anyone who must see the full custom widgets. When it is on, custom widgets show no data for that user.
Test it
Test it before Monday.
Run through the dashboard once as yourself and once as a team member before you rely on it.
- Open Dashboard, open the Dashboard Selection Menu, and confirm your new dashboard is listed by name.
- Open it and check that all four scorecards show a number and a colored trend badge, not a blank card.
- Change the dashboard's global date range and watch each widget update, except any widget where you set a Date Range Override.
- Open the opportunity widget and confirm the Pipeline dropdown shows the single pipeline you picked.
- Scroll to the table chart and confirm the rows sort by the column you set in Advance Settings.
- Log in as an account user with View access and confirm they can open the dashboard but the pencil edit icon does not appear for them.
- Log in as a rep with the LOGGED IN USER condition and confirm the widget shows only their records.
When a step fails
When it breaks and how to fix it.
These are the problems that come up most often, and the fix for each.
- The + Add Dashboard button is missing
- You are not in dashboard view mode. Leave edit mode and reload the dashboard page.
- The Private Dashboard toggle is missing
- The toggle only shows on the New Dashboard page. Reopen Add Dashboard and look for it there.
- The pencil edit icon does not appear
- Only the owner or a role with Edit or Full permission can edit. Check your dashboard permission level, then enter edit mode.
- A widget will not save after adding conditions
- No records match the filters. Loosen or remove a condition so at least one record matches, then save.
- No trend badge on a scorecard
- A Comparison date range is required. Open Advanced settings on the widget and set one.
- A team member sees empty custom widgets
- Only Assigned Data is turned on for that user, or they are missing Contacts, Opportunity, Appointment or Lead value permissions. Fix it under Settings, then My Staff.
Questions
What do people ask about GoHighLevel reporting dashboards?
- Which HighLevel plan do I need for custom dashboards and widgets?
- HighLevel's help articles list custom widgets and multiple custom dashboards on the $297 and $497 plans. One article lists multiple dashboards on all plans, so check your own account before you plan the build. Plan prices are on the GoHighLevel pricing page.
- What chart types can a widget use?
- Numeric or count, donut or pie, line, bar, horizontal bar and table. Availability varies by widget, so check the chart type picker on each one.
- Can I make a widget show only the logged in rep's data?
- Yes. On the Conditions tab of the widget add the condition USER then LOGGED IN USER. The widget then filters to the person viewing it.
- Can I email the dashboard to a client who is not a HighLevel user?
- Yes. When you schedule a report, add any valid email address in the Recipients field.
- Can I copy this dashboard to another subaccount?
- You can duplicate a dashboard from the dashboard actions, but only Agency roles can duplicate it to another subaccount. You can build and test this during a 30 day GoHighLevel trial through Michael's link.
- Who can change a dashboard's permissions?
- Only the owner or a role with Full permission can change a dashboard's permissions. Agency admins always have Full access to every nonprivate dashboard.
From the field
Michael’s take.

The first thing I would do is decide the five numbers I want to see on Monday morning and build only those. Open opportunities in the main pipeline, appointments booked, no shows, email activity and revenue collected. That is the whole board. A dashboard with twenty widgets is a report nobody reads.
Where people go wrong is skipping the comparison date range. A number with no comparison is trivia. A number with a green or red badge next to it tells you what to do today. Set the comparison on every scorecard and flip the direction to Decrease is positive on anything like no shows, so the colors always mean what your gut expects.
This build pays off the first week a rep can open the same dashboard and see only their own pipeline while I see everyone's. Same screen, no clutter, no extra report to pull. If your numbers are simple and the default reports already cover them, you can skip the deep widget work. But if you run a team and you are still digging through reports every Monday, this is an hour well spent.
Go deeper
The features behind this build.
Every feature this guide touches has its own page in the library, with the settings, limits and Michael’s notes.
- DashboardsHow to Create a Custom Dashboard
- DashboardsUnderstanding dashboard widgets
- DashboardsCreating and adding dashboard widgets in HighLevel
- DashboardsCustomizing dashboard widgets in HighLevel
- DashboardsCustom dashboard widgets in HighLevel: Plans, roles, and configuration
- DashboardsHow to use table charts in HighLevel dashboard widgets
- DashboardsHow to Manage Dashboard Permissions
- DashboardsHow to edit a dashboard in HighLevel
Get the guide
Take it with you. The PDF is yours.
The whole build, cover to cover, as a PDF you can keep open on a second screen or print for the team. HighLevel's Founder page opens alongside it.
Next step
Want this built with you?
Start your HighLevel trial through my link and the CRM Pros team comes with it. We will help you set up this dashboard and the rest of your subaccount.
The how to library has step by step HighLevel builds for Conversation AI, Voice AI, funnels, calendars, workflows and AI Studio. Go back to the full list.
Back to the GuidesAll the step by step builds