
01Who this is for
- Founders who need a quick view of team performance can use widgets to monitor contacts and opportunities at a glance.
- Marketing managers benefit from email and call widgets to track campaign activity without leaving the dashboard.
- Operations managers use appointment and payment widgets to keep an eye on scheduling and revenue trends.
02Dashboard widgets, explained
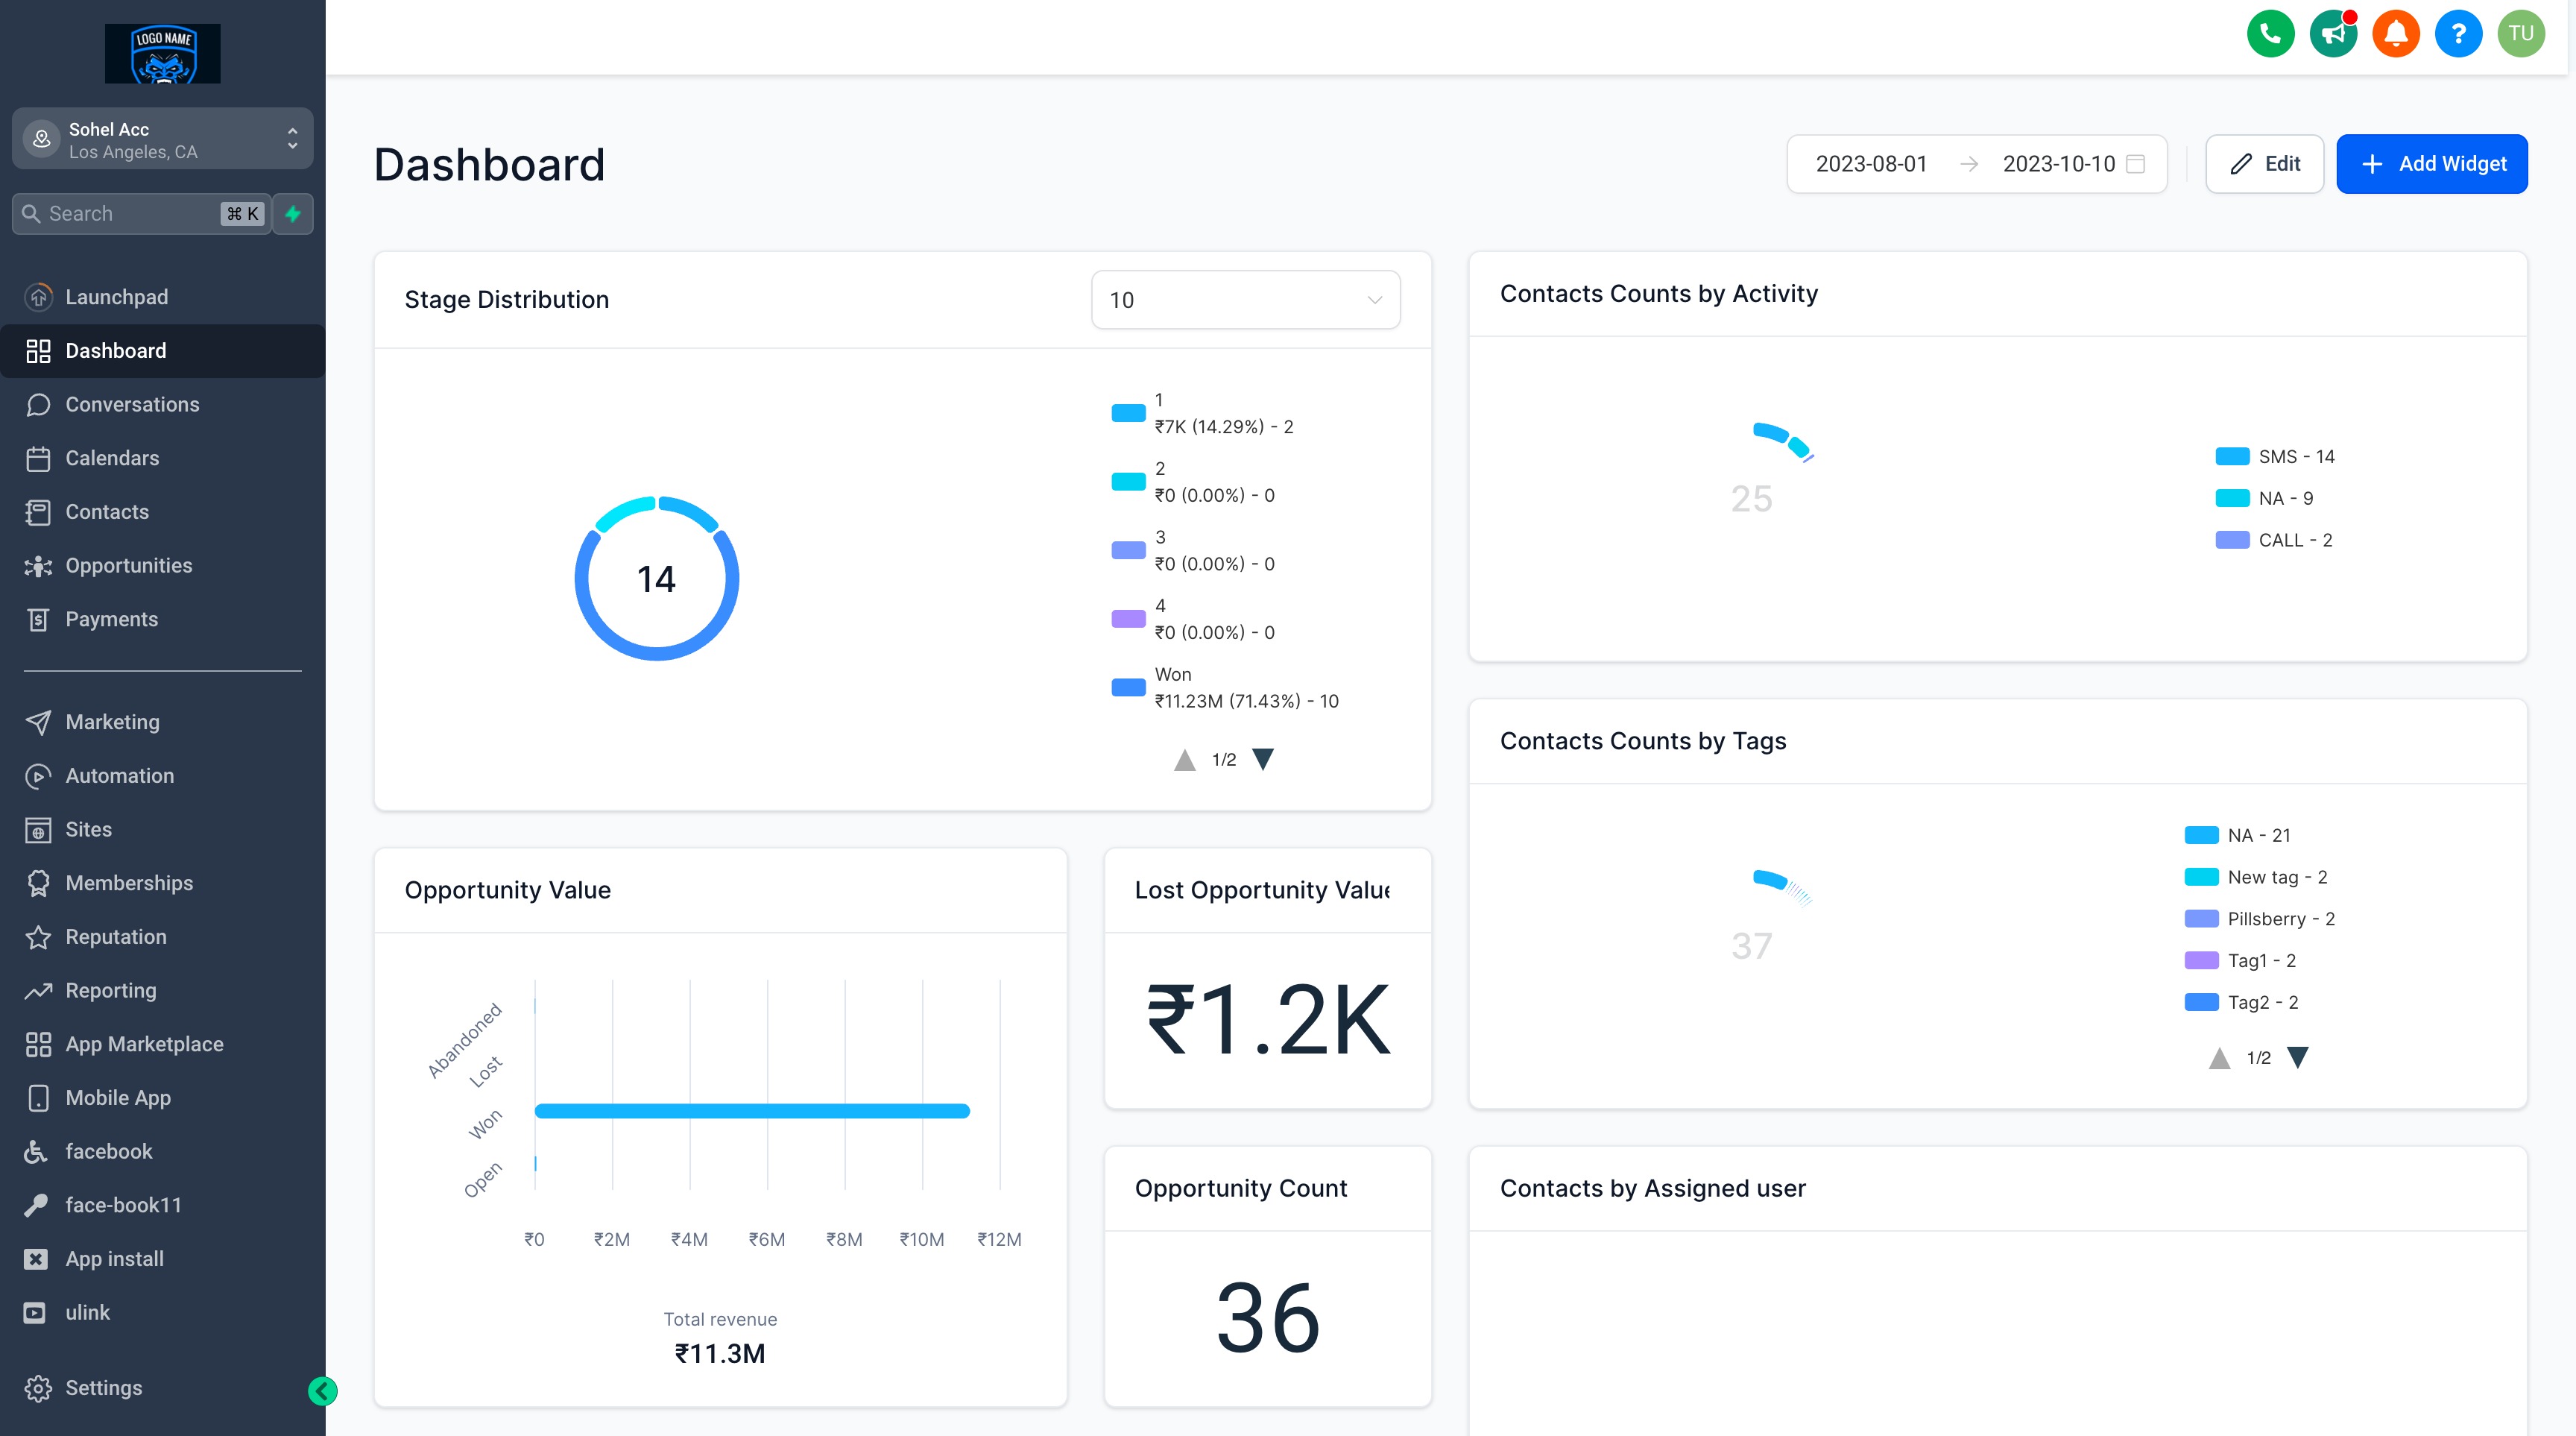
Dashboard widgets are visual components that display data such as counts, charts, tables or trends. They pull information from the platform and present it in a compact format that can be added to any dashboard.
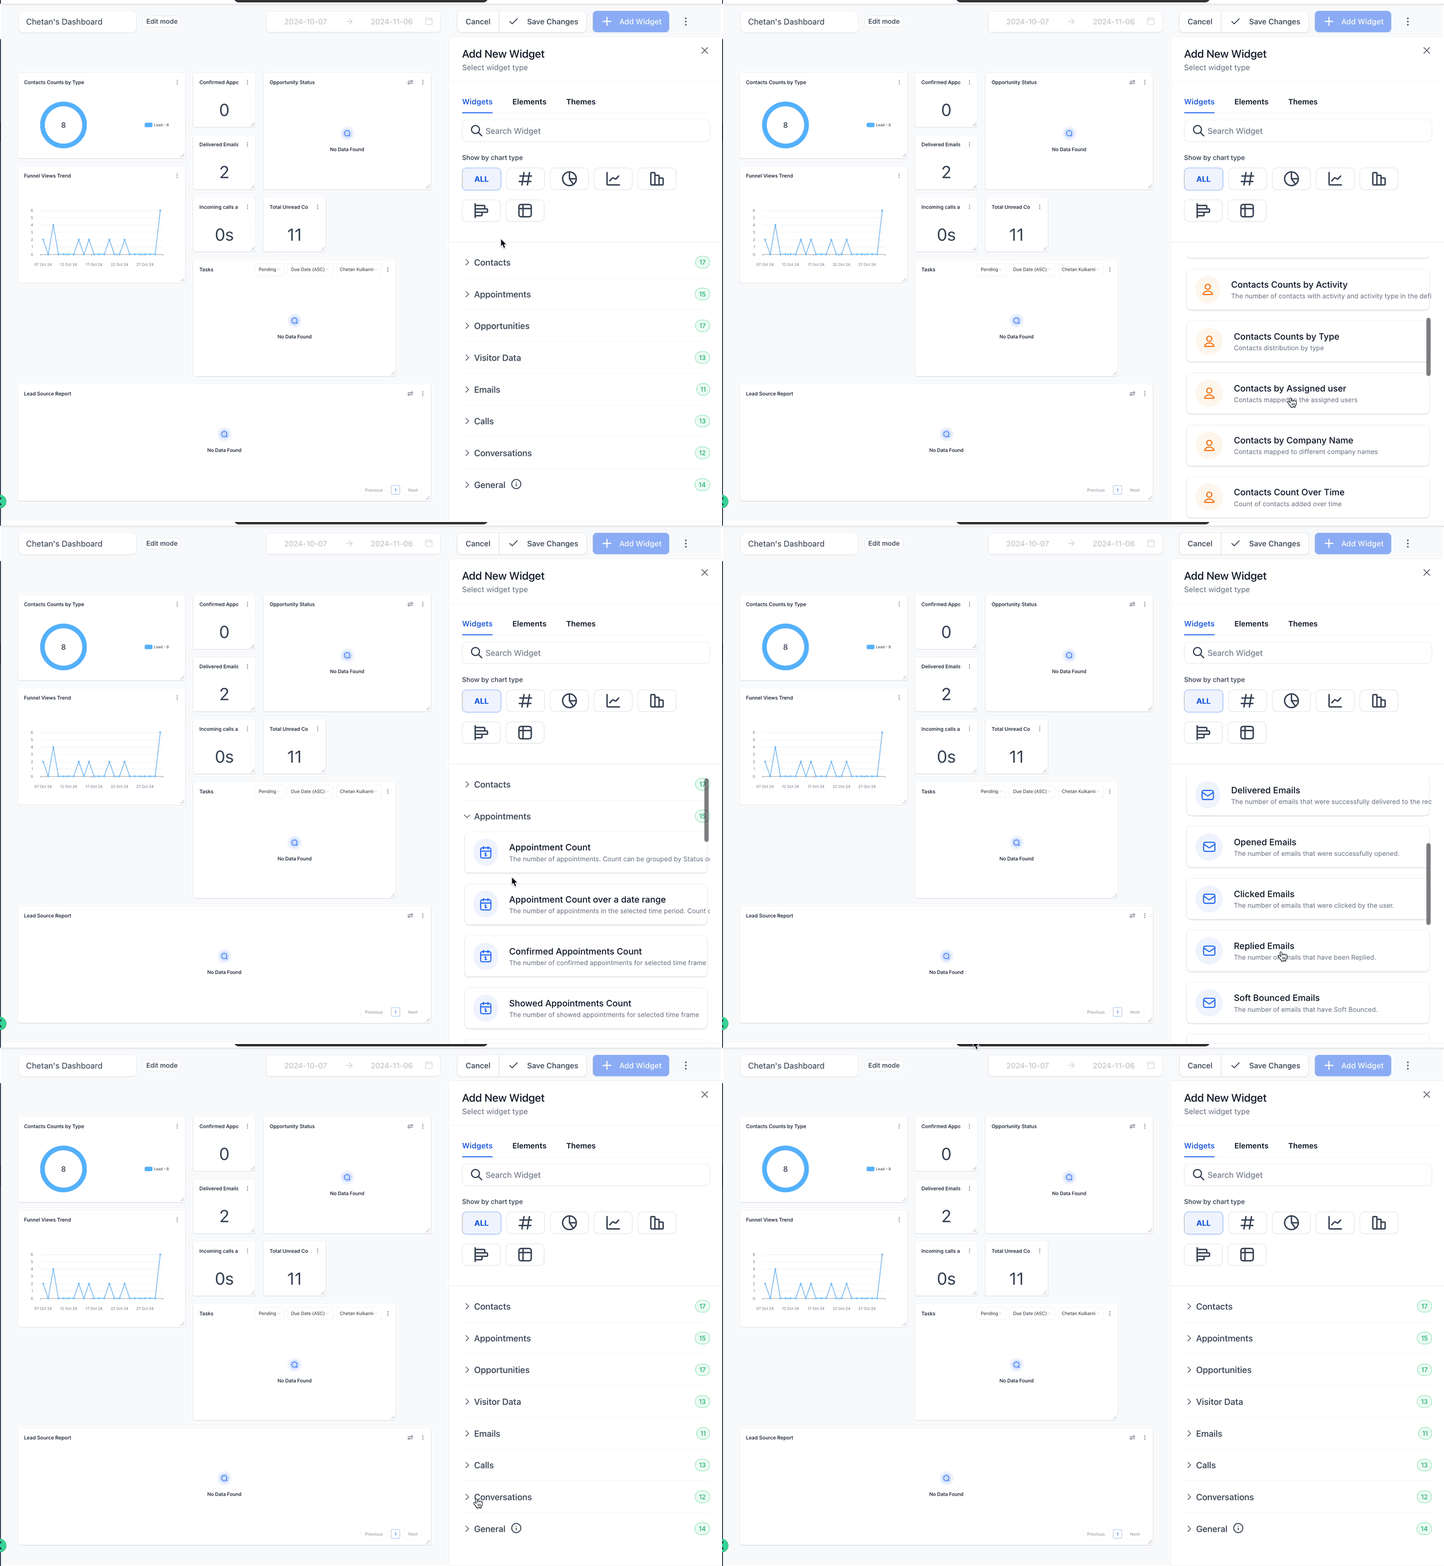
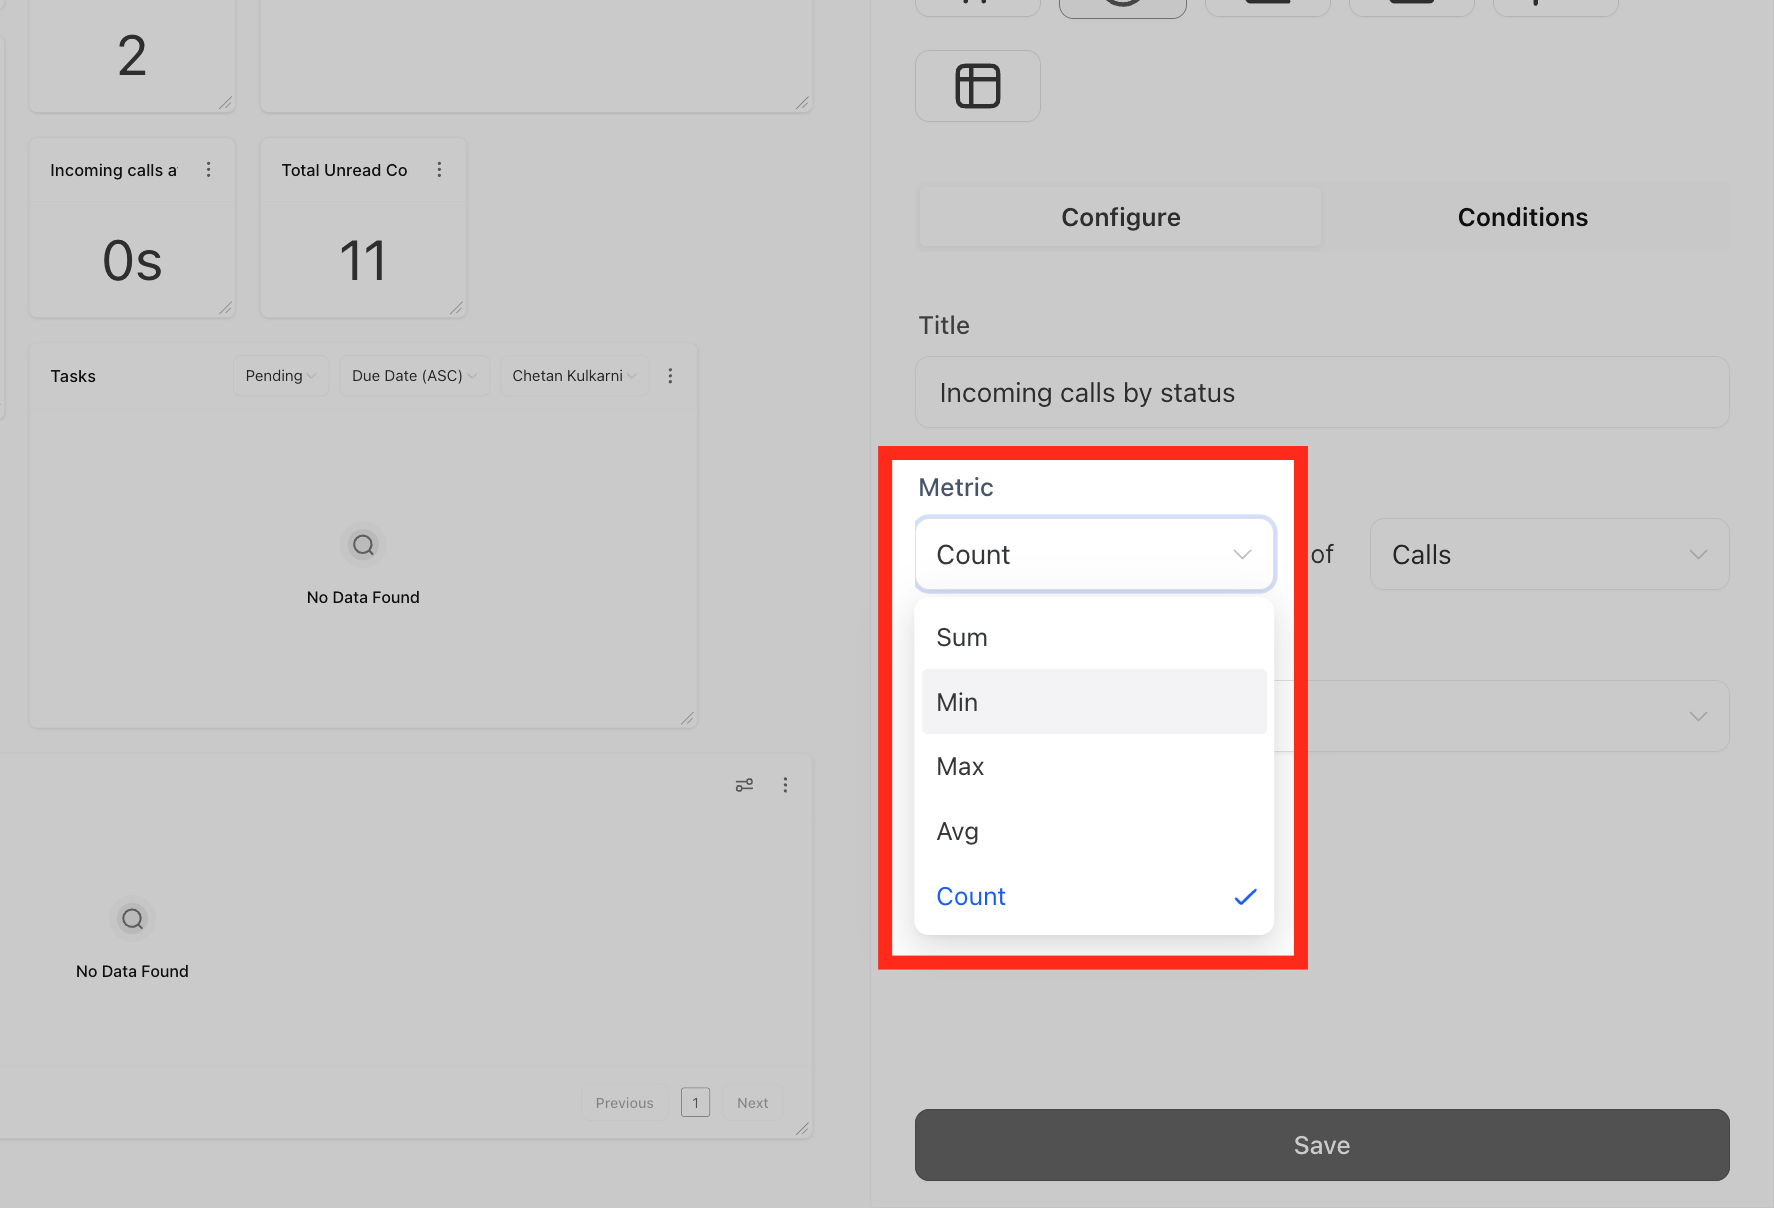
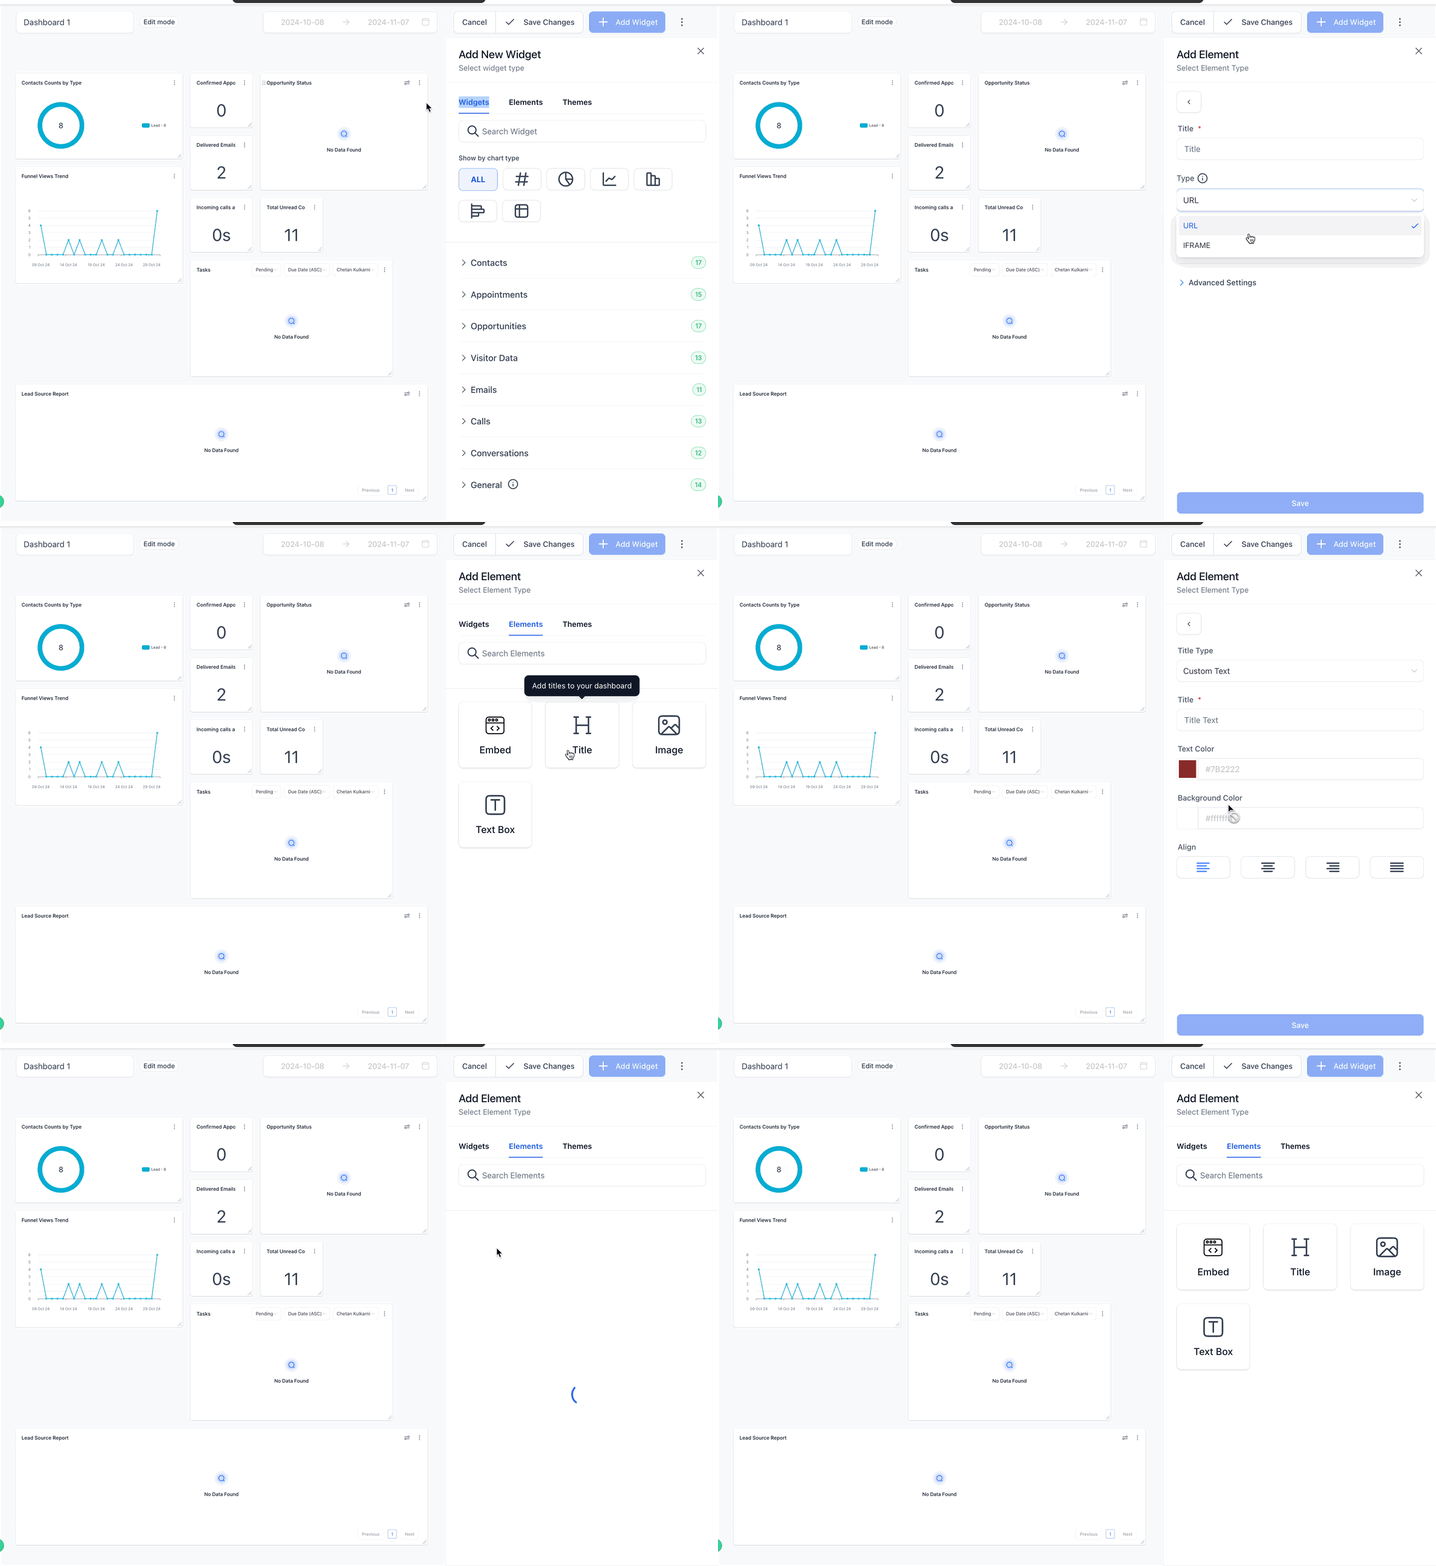
Widgets are organized into categories like Contacts, Appointments, Opportunity, Visitor Data, Emails, Calls, Conversations and General. Each category contains specific widgets that focus on a particular metric. You can choose the chart type, numeric, donut, line, bar, horizontal bar or table, and the metric aggregation method such as sum, min, max, avg or count.
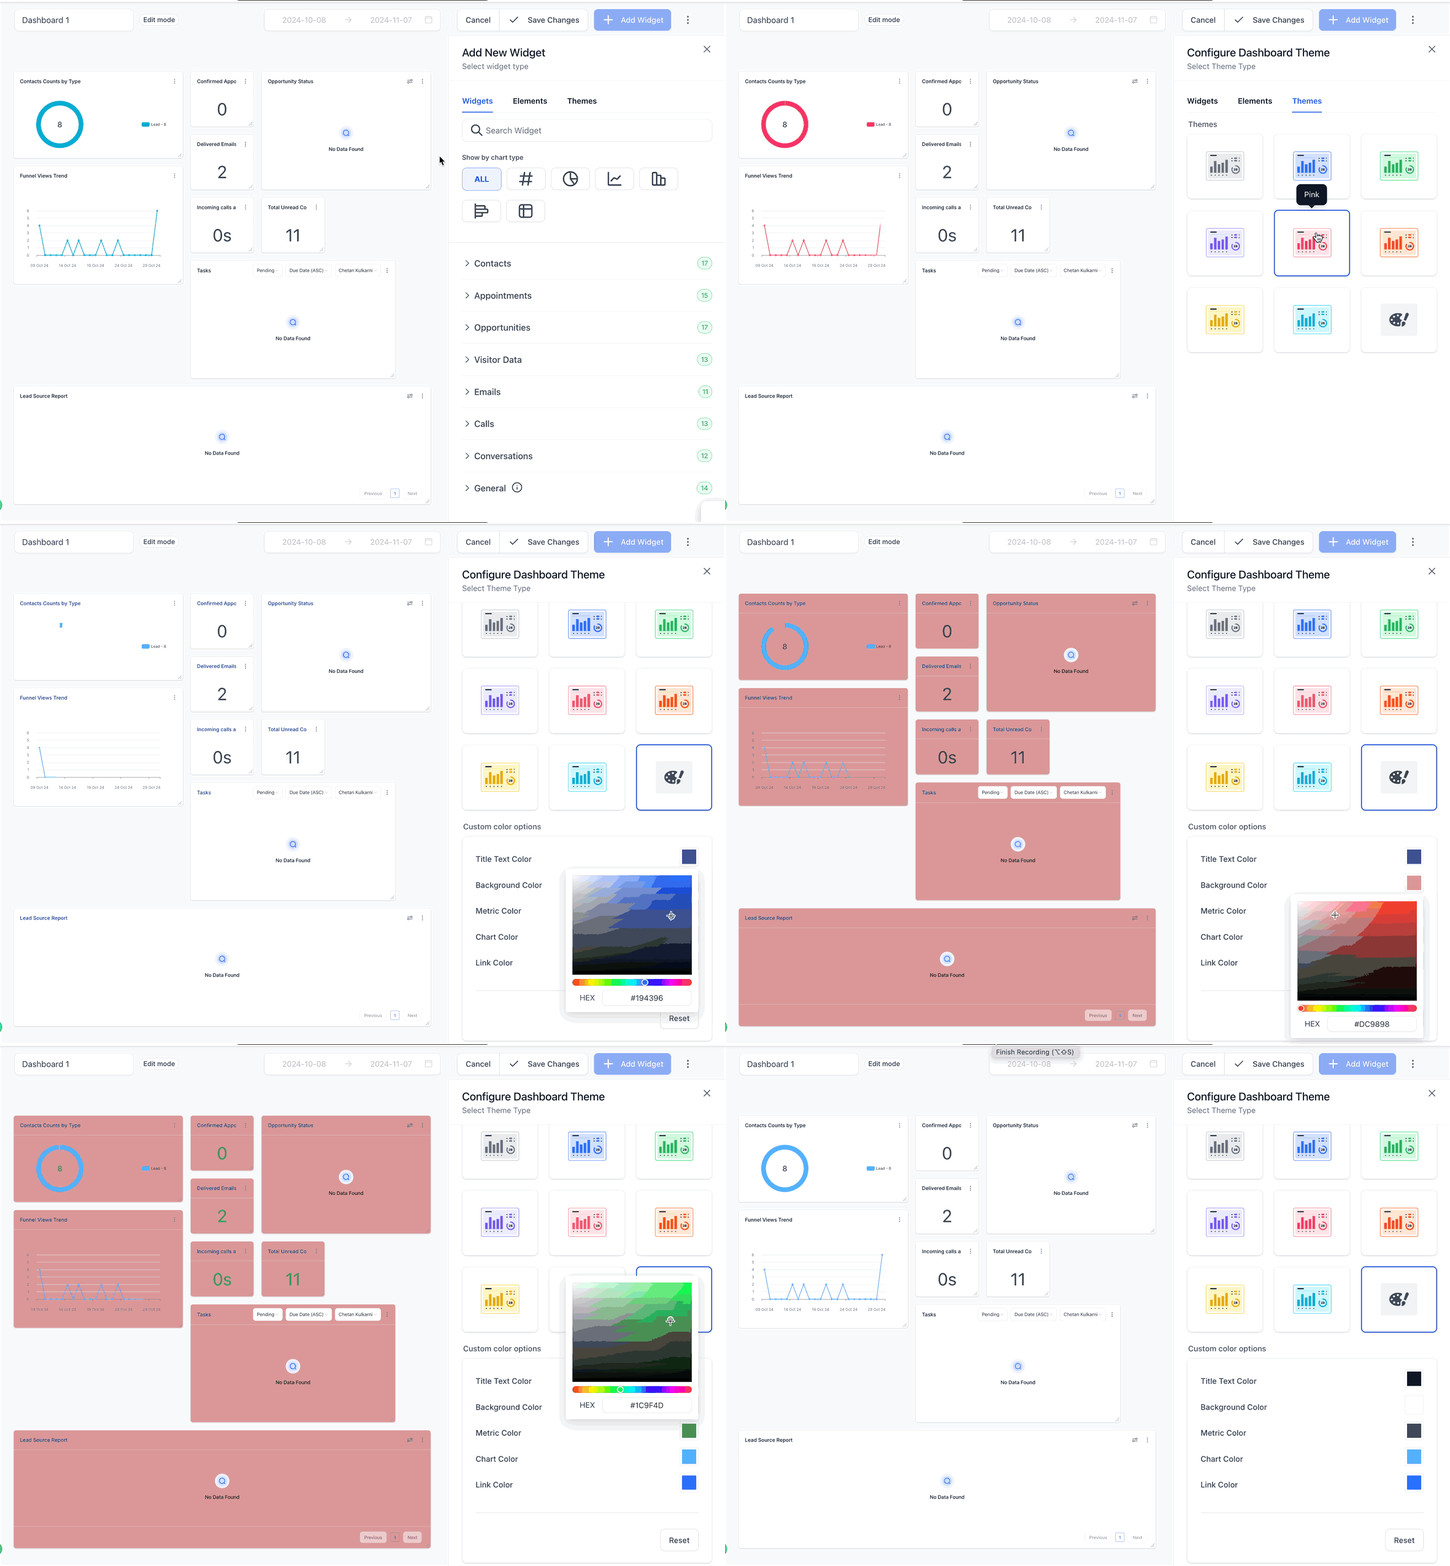
The widget editor lives in the dashboard edit mode. From there you can add, configure, theme and arrange widgets. Themes allow you to apply predefined color schemes or create a custom look for the entire dashboard or individual widgets.
03How businesses use dashboard widgets
- Real estate agency. The agency adds a Contact Count widget to see the total leads generated. It also includes an Appointment Count widget to track scheduled property viewings. Using the dashboard, the team can quickly assess lead flow and booking volume.
- Dental practice. A dental office places an Upcoming Appointments (Week) widget to monitor upcoming patient visits. A Payments widget showing Total Revenue (Last Month) helps the practice keep track of monthly billing without leaving the dashboard.
- SaaS startup. The startup adds an Opportunity Value widget filtered to a specific pipeline to view potential deal size. An Opened Emails widget tracks how many prospect emails are opened, providing insight into campaign performance.
04The numbers and rules that matter
- Customizable dashboard is available exclusively for the $297 plan and beyond (per HighLevel's help center, checked November 2026).
05How to set up and use dashboard widgets in HighLevel
Add a widget to a dashboard
- Open the dashboard where you want the new widget.
- Click the “Add Widget” button located in the top right corner.
- Select a widget category from the list that appears.
- Choose a specific widget and configure its chart type and metric.
- Save the widget to place it on the dashboard.
06What it looks like in HighLevel
07Settings that matter
- Widget Categories. Groups predefined widgets into sections such as Contacts, Appointments, Opportunity, Visitor Data, Emails, Calls, Conversations and General.
- Chart Types Supported. Determines the visual format of a widget, including numeric, donut, line, bar, horizontal bar and table.
- Metrics Supported. Specifies how data is aggregated within a widget, offering sum, min, max, avg or count calculations.
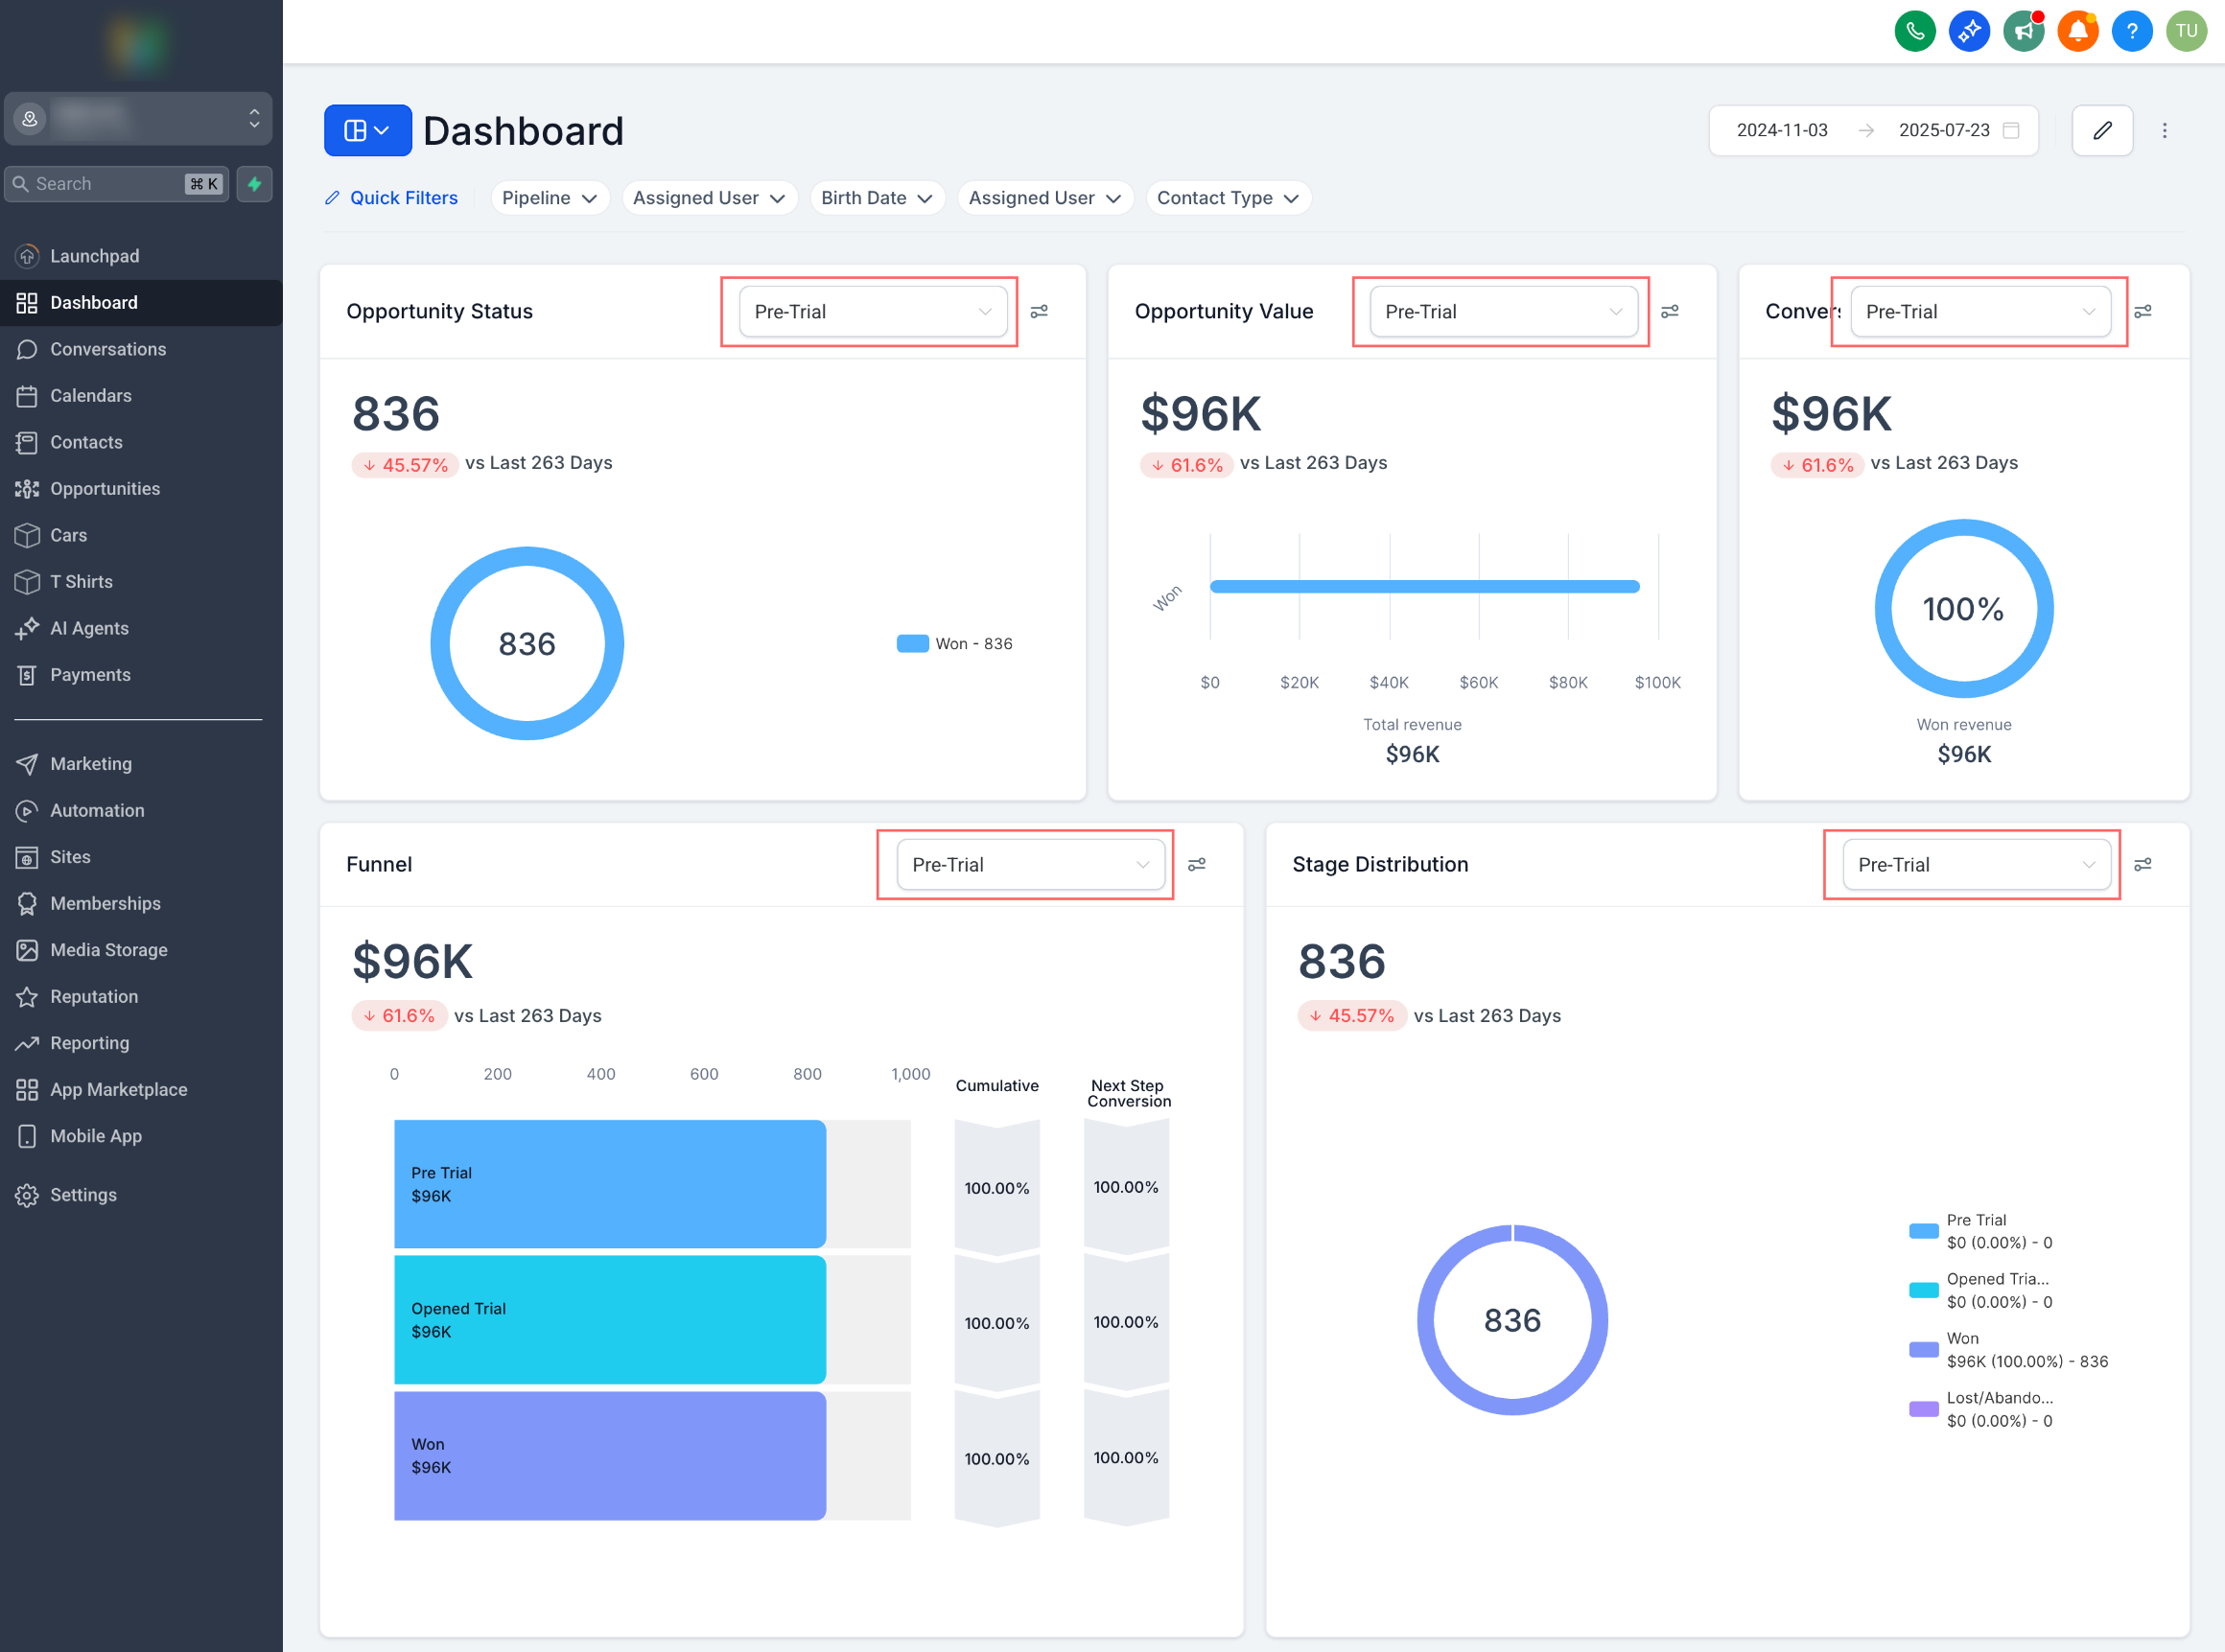
- Pipeline dropdown (in opportunity widgets). Allows you to filter opportunity widgets to display data for a single pipeline instead of all pipelines.
08Things to know before you rely on it
- Customizable dashboards are only available on the $297 plan and beyond (per HighLevel's help center, checked November 2026).
09How it connects to the rest of HighLevel
- Create and add new widgets to a dashboard Add widgets guide
- Customize widget appearance with themes Theme customization
- Manage who can see and edit dashboard widgets Dashboard permissions
Michael's take

Dashboard widgets give a small business a fast visual snapshot of the numbers that matter, from new leads to weekly revenue. They’re a practical way to keep the whole team aligned on performance.
Don’t overload a single dashboard with unrelated widgets; keep it focused for clarity.