
01Who this is for
- Users who need quick visual access to the metrics that drive their decisions.
- Team members who want to compare performance across different time periods.
02Dashboard widgets, explained
Dashboard widgets are visual blocks that display data such as charts, graphs, or tables on a HighLevel dashboard. They pull information from the platform and present it in a format you choose, like line, bar, donut, or pie charts.
You can edit each widget’s title, metrics, grouping, date properties, and limits, and you can add trend indicators that change color based on whether an increase or decrease is considered positive. All customization options appear in the widget’s Edit mode under the Configure, Advanced, and Conditions tabs.
The customized widget remains on the dashboard where you can resize, reposition, and save the overall layout, making the most relevant data visible at a glance.
03How businesses use dashboard widgets
- Business reporting. Edit a widget to display a specific metric, set a comparison date range, and enable a trend indicator that highlights performance changes.
- Source analysis. Add conditions to a widget to include data from multiple sources using OR logic, allowing combined results to be displayed.
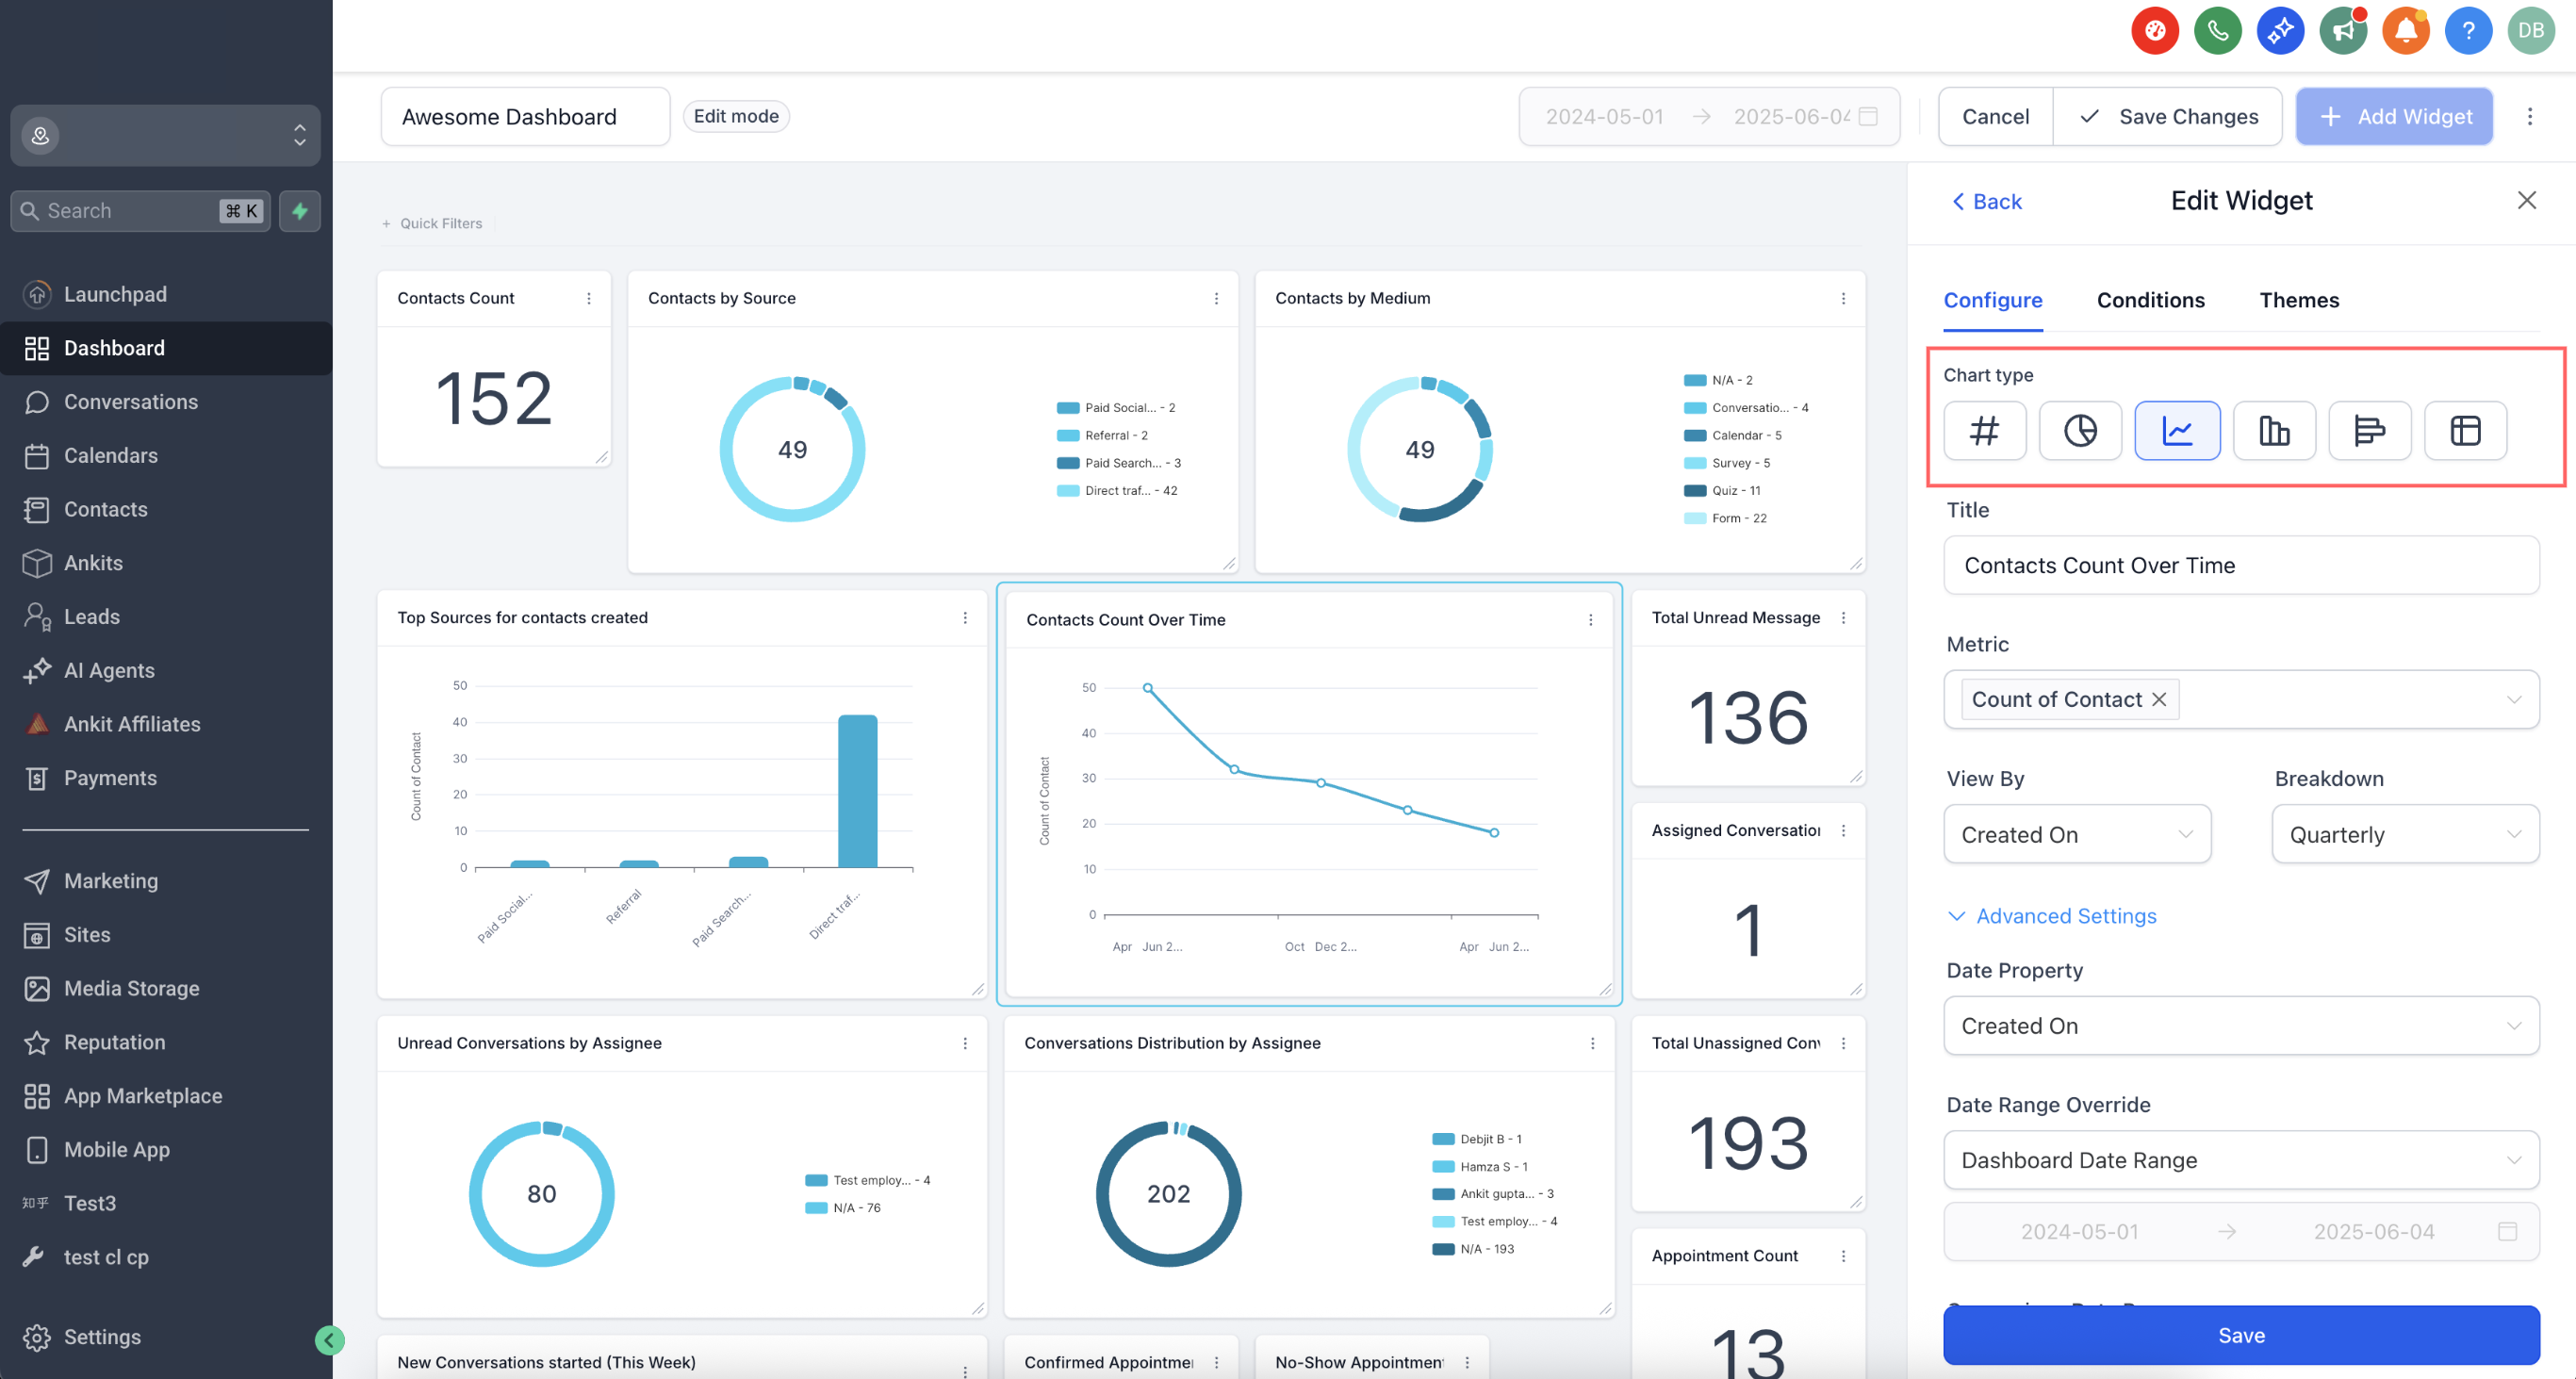
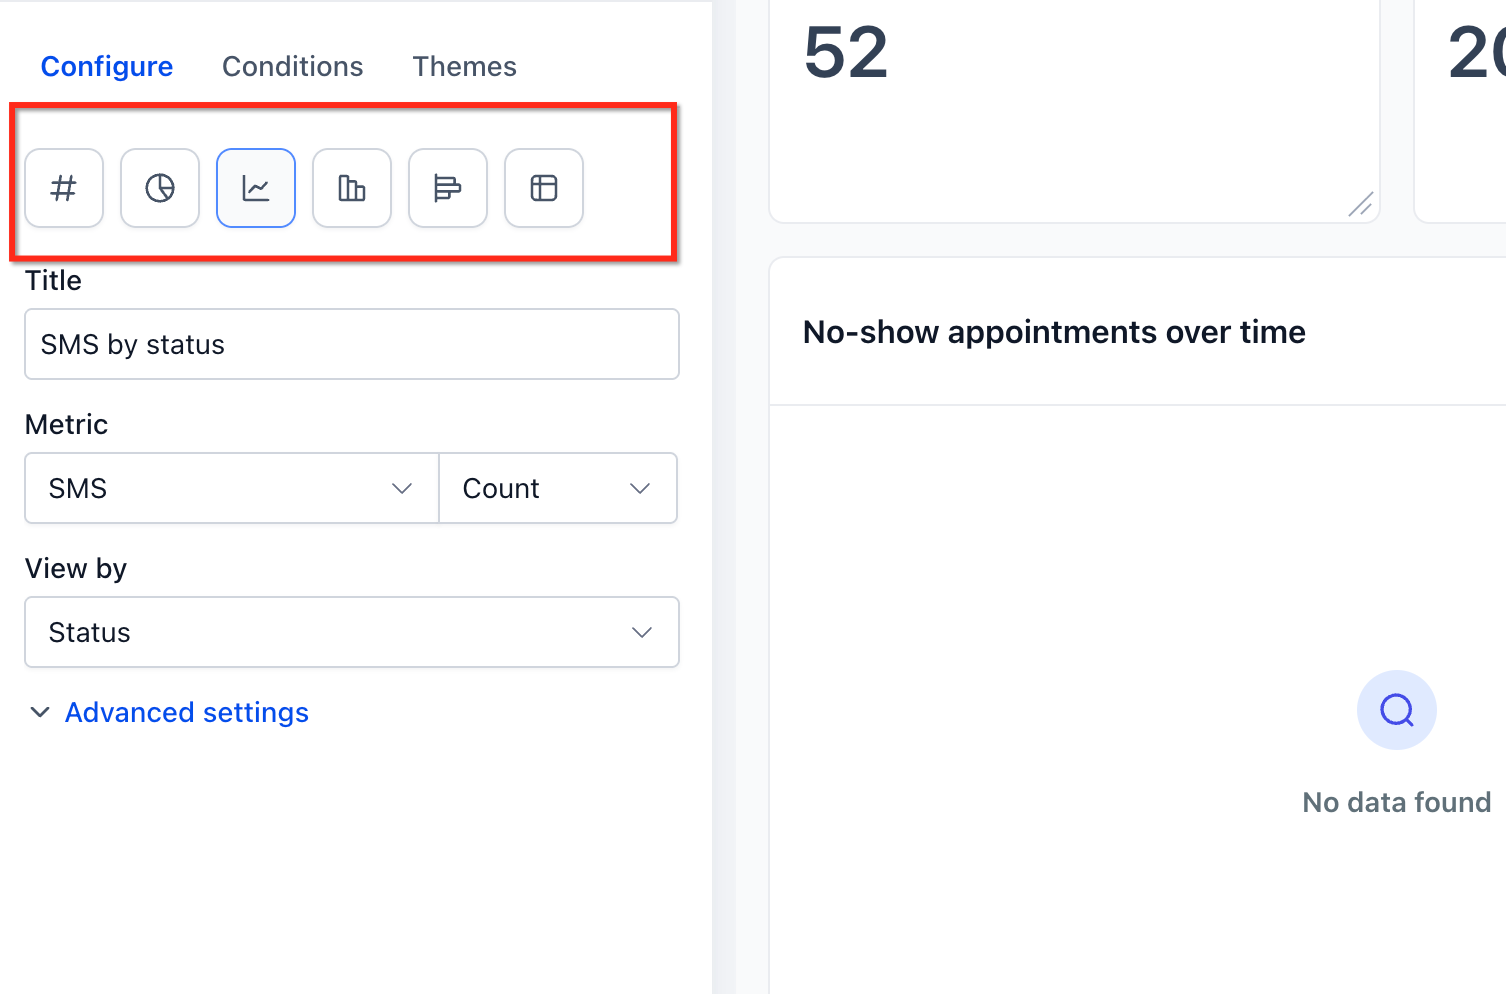
- Visualization adjustment. Change the chart type of a widget, such as switching from a bar chart to a donut chart, and adjust grouping to better represent the data.
04Before you start
- A widget must already exist on a dashboard before it can be edited.
- A comparison date range must be set to display a trend badge.
05How to set up and use dashboard widgets in HighLevel
Edit widget
- Open the desired dashboard.
- Locate the widget you want to modify.
- Open the widget menu (⋮) and choose Edit widget or enter Edit mode and select the widget.
Configure widget settings
- Select the Configure tab inside the widget editor.
- Enter a new title that describes the widget’s data.
- Choose the metrics to display and, if supported, pick multiple metrics.
- Set grouping, view by, or breakdown options as needed for the chart type.
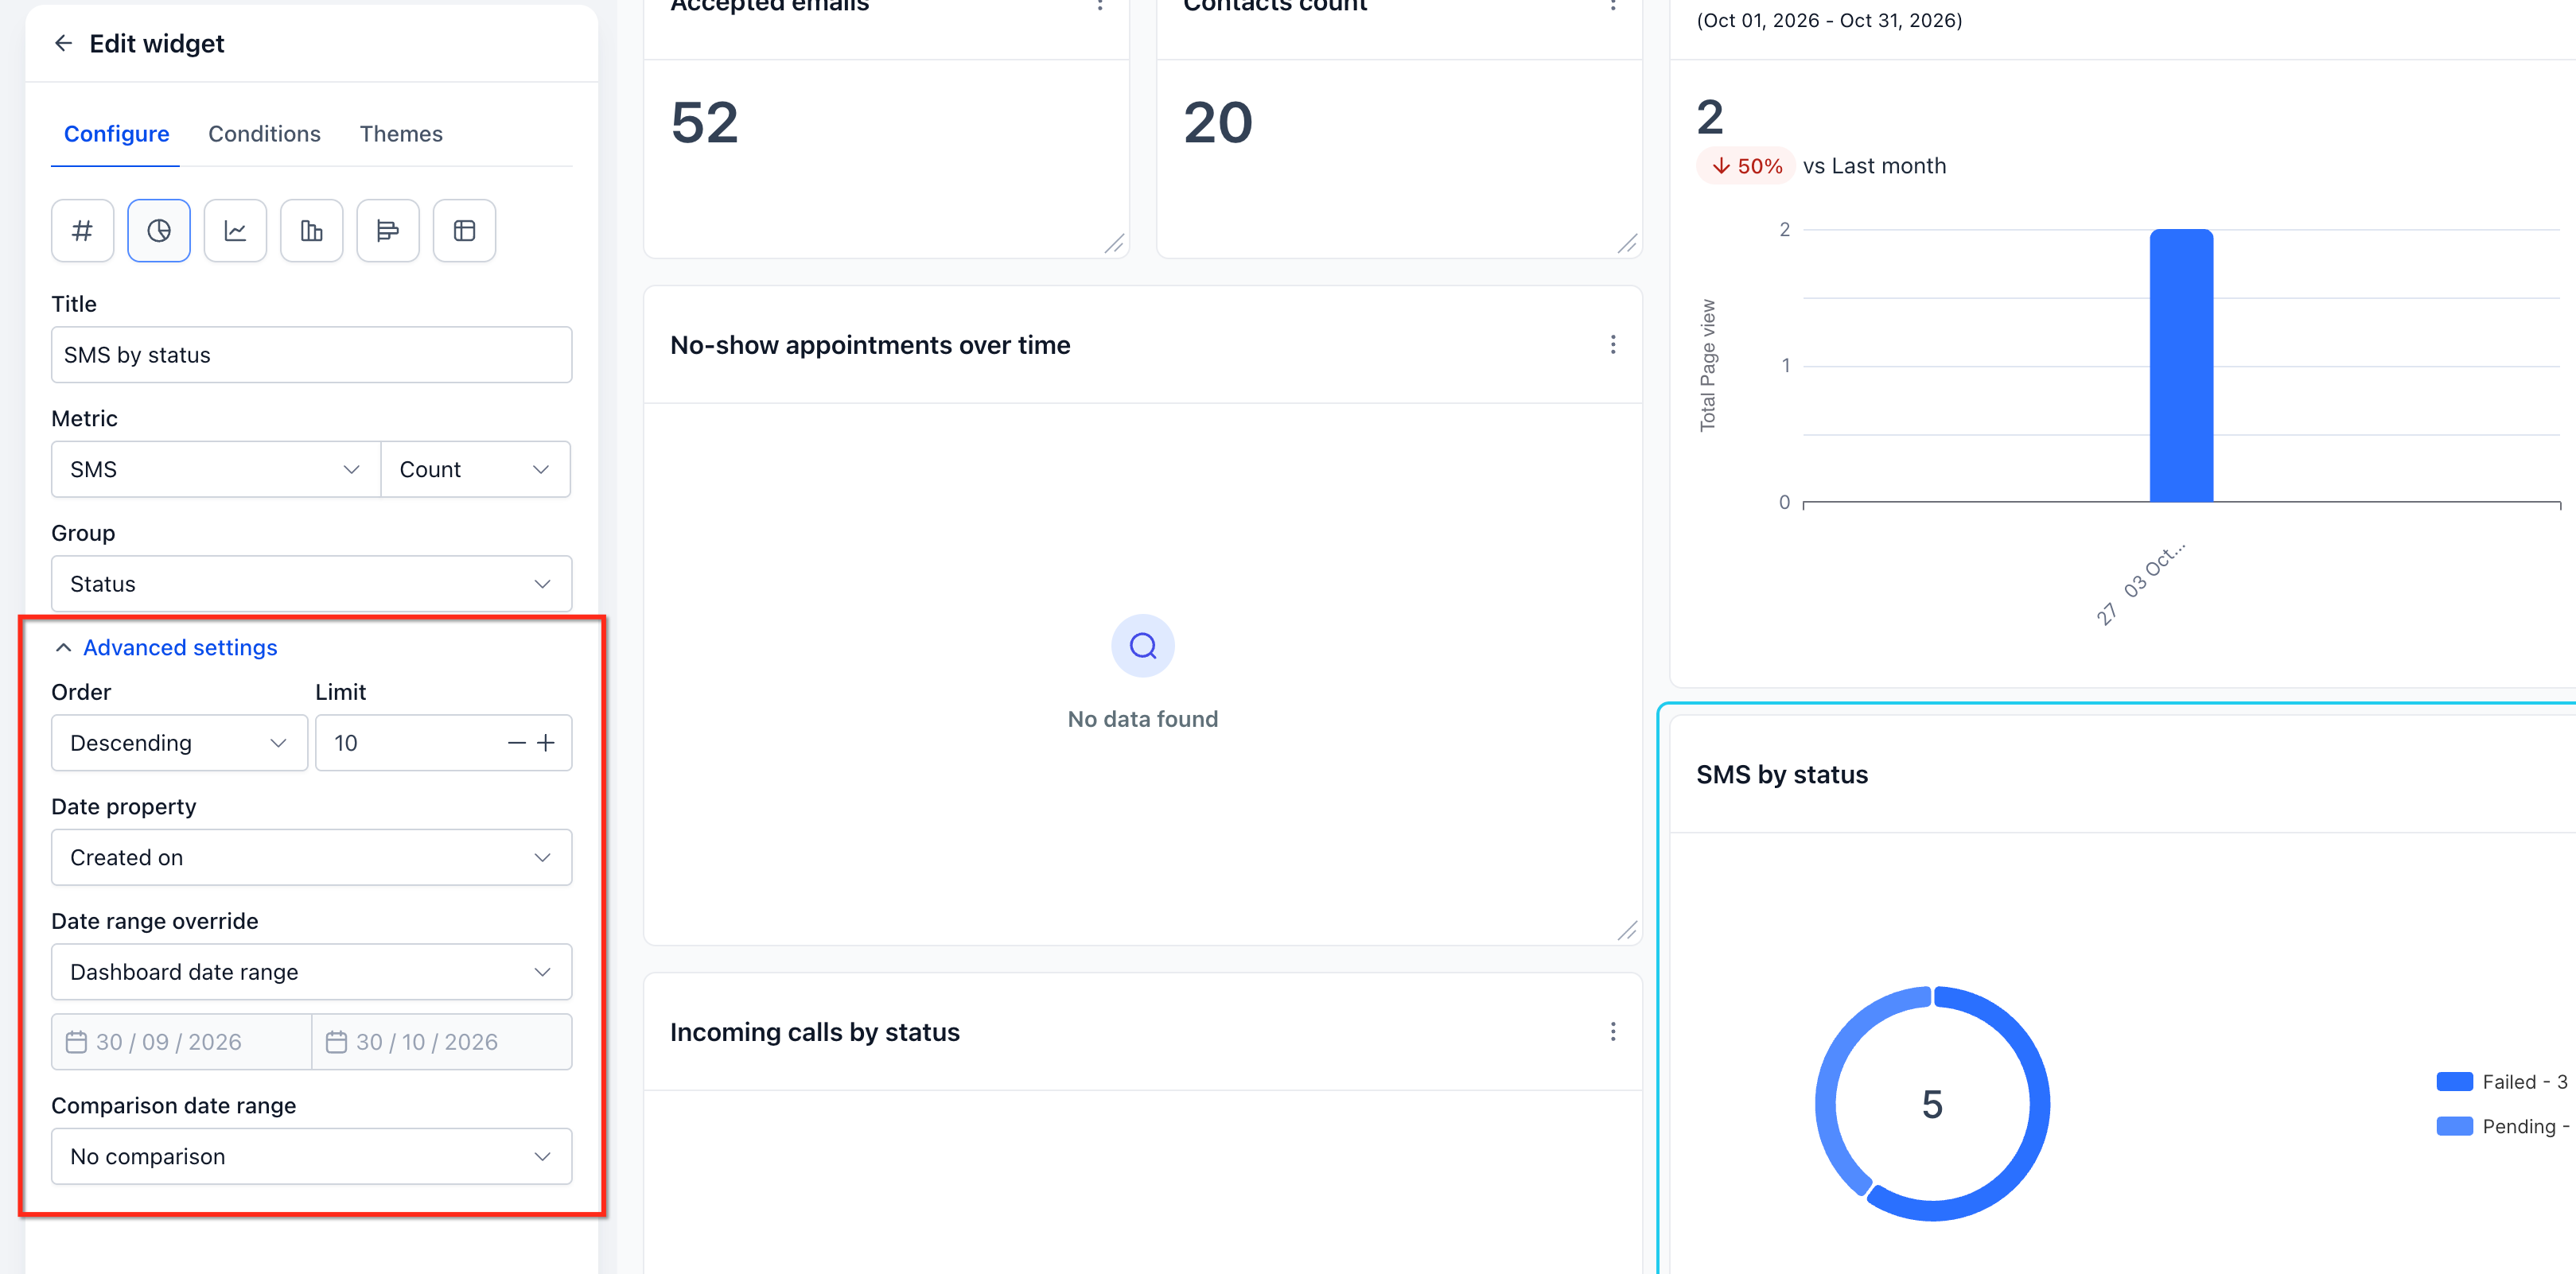
- Define date property, optional date range override, order, limit, and comparison date range.
Set trend indicator
- Open the dashboard that contains the widget.
- Open the widget’s menu (⋮) and select Edit widget.
- Navigate to the Configure tab.
- Expand the Advanced settings section.
- Set a comparison date range such as Previous 7 days.
- Choose whether an increase or a decrease is positive and click Save changes.
Add conditions
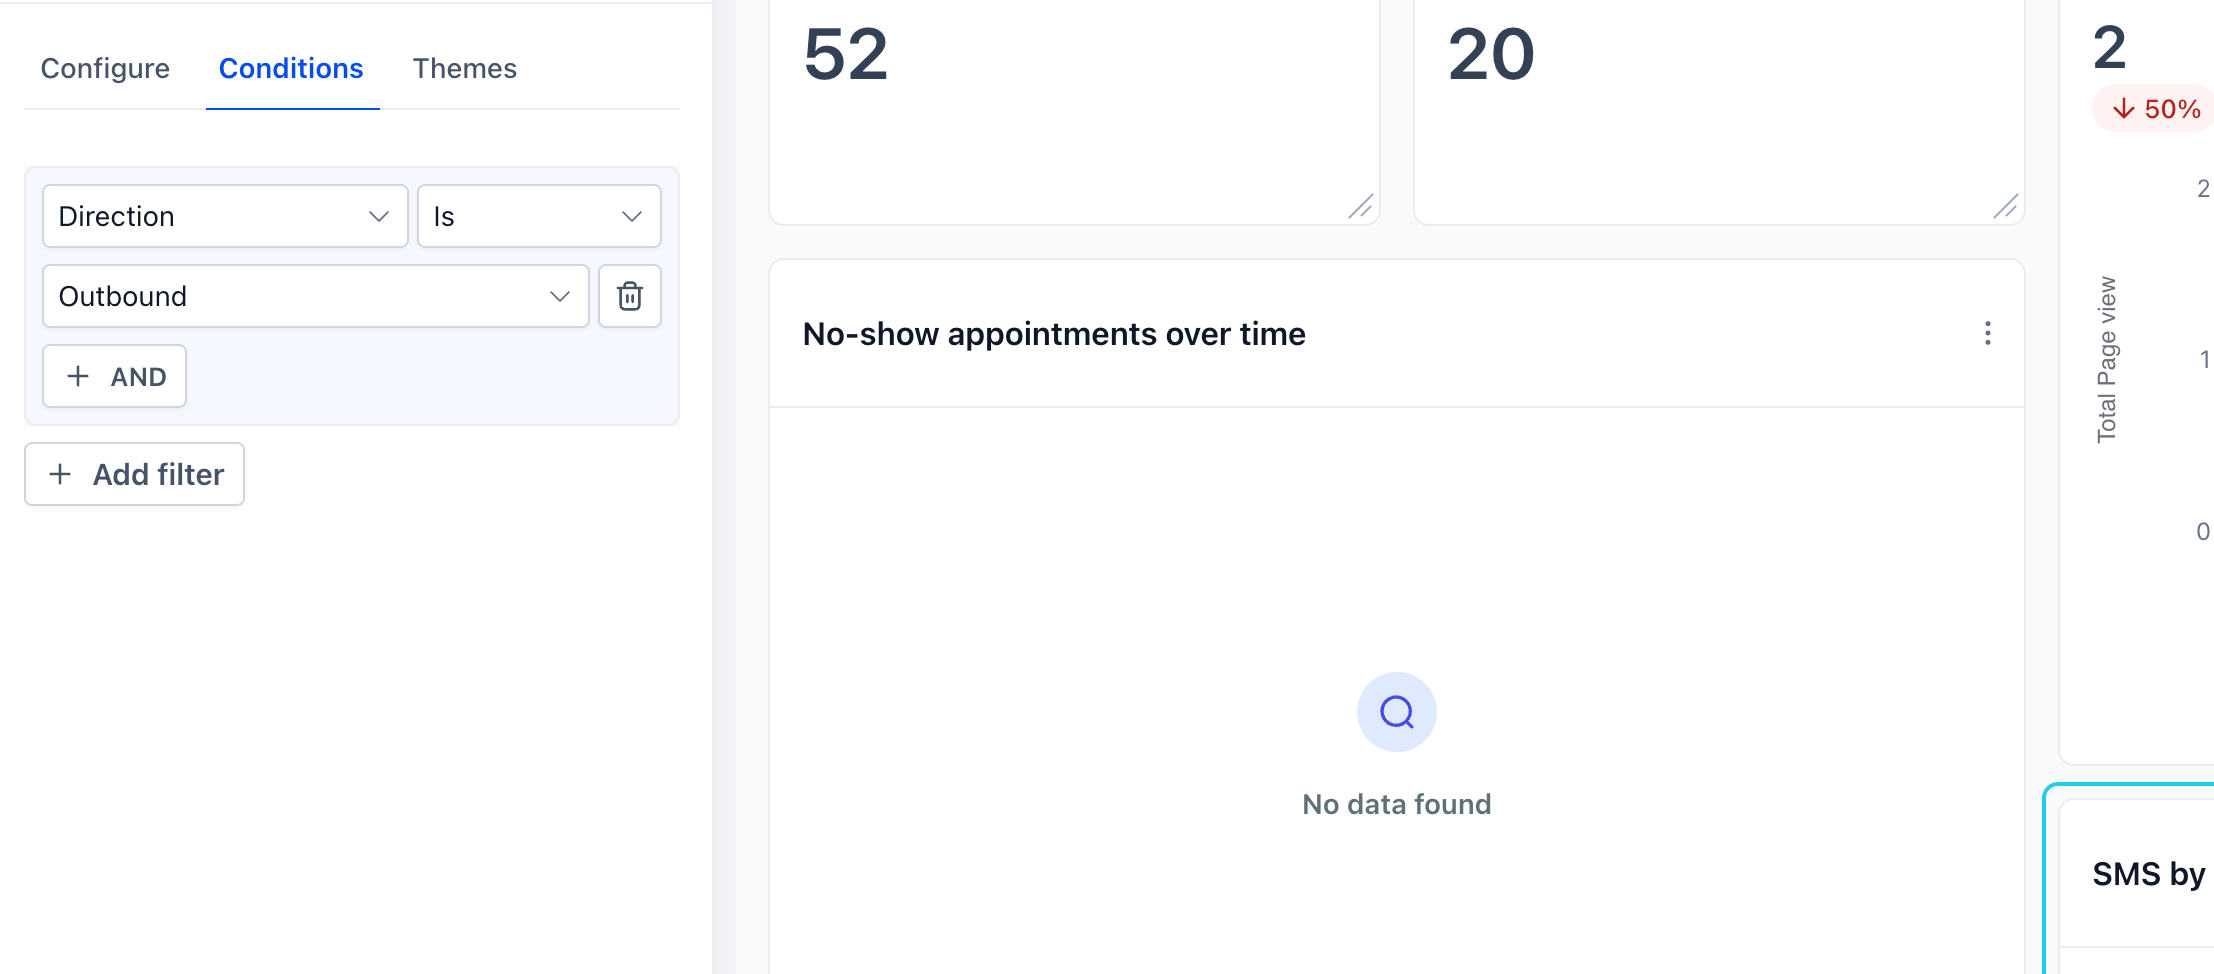
- Open the widget’s Conditions tab.
- Click Add Condition.
- Select the field, operator, and required value.
- Add more conditions using the available AND/OR options.
- Review the filter list and save the changes.
Create nested filter groups
- Open the widget’s Conditions tab.
- Click Add Filter to start the first filter group.
- Use the +AND button to add additional conditions within that group.
- Click +Add Filter to create a second group that uses OR logic.
- Add the needed conditions to the new group and save the widget.
Save widget and layout
- Click Save or Save changes on the widget editing pane.
- Resize or move the widget on the dashboard if necessary.
- Save the overall dashboard layout to apply all modifications.
06What it looks like in HighLevel
07Settings that matter
- Title. The text that appears above the widget to identify its purpose.
- Metrics. The specific data points the widget visualizes; multiple metrics are allowed for line, bar, and horizontal bar charts.
- Group. The category used to organize data for chart types such as donut charts.
- View By. A secondary dimension that can be applied to supported visualizations.
- Breakdown. The frequency (e.g., daily, weekly) used to slice data over time.
- Date Property. The date field, such as Created Date or Updated Date, that determines which records are included.
- Date Range Override. A specific date range for the widget that overrides the dashboard’s global date range.
- Order. The sort direction, ascending or descending, applied to the displayed results.
- Limit. The maximum number of records the widget will show.
- Comparison date range. The period used to calculate percentage change and display the trend badge.
- Specify whether a metric's increase or decrease is positive. Controls the color of the trend badge, showing green for a positive outcome and red for a negative one.
08Things to know before you rely on it
- Visitor Data Widgets support only a single filter group.
- The trend indicator setting changes only the badge color, not the underlying metric values.
- A comparison date range is required for the trend badge to appear.
- Widgets keep the default "increase is positive" setting until it is manually changed.
- If no records match the selected conditions, the widget may block saving until filters are adjusted.
09If something goes wrong
- Inline warning appears for conflicting filters. Edit the highlighted filters to remove the conflict and then save the widget.
- Widget cannot be saved because no data matches the filters. Modify or remove filter conditions until at least one record meets the criteria.
10How it connects to the rest of HighLevel
- Step by step guide to add and customize dashboard widgets Add and customize widgets
- Instructions for creating custom dashboards in HighLevel Create custom dashboards
- HighLevel pricing and plan details for access to dashboard features Pricing
Michael's take

Customizing widgets lets you see the exact numbers you track each day on the dashboard, with colors that indicate metric changes at a glance.
If you have many metrics that change infrequently, you might prefer a simpler dashboard layout or standard reports.