
01Who this is for
- Sales managers who need to see how deals move through stages to spot conversion bottlenecks.
- Marketing directors who monitor current pipeline health to allocate resources efficiently.
02Funnel and stages distribution widgets, explained
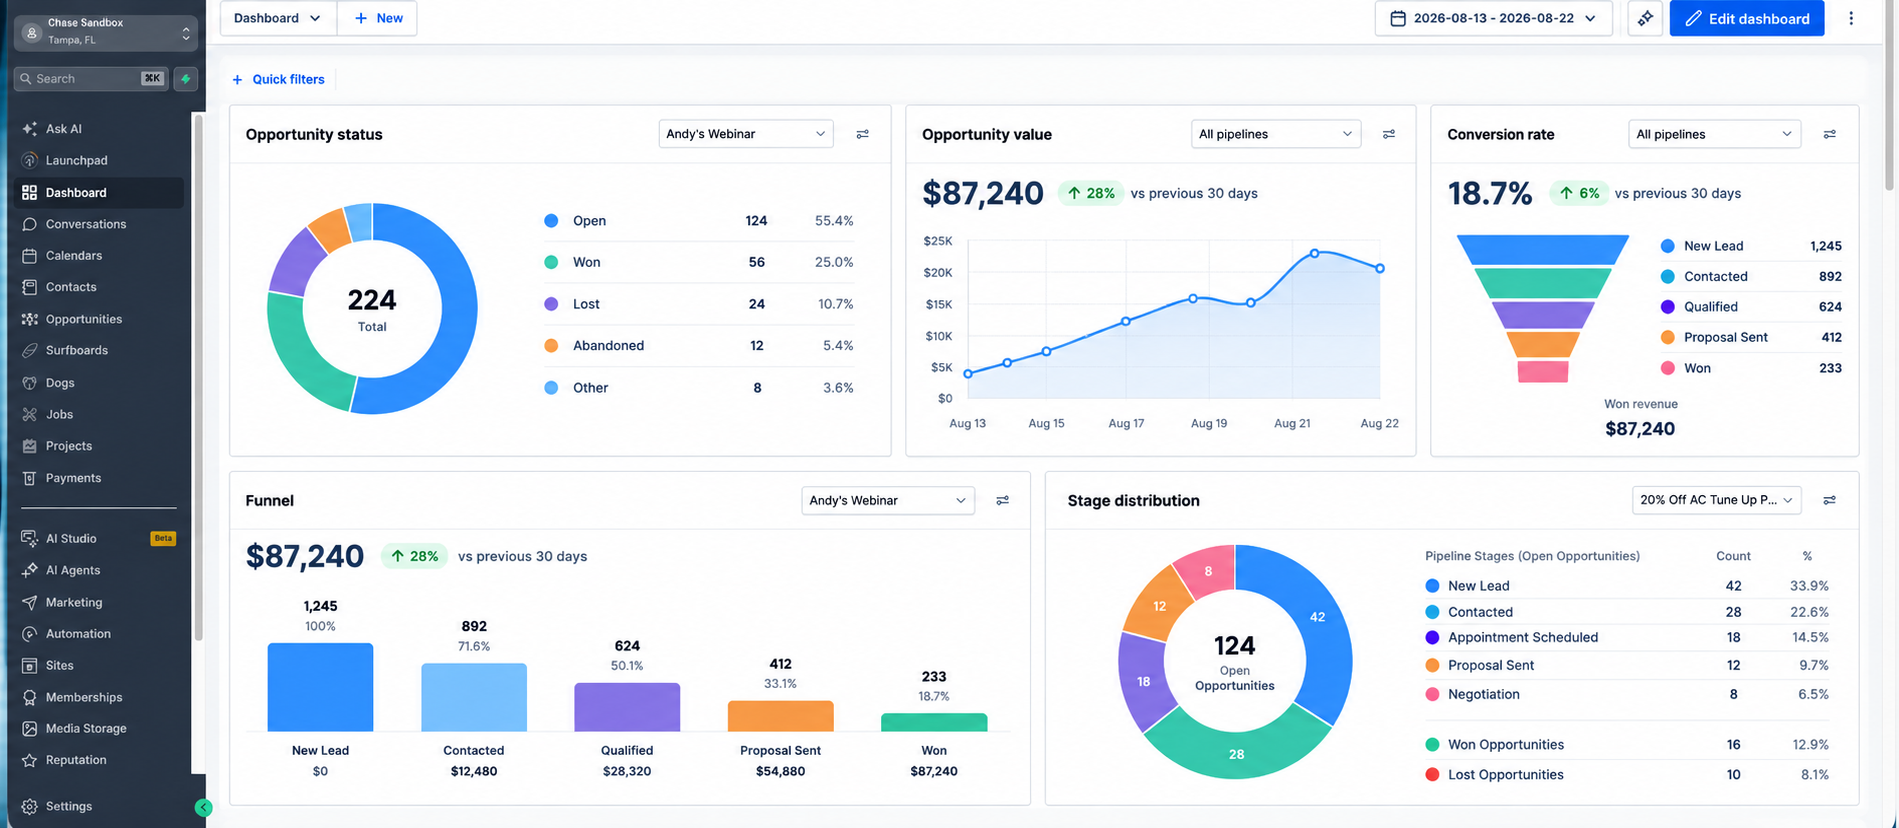
The Funnel widget aggregates opportunities that have reached each visible stage or moved beyond it, using cumulative logic. It calculates counts and revenue based on the last status change date of each opportunity and includes Won opportunities in earlier sections.
The Stages Distribution widget presents open opportunities in the exact stage where they sit at the moment. It also lists Won and Lost opportunities as separate categories, giving a snapshot of current pipeline composition.
Both widgets are added as General widgets on a dashboard. Users select the desired pipeline from a dropdown inside the widget, and they can control which stages appear by configuring pipeline visibility settings.
03How businesses use funnel and stages distribution widgets
- SaaS startup. The team enables the funnel icon on key stages to view conversion rates across the sales funnel, then adds the widget to their dashboard for monitoring of deal flow.
- Consulting firm. They activate the pie chart icon on stages like Proposal Sent and Follow Up Required, place a Stages Distribution widget on their dashboard, and watch where active opportunities are located.
- Real estate agency. Agents turn on both icons for the pipeline, add both widgets to a shared dashboard, and compare cumulative conversion with current listing statuses without leaving the dashboard view.
04Before you start
- Create at least one pipeline with opportunity stages.
- Enable the applicable stages for Funnel or pie chart reporting.
- Make sure the user has the Dashboard Stats permission.
- Ensure the user can access the dashboard that will contain the widget.
- Arrange Funnel stages in the order opportunities are expected to progress.
05How to set up and use funnel and stages distribution widgets in HighLevel
Configure pipeline visibility
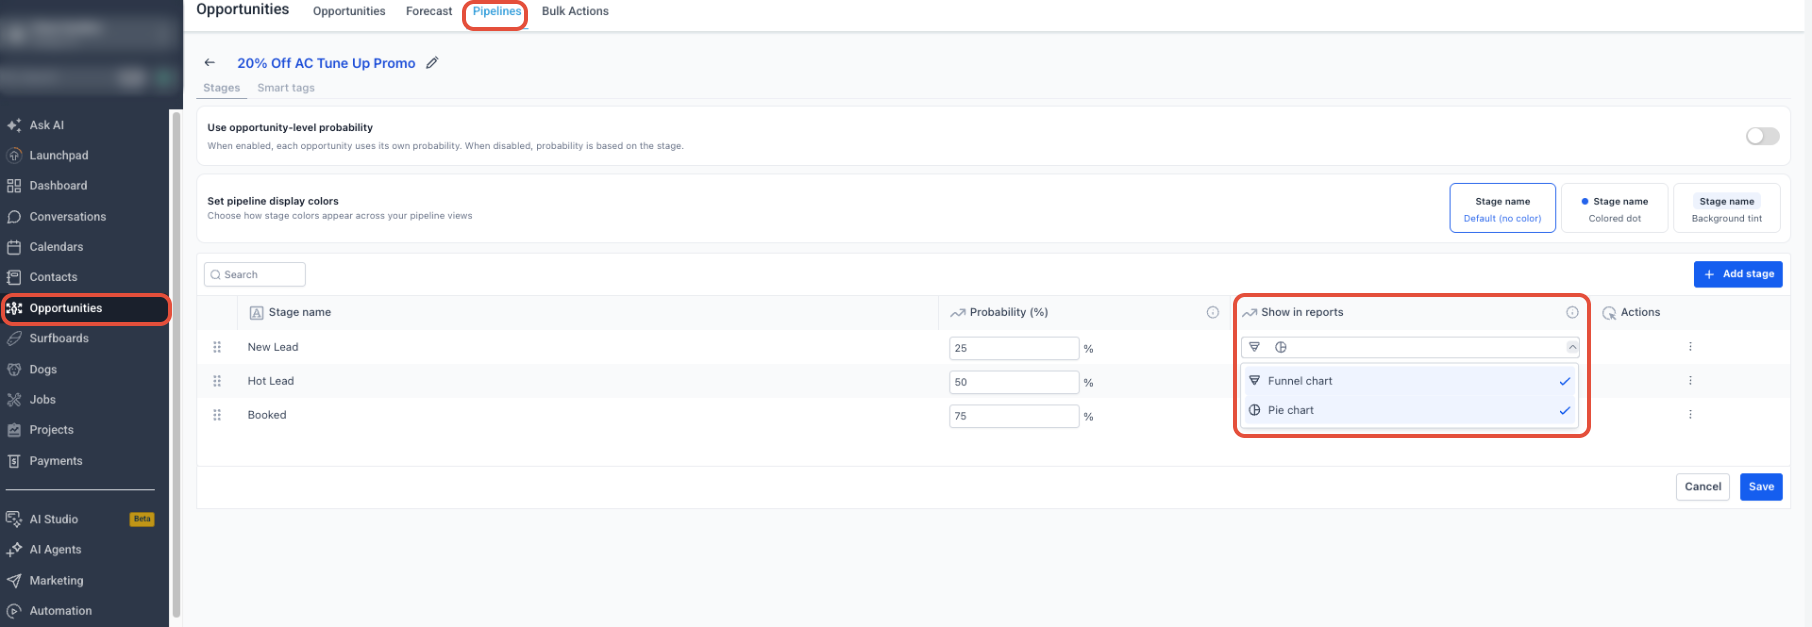
- From the Subaccount View, click Opportunities.
- Select Pipelines.
- Open the pipeline you want to configure.
- Locate the pipeline stages.
- Click the funnel icon to set Funnel reporting visibility for a stage.
- Click the pie chart icon to set Stages Distribution reporting visibility for a stage.
- Save the pipeline changes.
Add Funnel or Stages Distribution to a dashboard
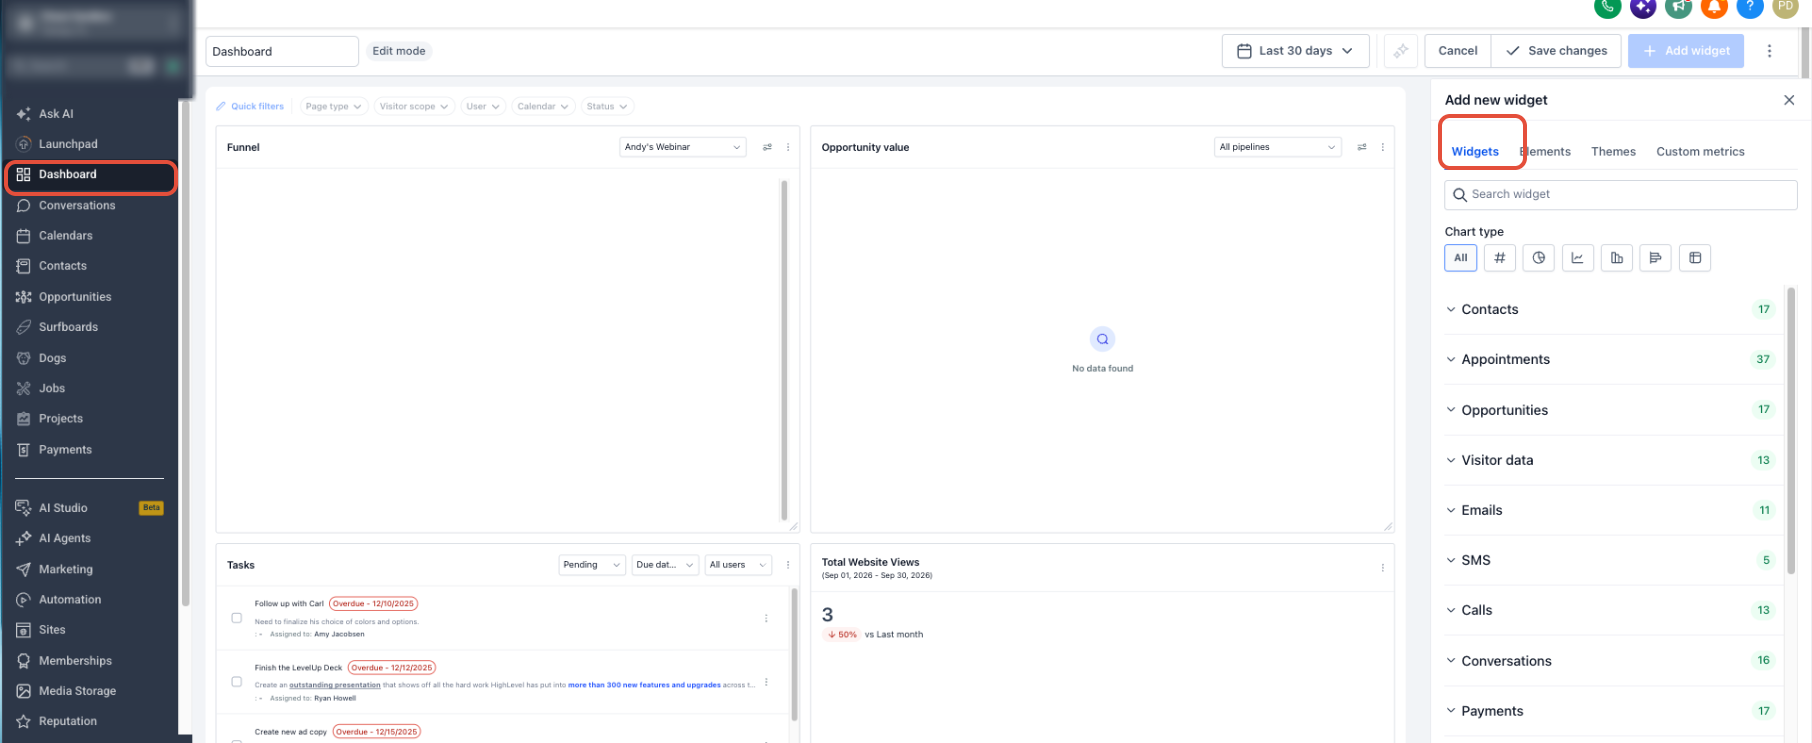
- From the Subaccount View, open Dashboard.
- Open the dashboard you want to modify.
- Click Edit Dashboard.
- Click + Add Widget.
- Choose the General widget category.
- Select Funnel or Stages Distribution.
- Adjust the widget settings as needed.
- Move or resize the widget on the canvas.
- Click Save Changes.
06What it looks like in HighLevel
07Settings that matter
- funnel icon. Controls whether a pipeline stage is included in Funnel reporting.
- pie, chart icon. Controls whether a pipeline stage is included in Stages Distribution reporting.
08Things to know before you rely on it
- Won and Lost are opportunity statuses; they do not need to be created as pipeline stages.
- Funnel calculations use the opportunity's last status change date, not the Created date, when evaluating the selected reporting period.
- Pipeline stages must be arranged in the order opportunities are expected to progress for accurate Funnel reporting.
09If something goes wrong
- A pipeline stage is missing from Funnel or Stages Distribution.. Edit the pipeline and enable the appropriate Funnel or pie chart visibility control for that stage.
10How it connects to the rest of HighLevel
- Learn about dashboard widgets and how to add them. Dashboard widgets
- Step by step guide to creating and adding dashboard widgets. Add widgets guide
- View HighLevel pricing and plan options. Pricing
Michael's take

Pair it with a Funnel widget on the same dashboard and you get a clear picture of both current health and conversion trends without digging into separate reports.
If you are only interested in high level conversion rates and don’t need a real time snapshot of each stage, the extra effort to set up both widgets may not be worth it. A single Funnel widget often gives enough insight for strategic planning, and adding the distribution view could add unnecessary complexity.