
No more guessing how your community is doing. The new Analytics dashboard gives admins and owners a single view of revenue, membership, traffic, and engagement, with flexible date filters and data exports.
Michael's take
I like this update because it isn’t flashy but it finally puts the numbers you need in one place.
If you already run a HighLevel Community you now have a Settings > Analytics screen that shows earnings, membership counts, traffic sources and engagement with a single date filter.
I would open the dashboard, toggle through the preset date ranges and make sure the totals match what I see in my finance and member reports. I’d also export the inactive members list and verify the CSV matches the members I know are quiet.
In a real business I can glance at the heatmap to schedule a live Q&A during the busiest hour, then use the traffic source breakdown to double down on the channel that brings the most new members.
Technology should remove guesswork, not add more spreadsheets to manage.
It’s worth checking out for anyone who runs a community and wants the health metrics in front of them without hopping between tools.
** What’s New?
Community Analytics Dashboard **
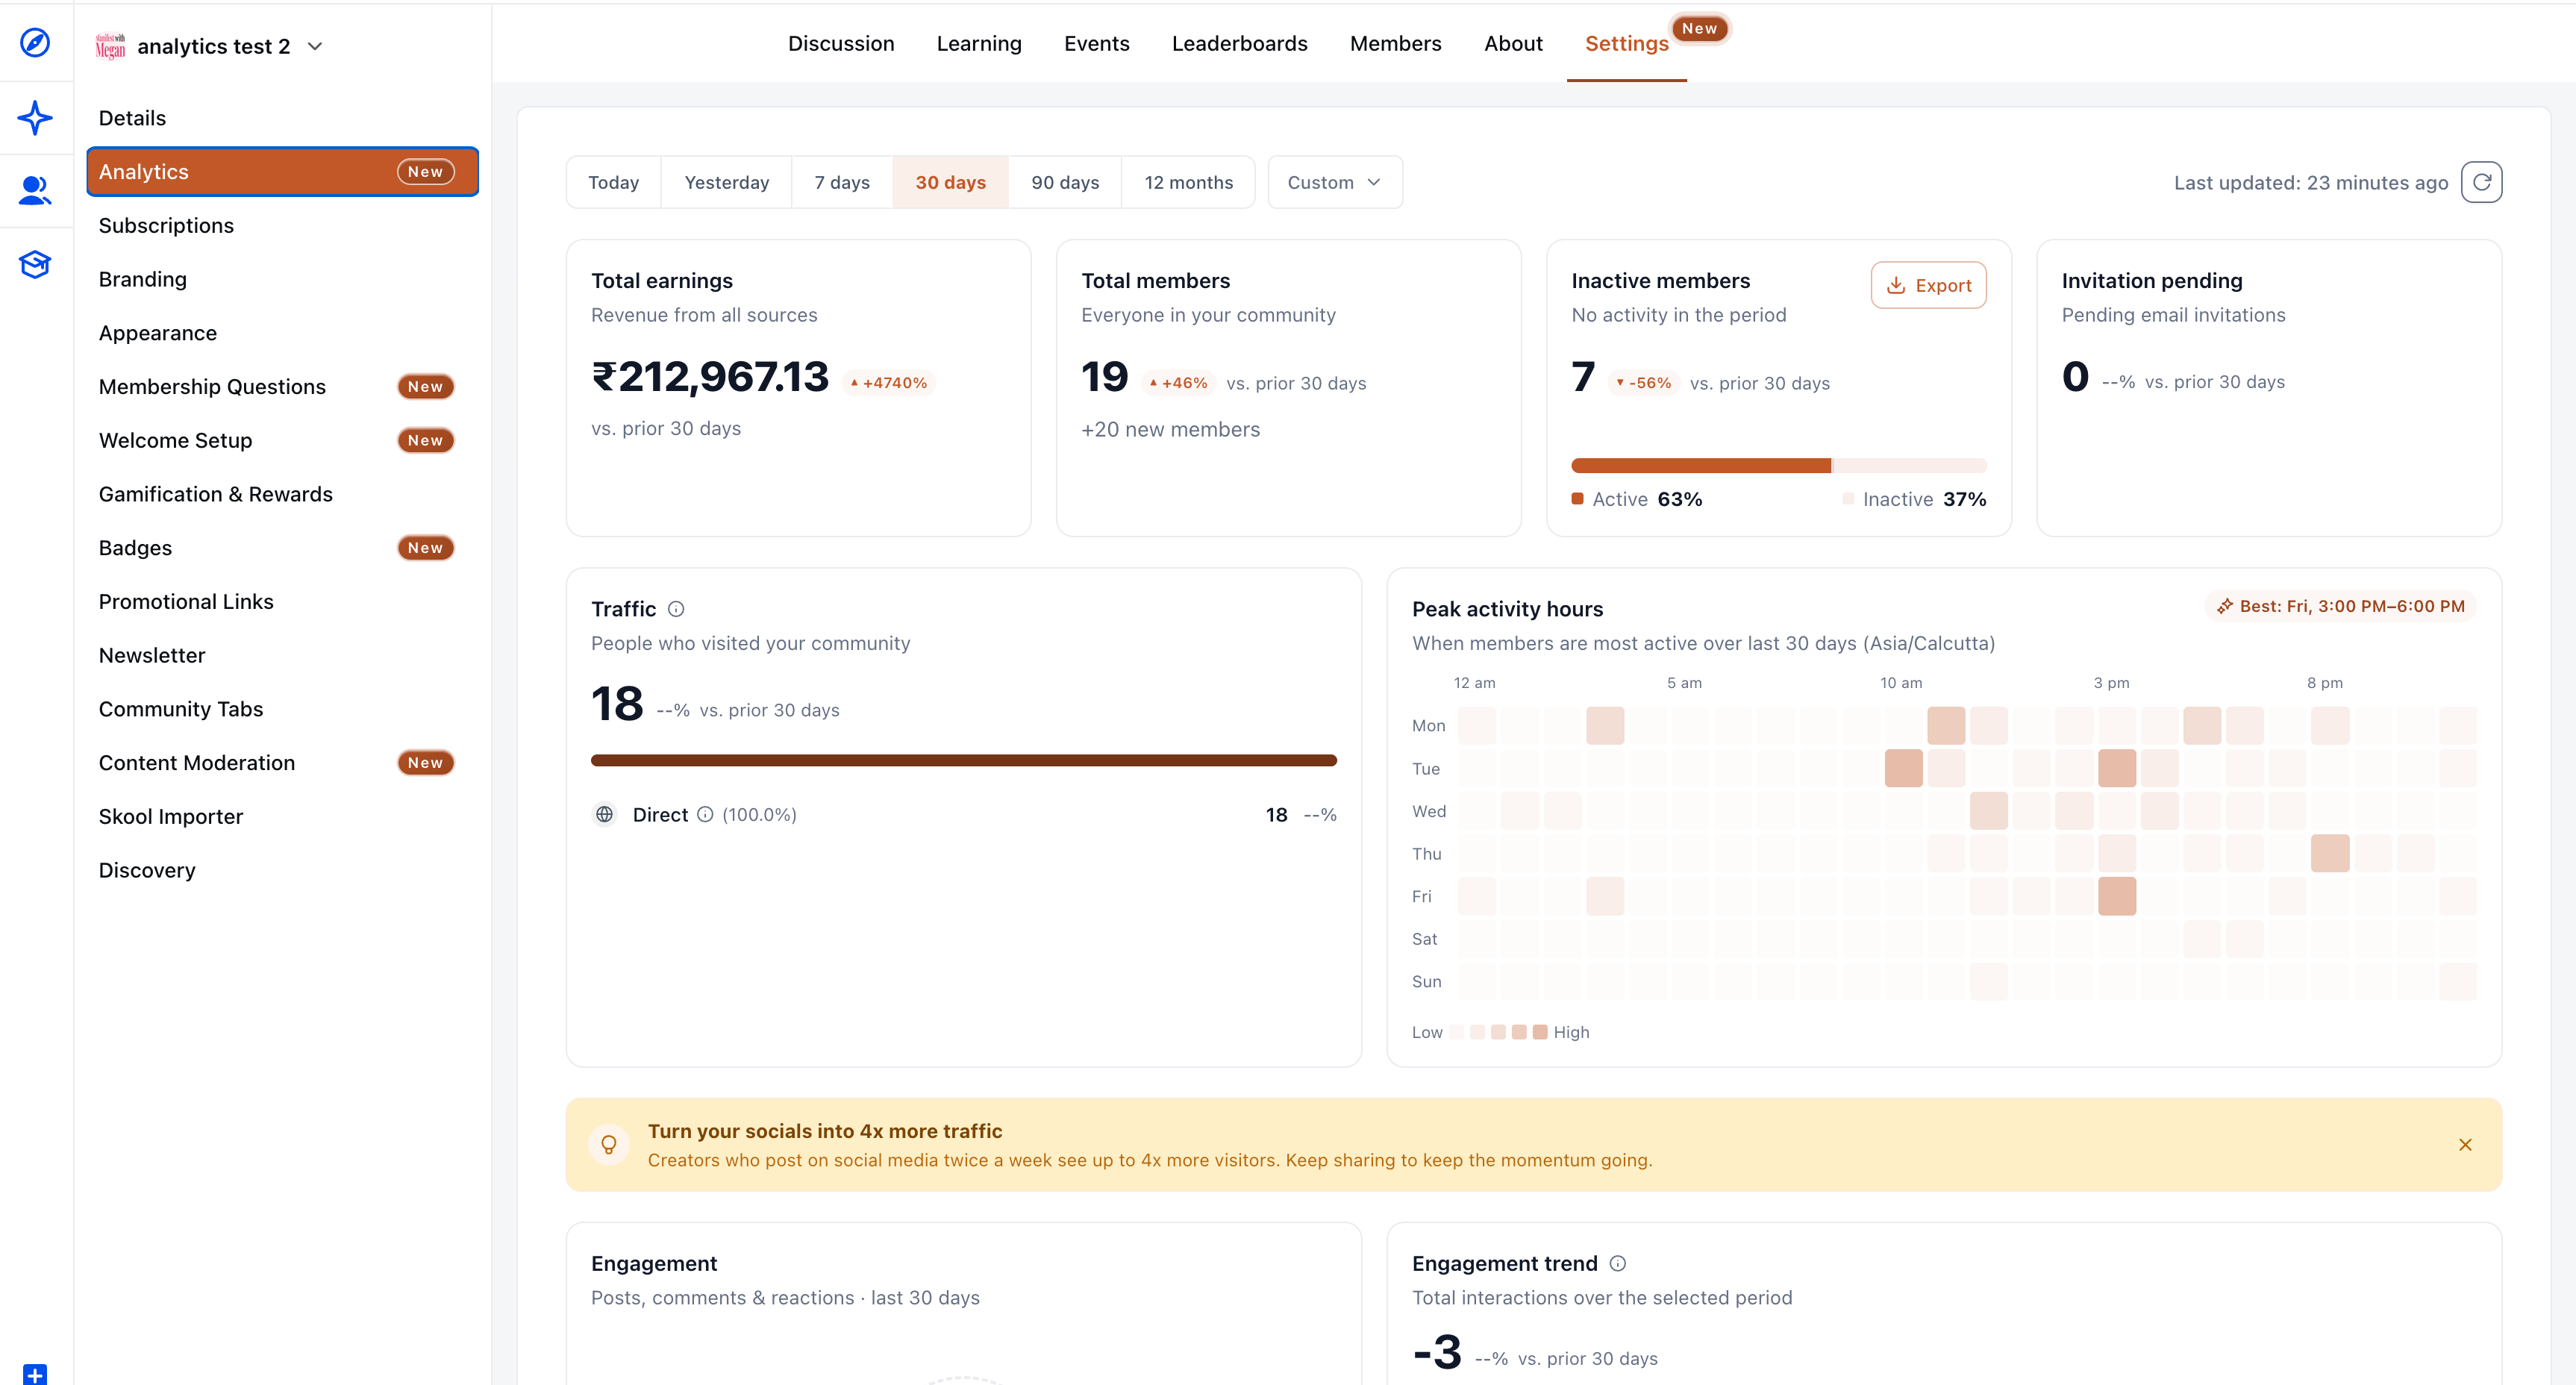
A dedicated analytics section is now available under Settings > Analytics. Everything you need to understand community performance in one place:
What changed
Key Performance Metrics
Four headline cards give you an instant snapshot of community health:
- Total Earnings: Net community attributed transaction revenue (purchases minus refunds/chargebacks), shown in the subaccount’s currency.
- Total Members: Current active membership count, with new joins in the selected period shown separately.
- Inactive Members: Active members with no tracked activity in the selected period. Active vs Inactive breakdown is shown as a percentage bar. Includes an Export button to download inactive members as CSV for follow up.
- Invitation Pending: Email invites still outstanding (not cleared) as of the end of the selected range.
All metrics support % change comparison vs the previous equal length period. When the prior period is 0, the UI shows N/A.
Flexible Date Filters
Filter the entire dashboard by date range: Today, Yesterday, 7 days, 30 days, 90 days, 12 months, or Custom. Default view is last 30 days. All cards update to the same selected range.
Traffic Sources
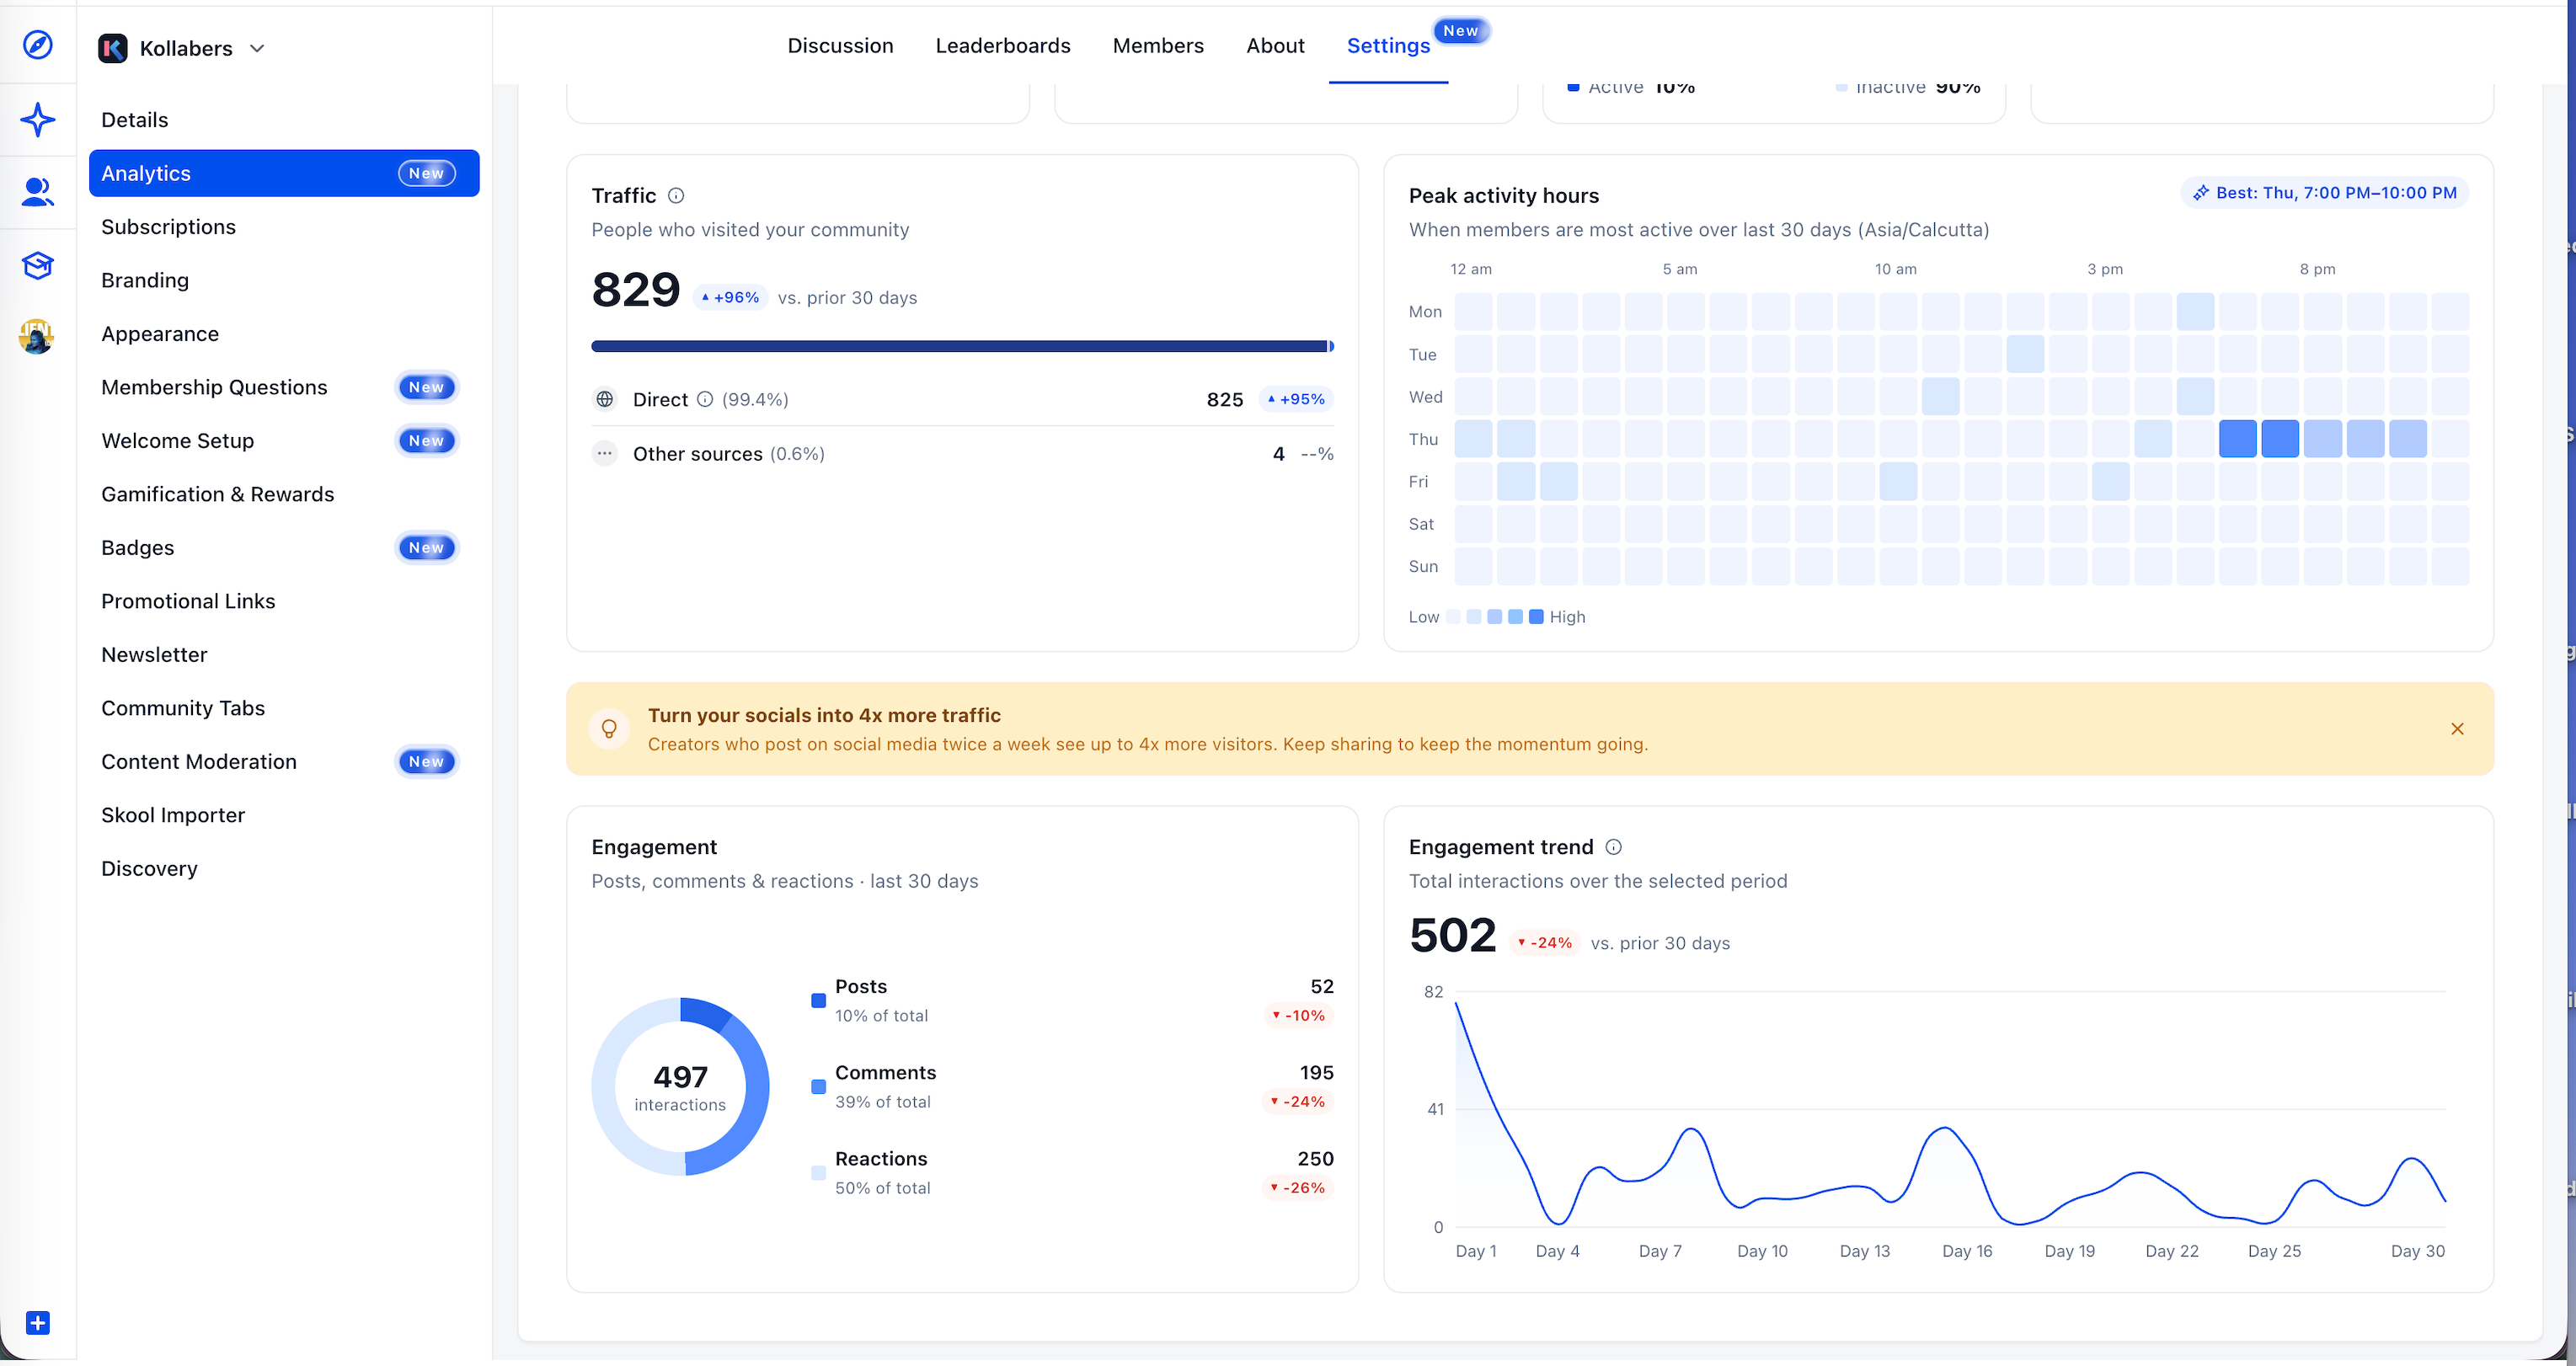
See how members are finding your community. Traffic is broken down by source, Direct, Instagram, YouTube, Facebook, LinkedIn, and Other. Up to 4 named sources are shown by volume; the rest roll into Other. Each row shows its own period delta.
Peak Activity Hours
A day by hour heatmap shows when members are most active, displayed in the community’s timezone. Darker blocks indicate higher activity, and the busiest time slot is highlighted (e.g., “Best: Thu, 7:00 PM to 10:00 PM”). Use this to time your posts, events, and live sessions for maximum engagement.
Engagement
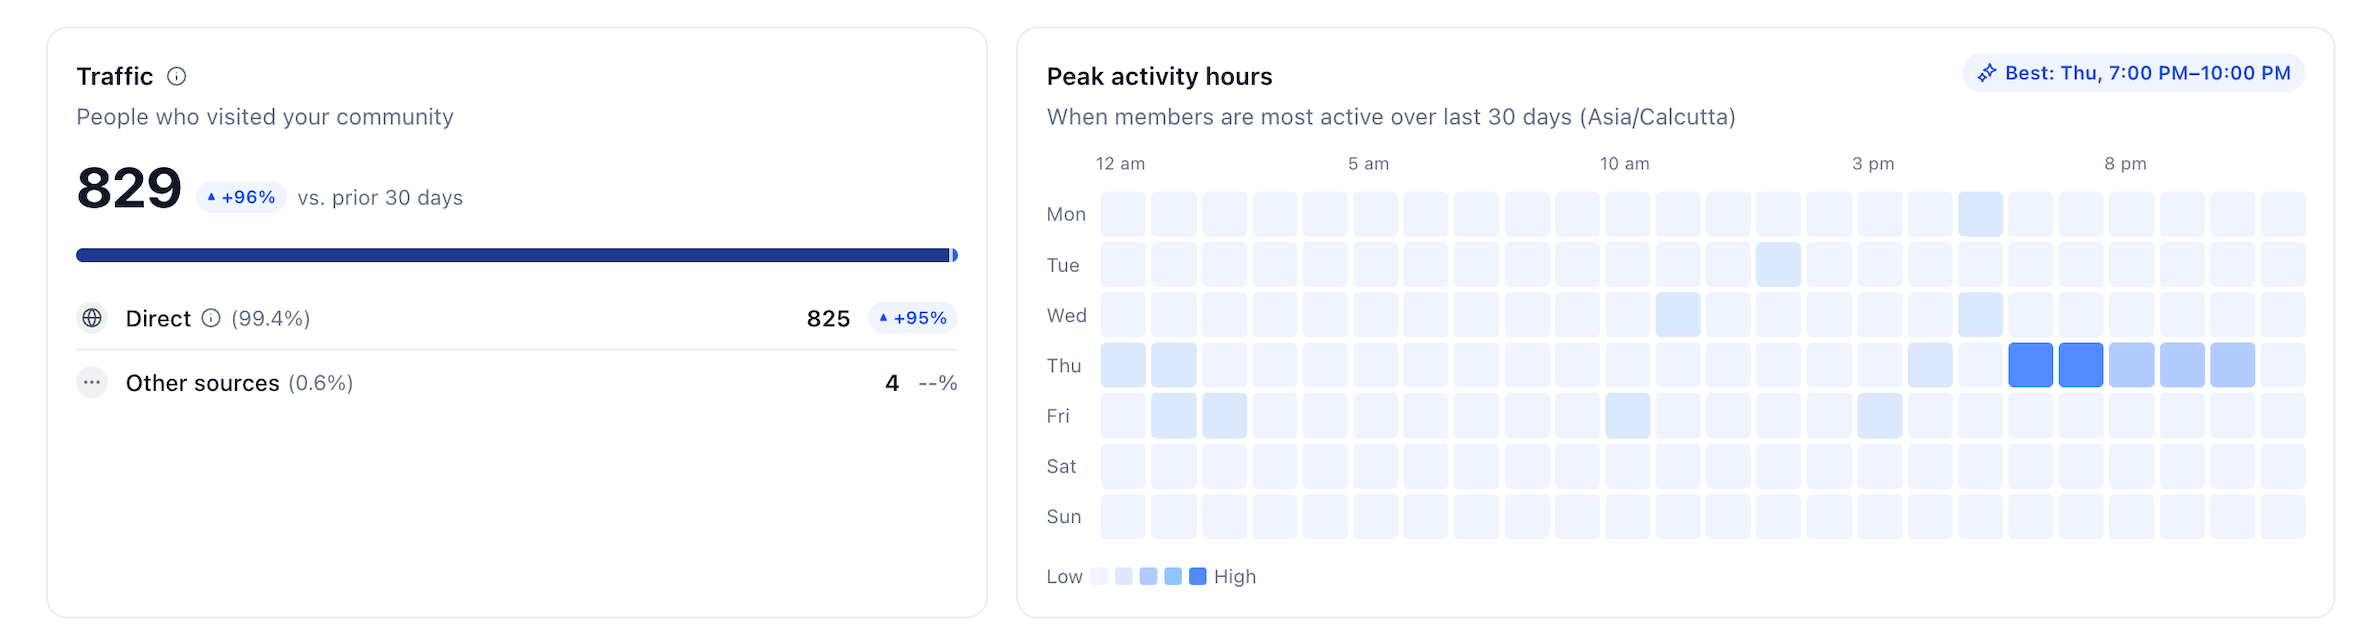
Track community interactions with a breakdown of Posts, Comments, and Reactions, shown as a donut chart with counts and percentage of total. Engagement also includes poll votes and event RSVPs.
An Engagement Trend line chart sits alongside, showing total interactions over the selected period with a % change comparison vs the prior period.
How to turn it on
- Navigate to Settings in your community.
- Click Analytics in the left sidebar.
- Select a date range using the filter bar at the top.
- Review your metrics, traffic, peak hours, and engagement at a glance.
- Use the Export button on the Inactive Members card to download a CSV for outreach.
Why it matters for Founders
Until now, understanding community performance meant piecing together scattered data across different tools. There was no centralized place to see revenue, membership trends, traffic sources, and engagement side by side.
Community Analytics replaces that with one trusted dashboard, helping admins catch disengagement early, identify which traffic sources drive growth, plan content around real peak hours, and export inactive member lists for follow up.
Notes and availability
- Traffic page view capture is implemented and rolling out. Counts fill in as visits are recorded going forward, historical traffic is not backfilled.
- Unique visitors are counted by user ID, falling back to a hashed IP fingerprint. Bots and crawlers are excluded.
- Time buckets use the community’s timezone from the UI.
- Dashboard supports the subaccount’s local currency for earnings.
- Coming next: Community Analytics V2 is in planning. Based on user feedback from this initial release, V2 will bring a much more comprehensive analytics experience with deeper insights and new capabilities.
Questions Founders ask
What did HighLevel release in "Community analytics dashboard in Communities"?
No more guessing how your community is doing. The new Analytics dashboard gives admins and owners a single view of revenue, membership, traffic, and engagement, with flexible date filters and data exports.
What should a Founder do with Community analytics dashboard in Communities?
Open Settings > Analytics this week, select the last 30 days and compare the earnings and member numbers to your existing reports. Community admins who want a quick, reliable view of how their members and revenue are doing.
How do I turn on Community analytics dashboard in Communities in HighLevel?
In HighLevel: Navigate to Settings in your community. Then Click Analytics in the left sidebar. Then Select a date range using the filter bar at the top. Then Review your metrics, traffic, peak hours, and engagement at a glance. Then Use the Export button on the Inactive Members card to download a CSV for outreach.
Why does Community analytics dashboard in Communities matter?
Until now, understanding community performance meant piecing together scattered data across different tools. There was no centralized place to see revenue, membership trends, traffic sources, and engagement side by side. Community Analytics replaces that with one trusted dashboard, helping admins catch disengagement early, identify which traffic sources drive growth, plan content around real peak hours, and export in
How do I get this feature with setup help?
Start a free HighLevel trial through Michael Reimer's link and the CRM Pros team helps with setup in your first 7 days, with an onboarding call, three live calls every week and the affiliate community included.
Get More InformationOpens in a new tab Published November 2, 2026. Screenshots belong to HighLevel.