
01Dashboard widgets, explained
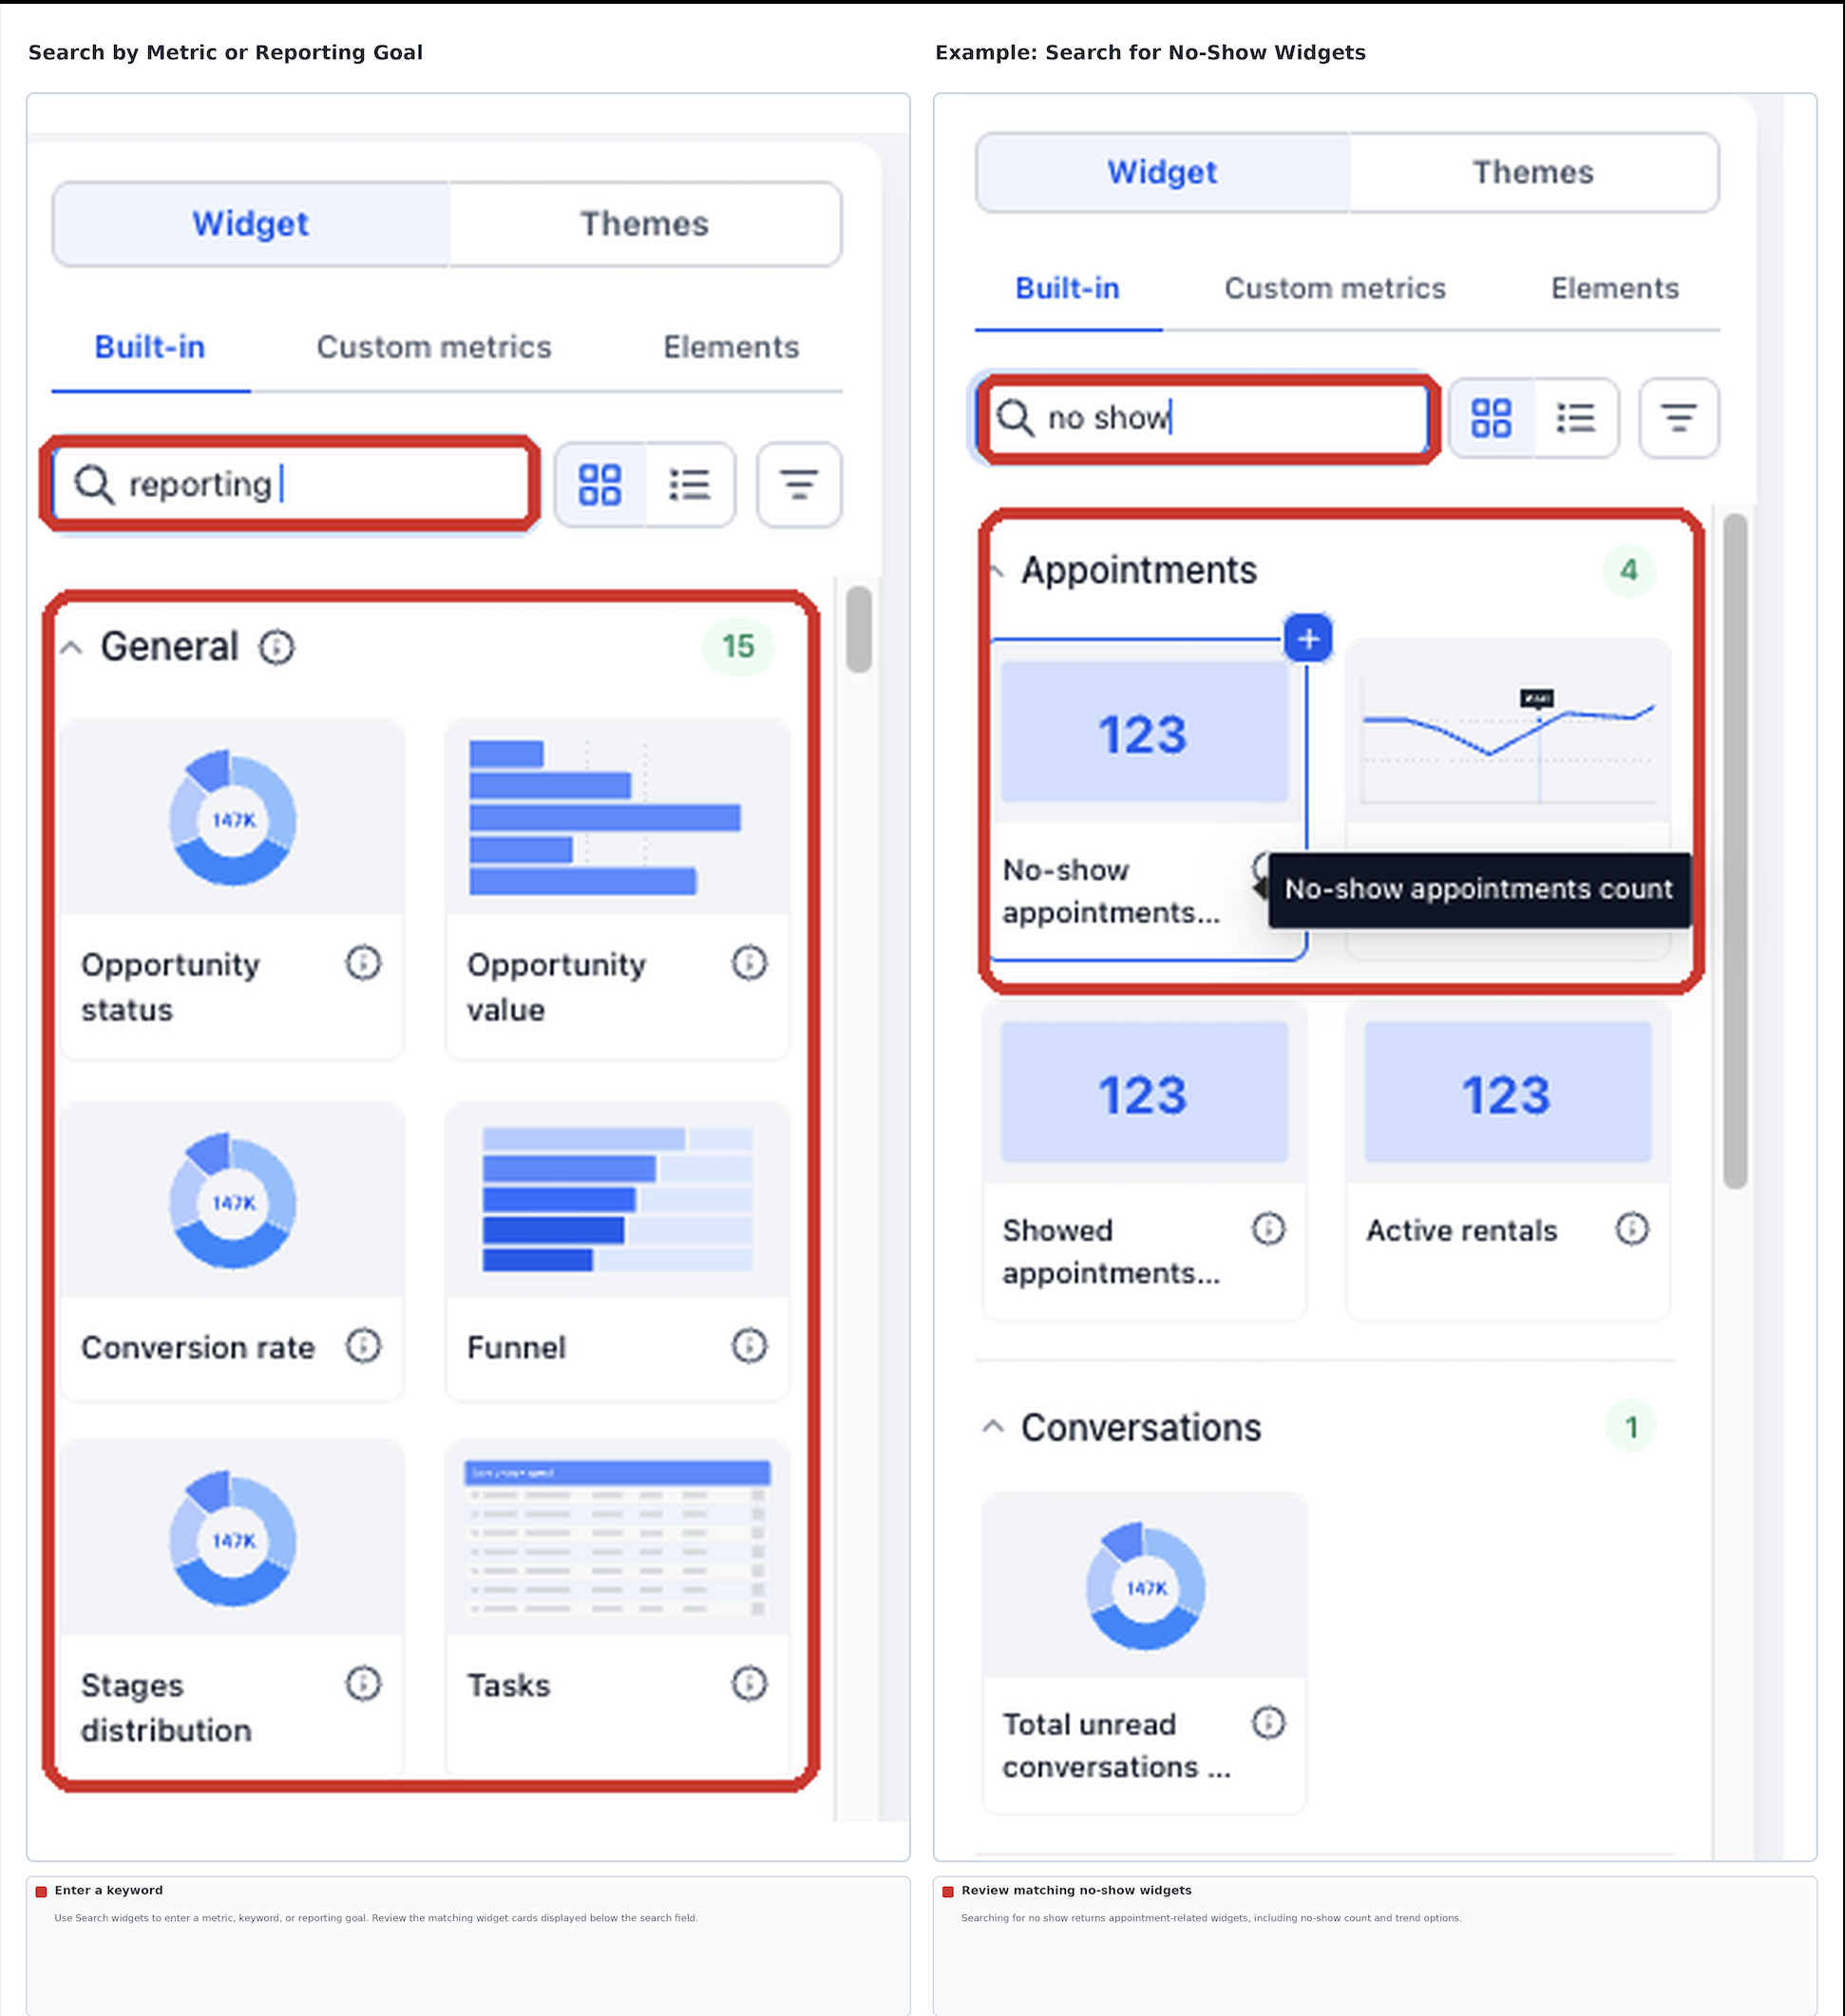
Dashboard widgets are built in reporting cards that display numbers, charts or other visualizations of your data. Each widget measures a specific metric such as contacts count, opened opportunities or appointment no shows.
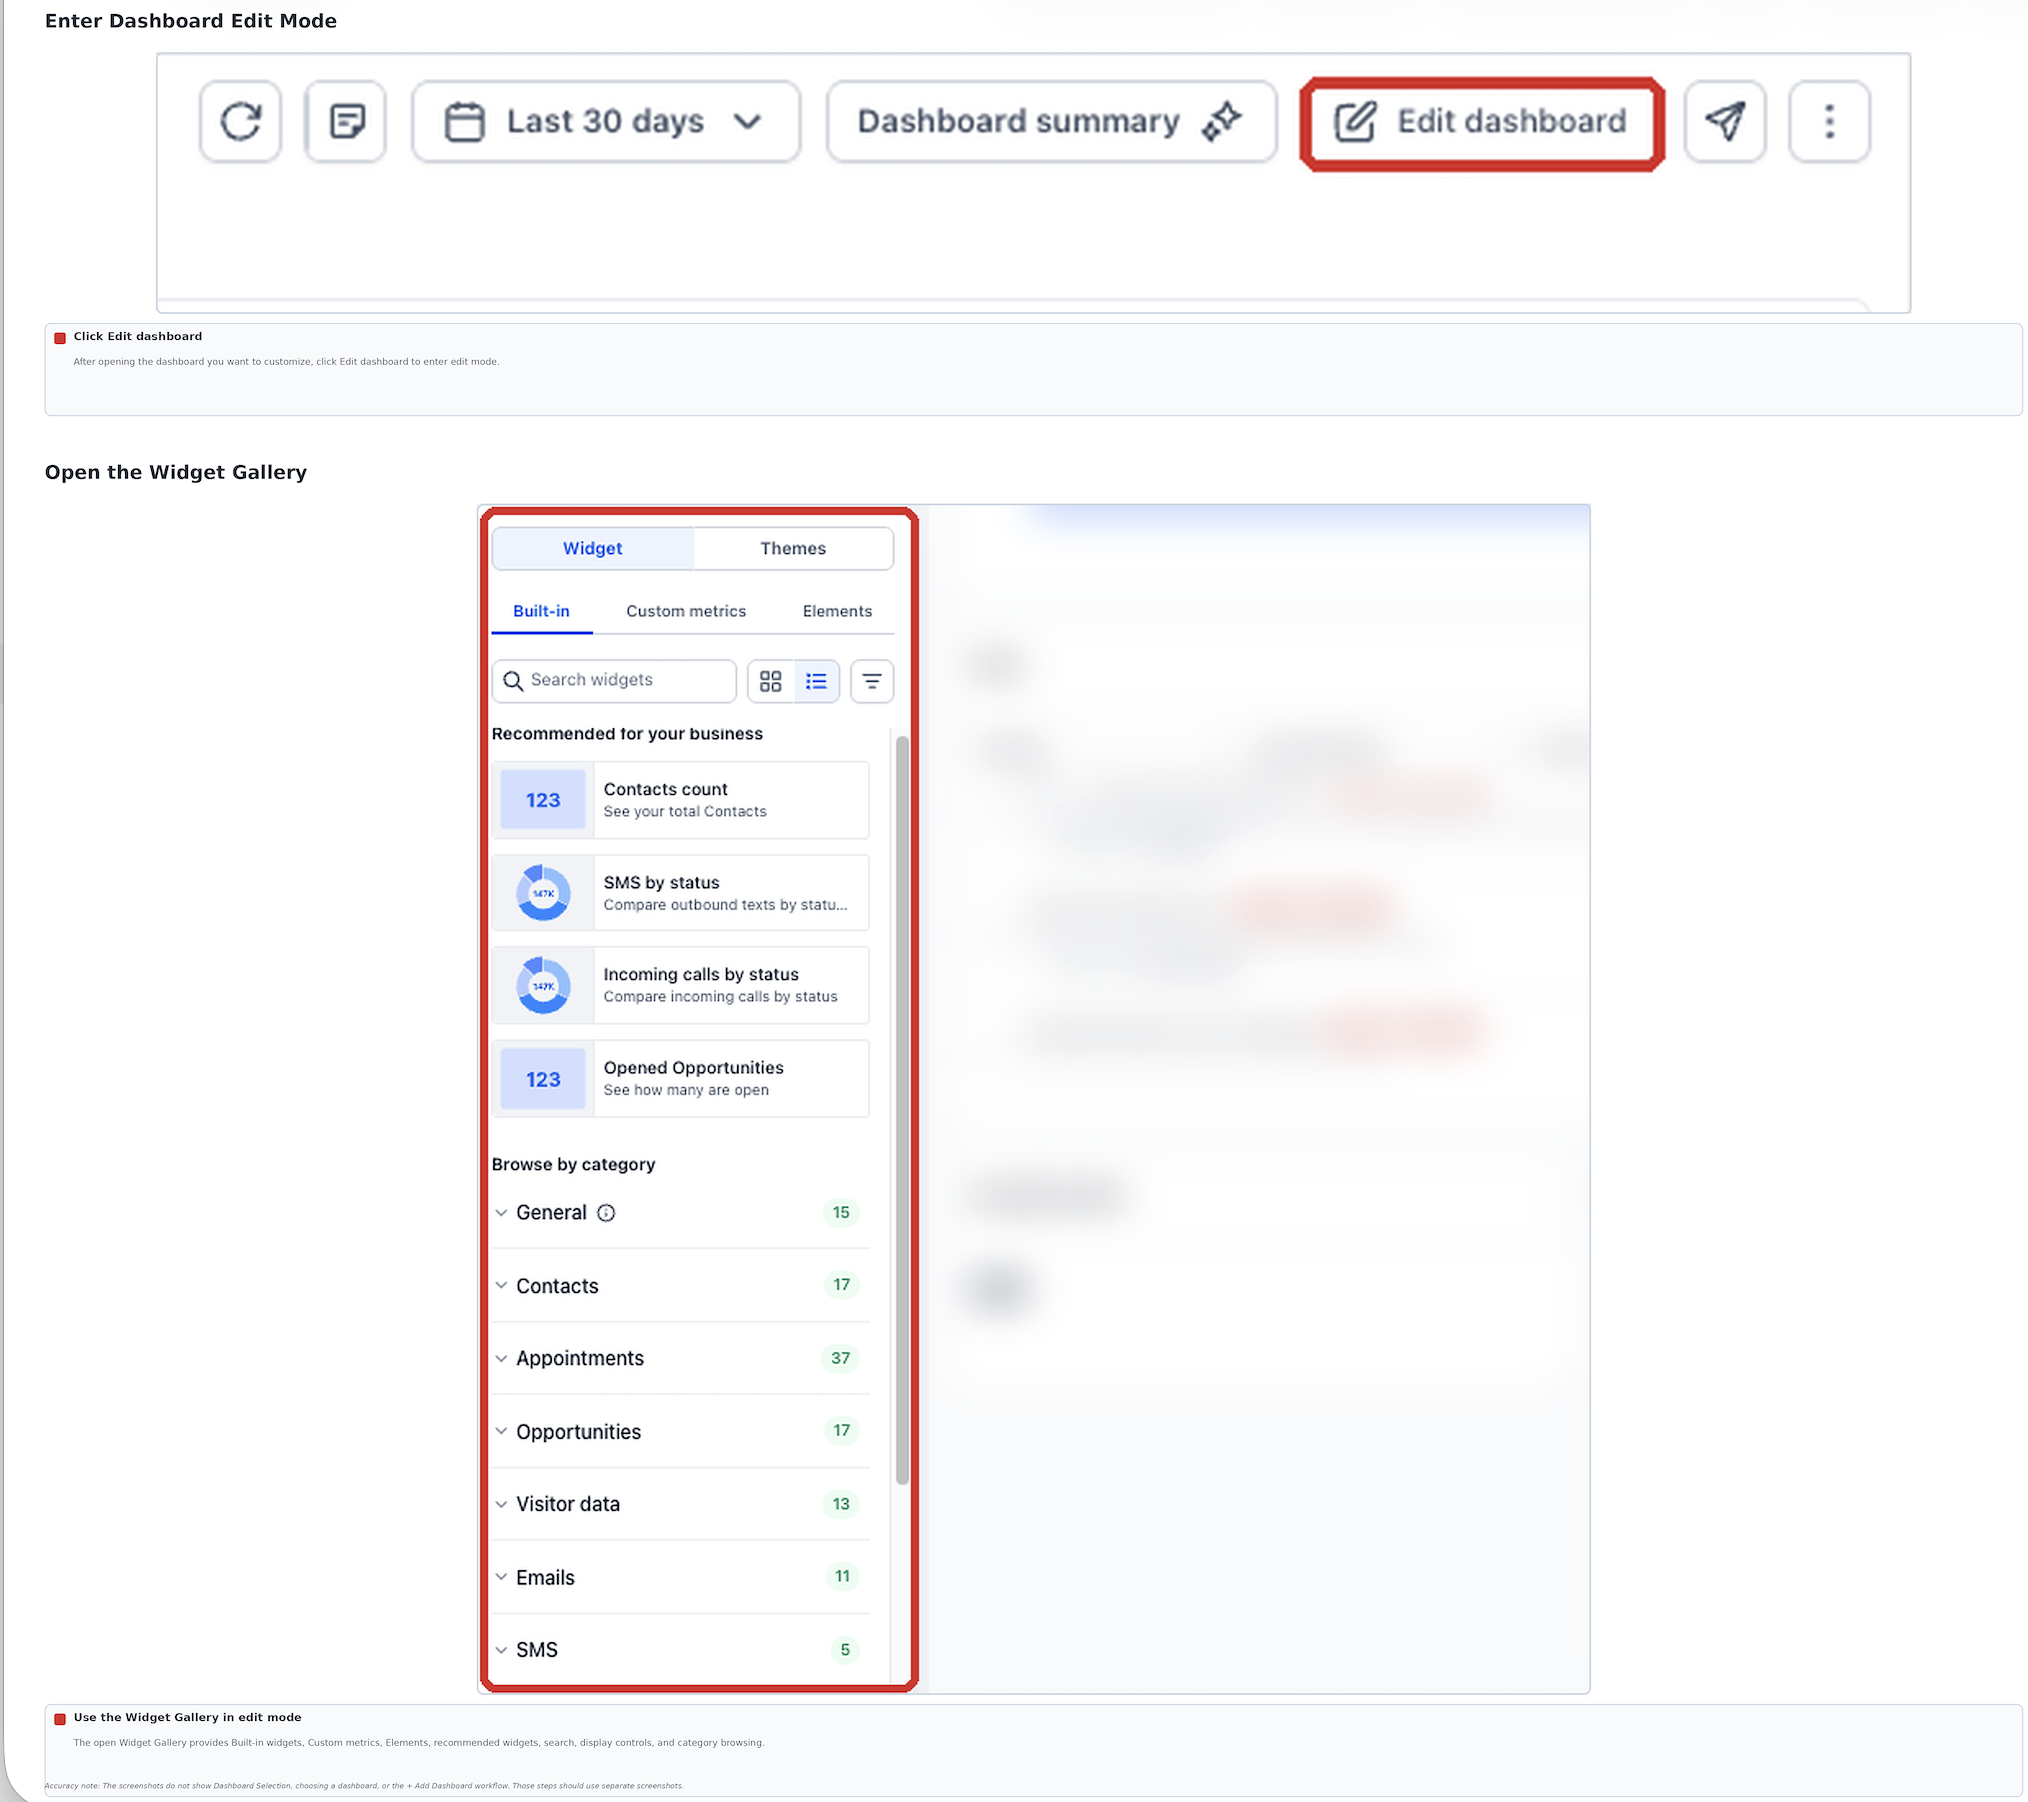
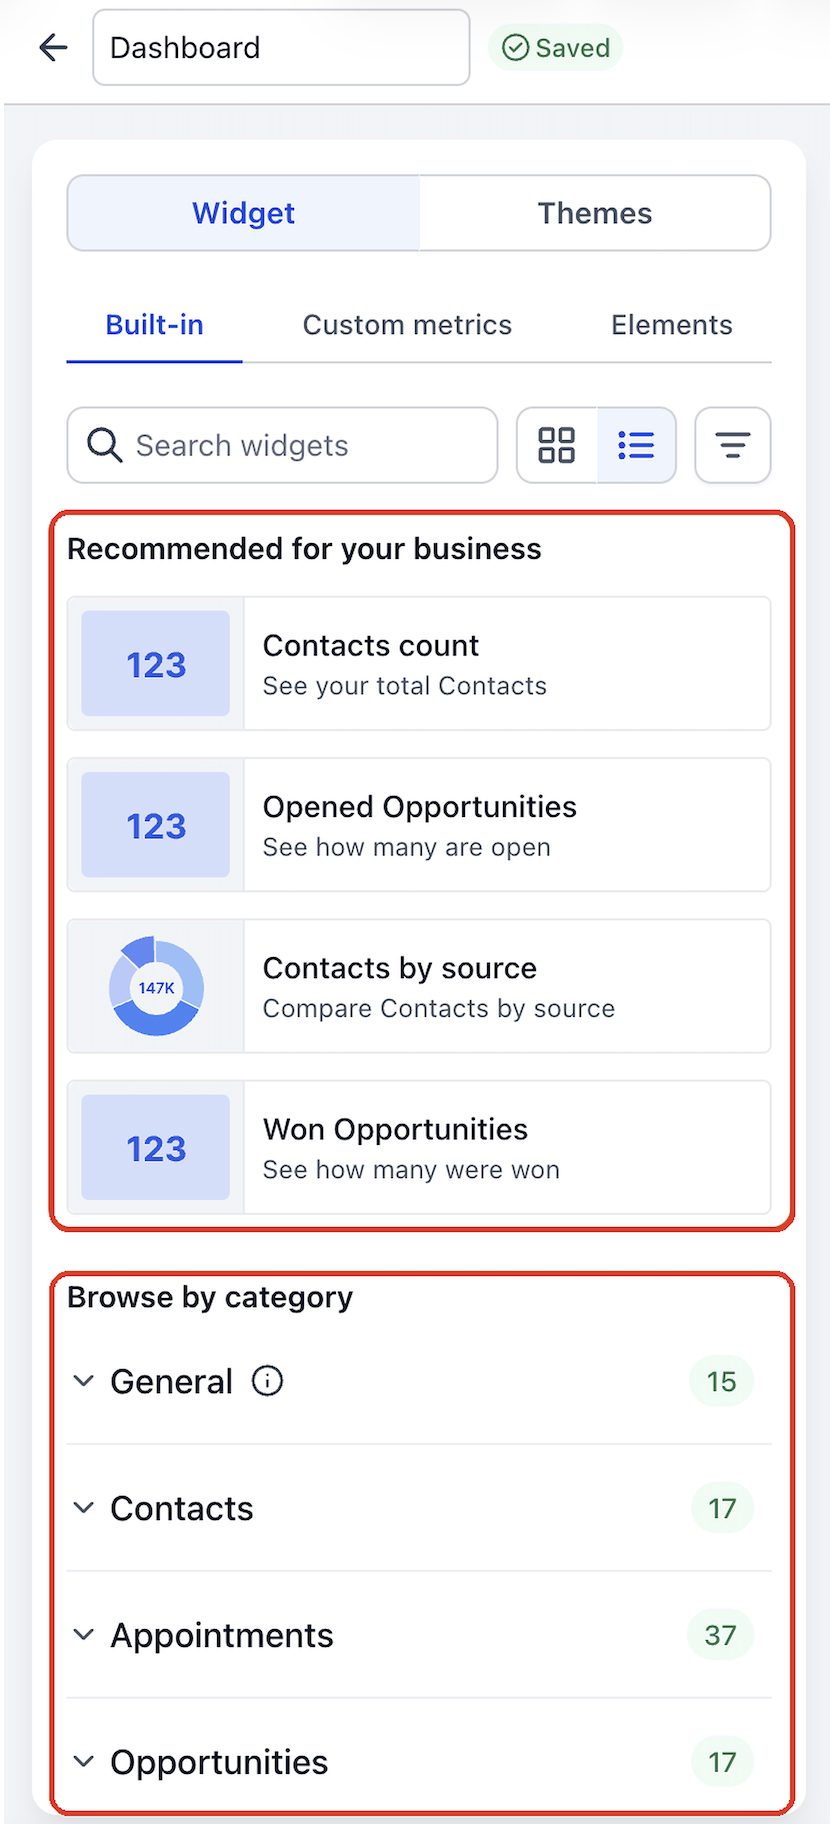
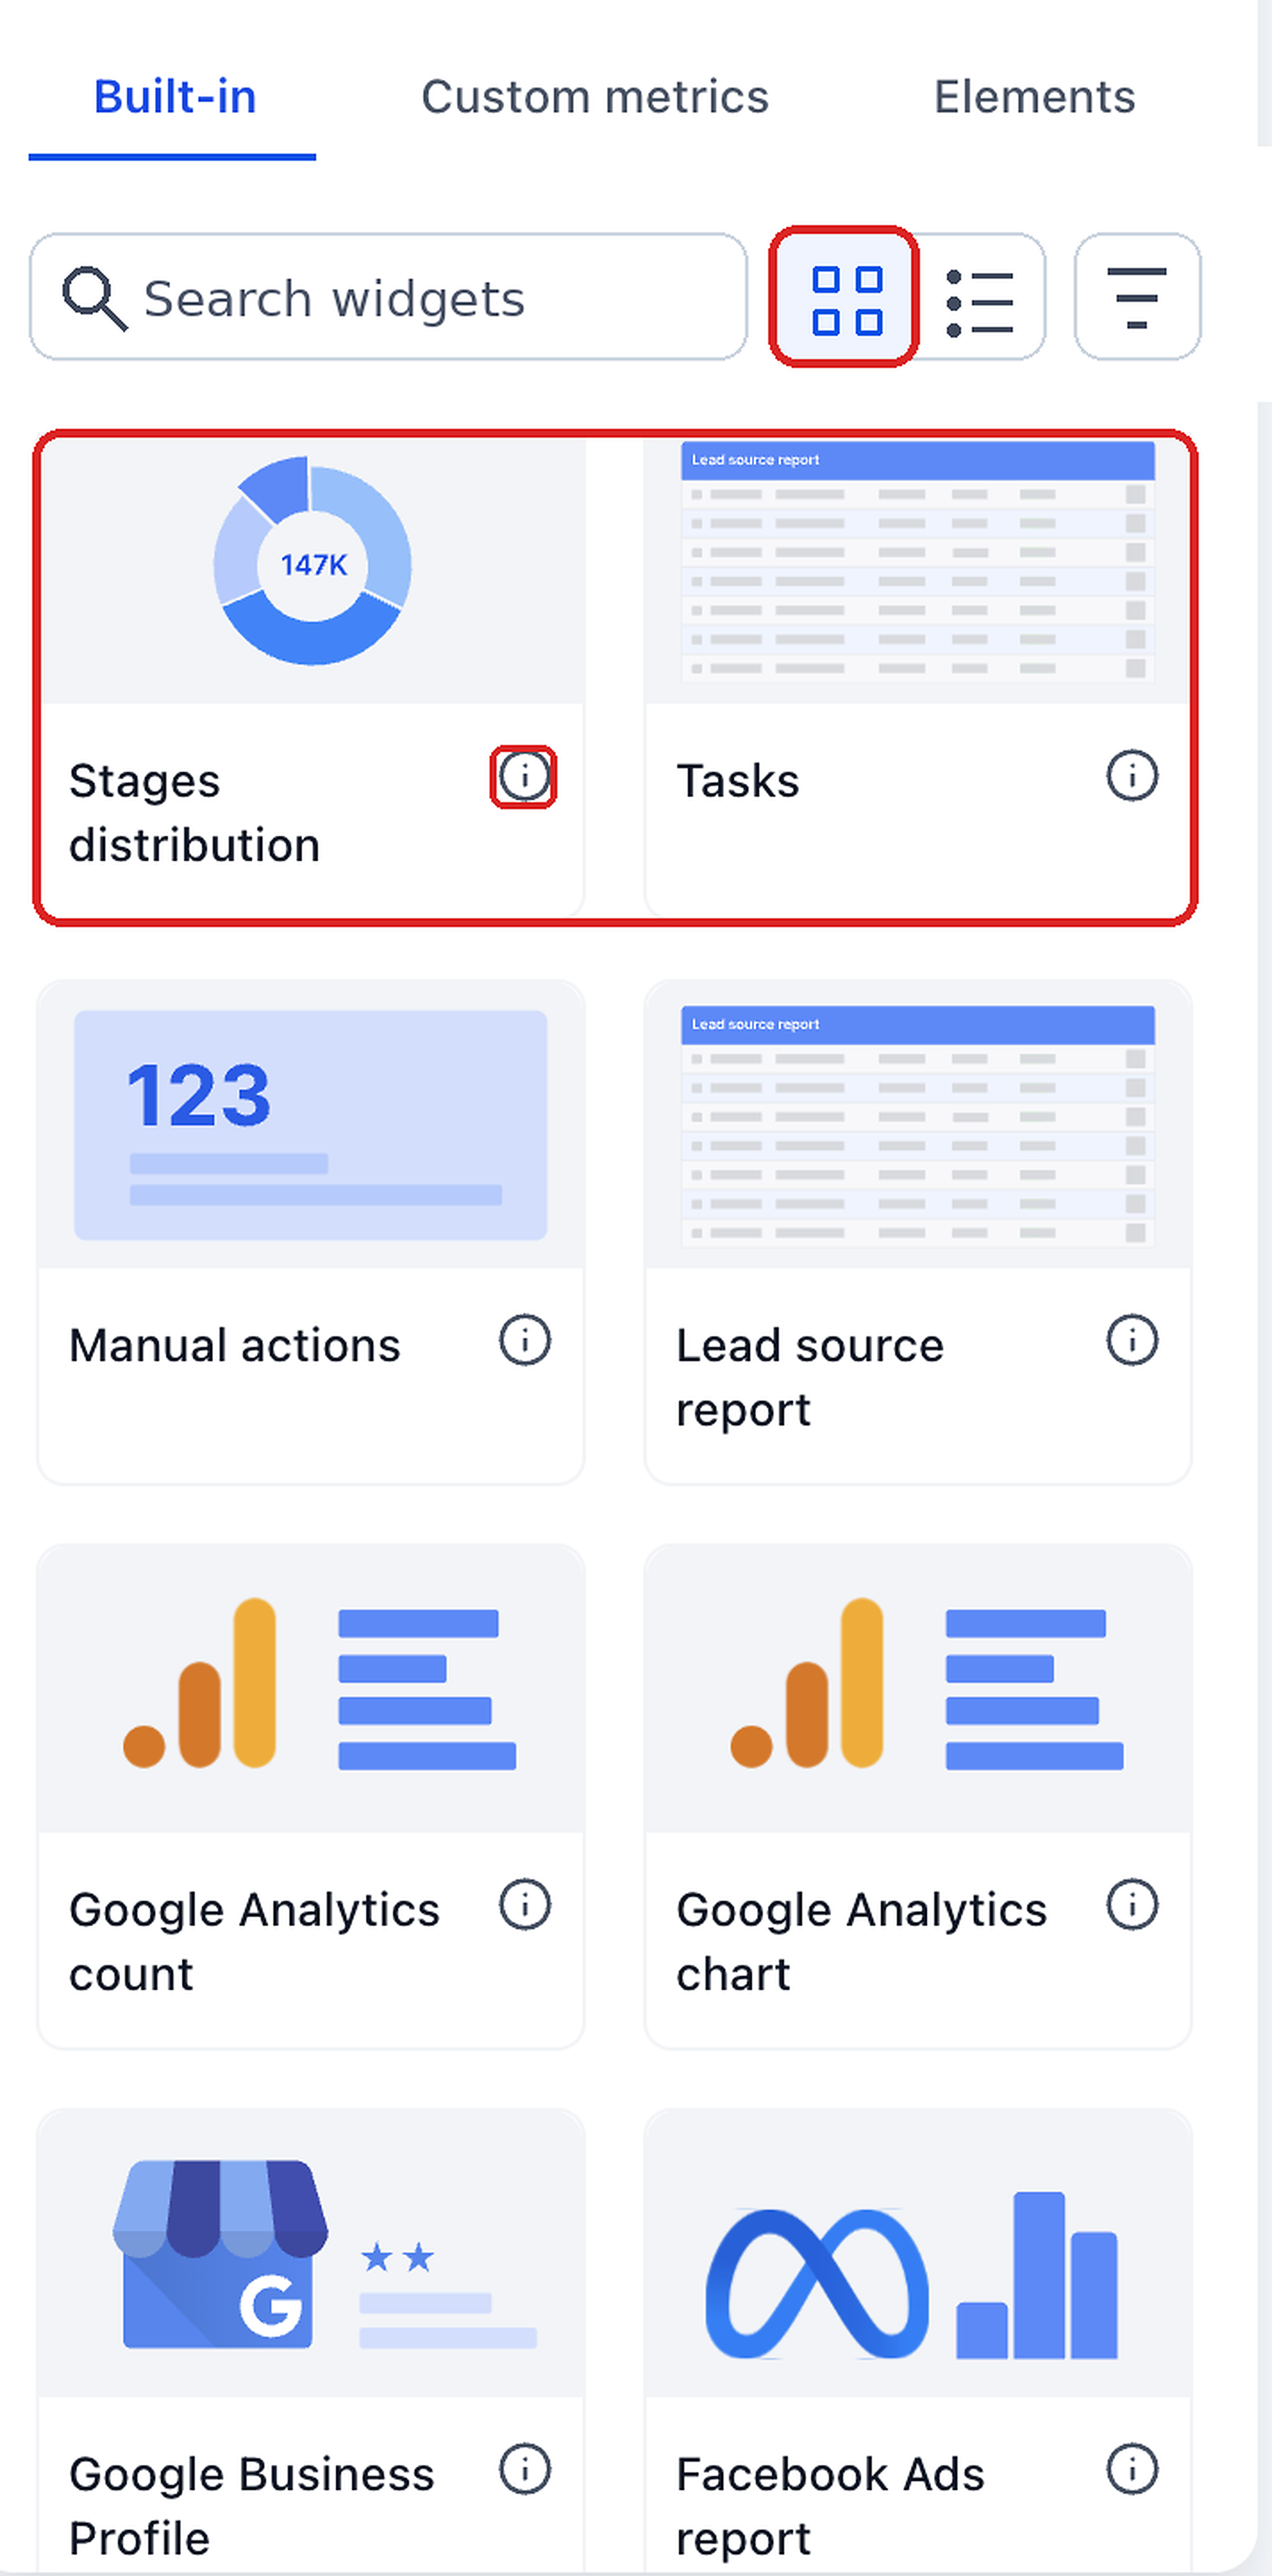
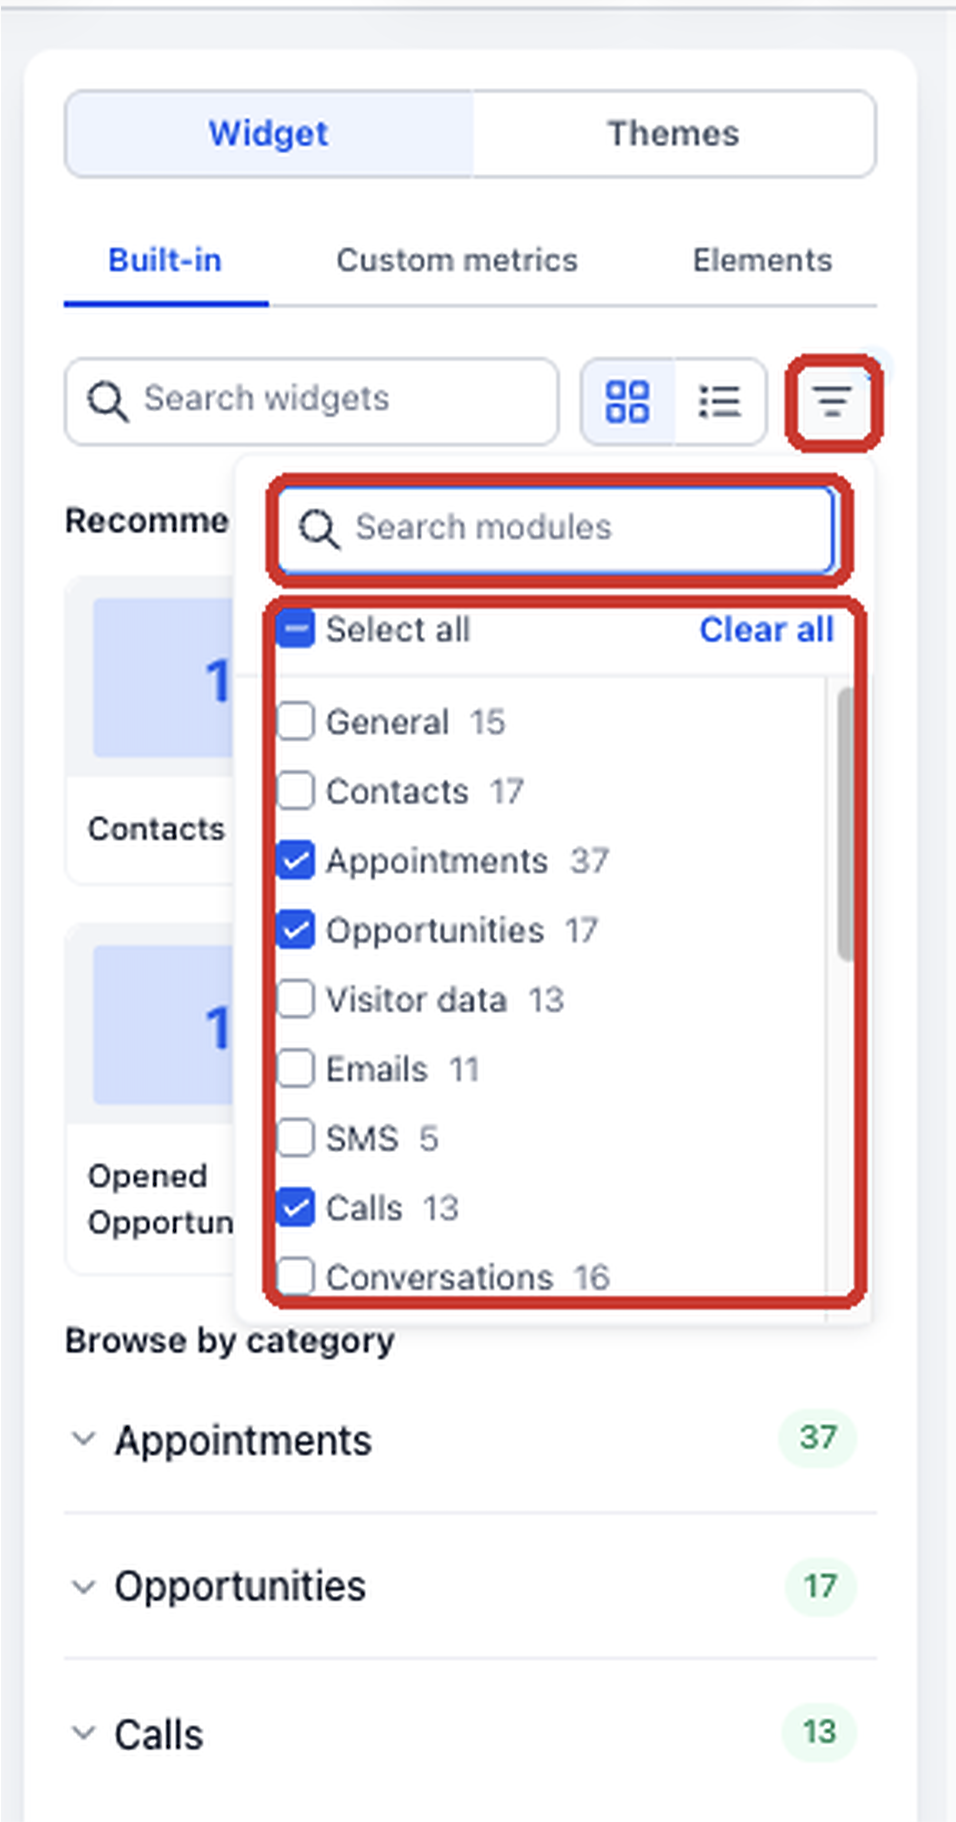
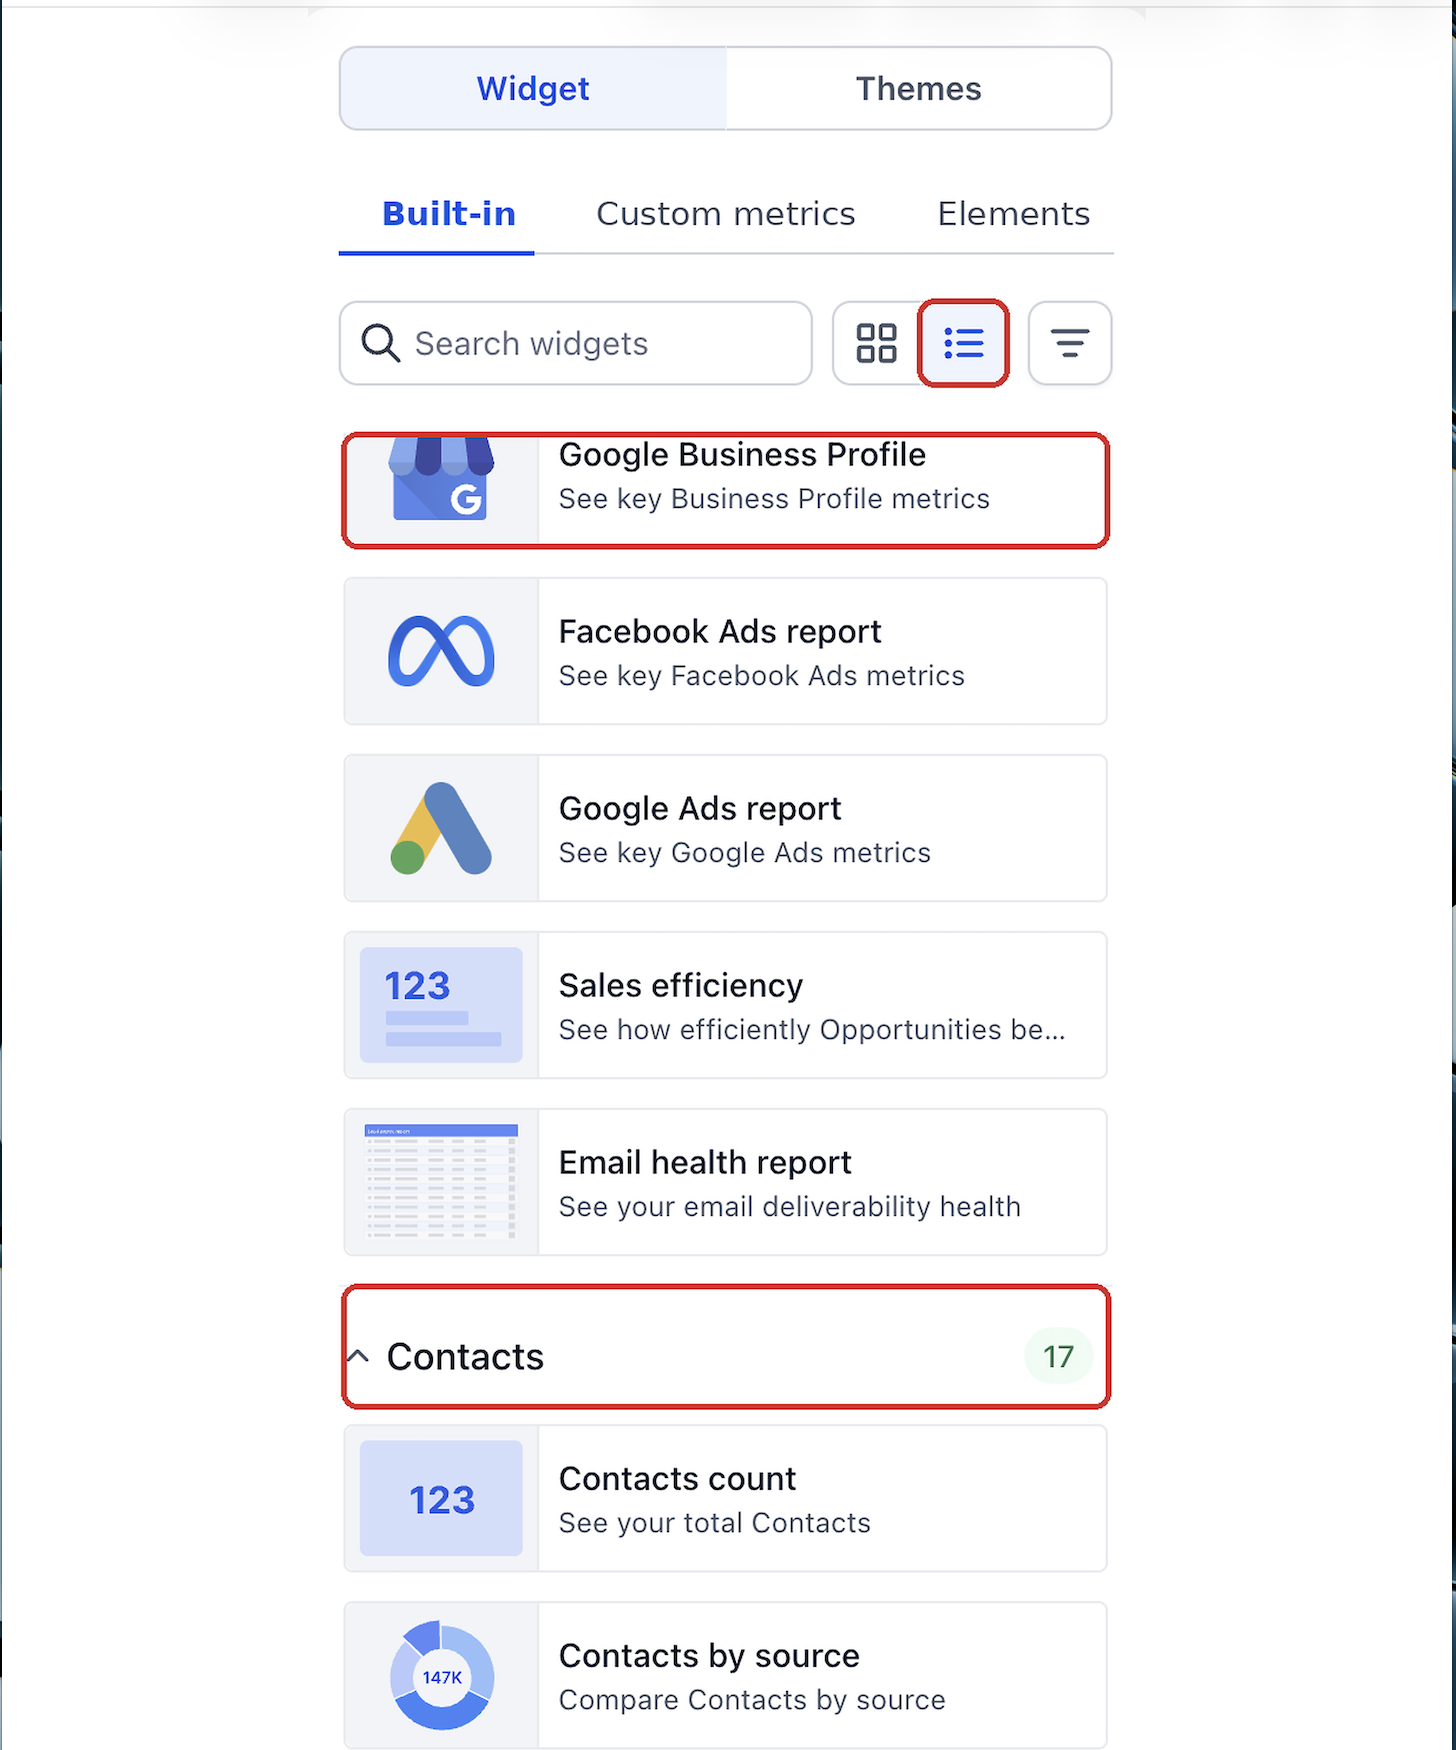
The Widget Gallery shows every available widget as a visual card or a compact list, with a preview of its chart style and a short description. You can search by purpose, filter by reporting module, or browse recommended widgets before adding them to a dashboard or a custom report.
02How businesses use dashboard widgets
- Monitor key performance indicators. Add widgets that show totals, trends or breakdowns. Arrange them on a dashboard so you can glance at sales, marketing or appointment metrics without opening separate reports.
- Customize reporting layouts. Select a widget, adjust its title, date range and chart settings, then drag and resize it. The result is a tailored view that matches the way your team reviews data.
- Enhance custom reports. When building a custom report, open the Widget Gallery, find the needed widget and insert it. The same search, filter and preview tools work for reports as they do for dashboards.
03The numbers and rules that matter
- Supported reporting modules: General, Contacts, Appointments, Opportunities, Visitor Data, Emails, SMS, Calls, Conversations, Payments, Meta Ads, Google Ads, Social Planner, Reputation, Google Analytics.
04Before you start
- Access to a HighLevel SubAccount.
- Edit or Full permission on the target dashboard.
05How to set up and use dashboard widgets in HighLevel
Add dashboard widgets
- Open your HighLevel SubAccount and select Dashboard from the left navigation menu.
- Open the Dashboard Selection menu and choose the dashboard you want to customize.
- Click Edit Dashboard to enter Edit mode.
- Open the Widget Gallery from the dashboard editor.
- Browse widgets in Gallery or List view, or use Search and module filters to find the desired metric.
- Hover over the widget card and select the add control to place it on the dashboard canvas.
- Repeat to add additional widgets as needed.
- While still in Edit mode, open each widget’s editing controls and adjust settings such as Title, Metrics, Chart settings, Date range and Conditions.
- Drag, resize and arrange widgets on the canvas.
- Save the dashboard changes.
Use widget gallery in custom reports
- From your HighLevel SubAccount, select Reporting and open Custom Reports.
- Create a new report or open an existing Custom Report.
- Enter the Report Builder and open the Widgets area.
- Browse, search or filter widgets in the Widget Gallery as you would for a dashboard.
- Select the desired widget and add it using the Report Builder controls.
- Configure the widget if needed, then save the report.
06What it looks like in HighLevel
07Settings that matter
- Title. Sets the display name of the widget on the dashboard or report.
- Metrics. Defines which data point the widget measures.
- Chart settings. Controls the visual style such as bar, line, donut or number display.
- Date range. Specifies the time period the widget’s data covers.
- Conditions. Applies filters or rules that limit the data shown in the widget.
08Things to know before you rely on it
- Available configuration options vary by widget.
- Module filters only affect widget discovery, not the data shown by existing dashboard widgets.
Michael's take

The Widget Gallery feels like a small convenience that can become a real shift for anyone who spends time hunting for the right chart.
A fitness studio that tracks class attendance, new sign ups and revenue would love this. The studio can add a contacts count widget, a no show trend chart and a payments total, then arrange them in a single view that the owner checks each morning.