
01Who this is for
- Users of email widgets can see the workflow step that triggered each email, improving traceability.
- Anyone who needs a sortable, tabular view of metric data can add a table chart widget to a dashboard.
02Table charts for dashboard widgets, explained
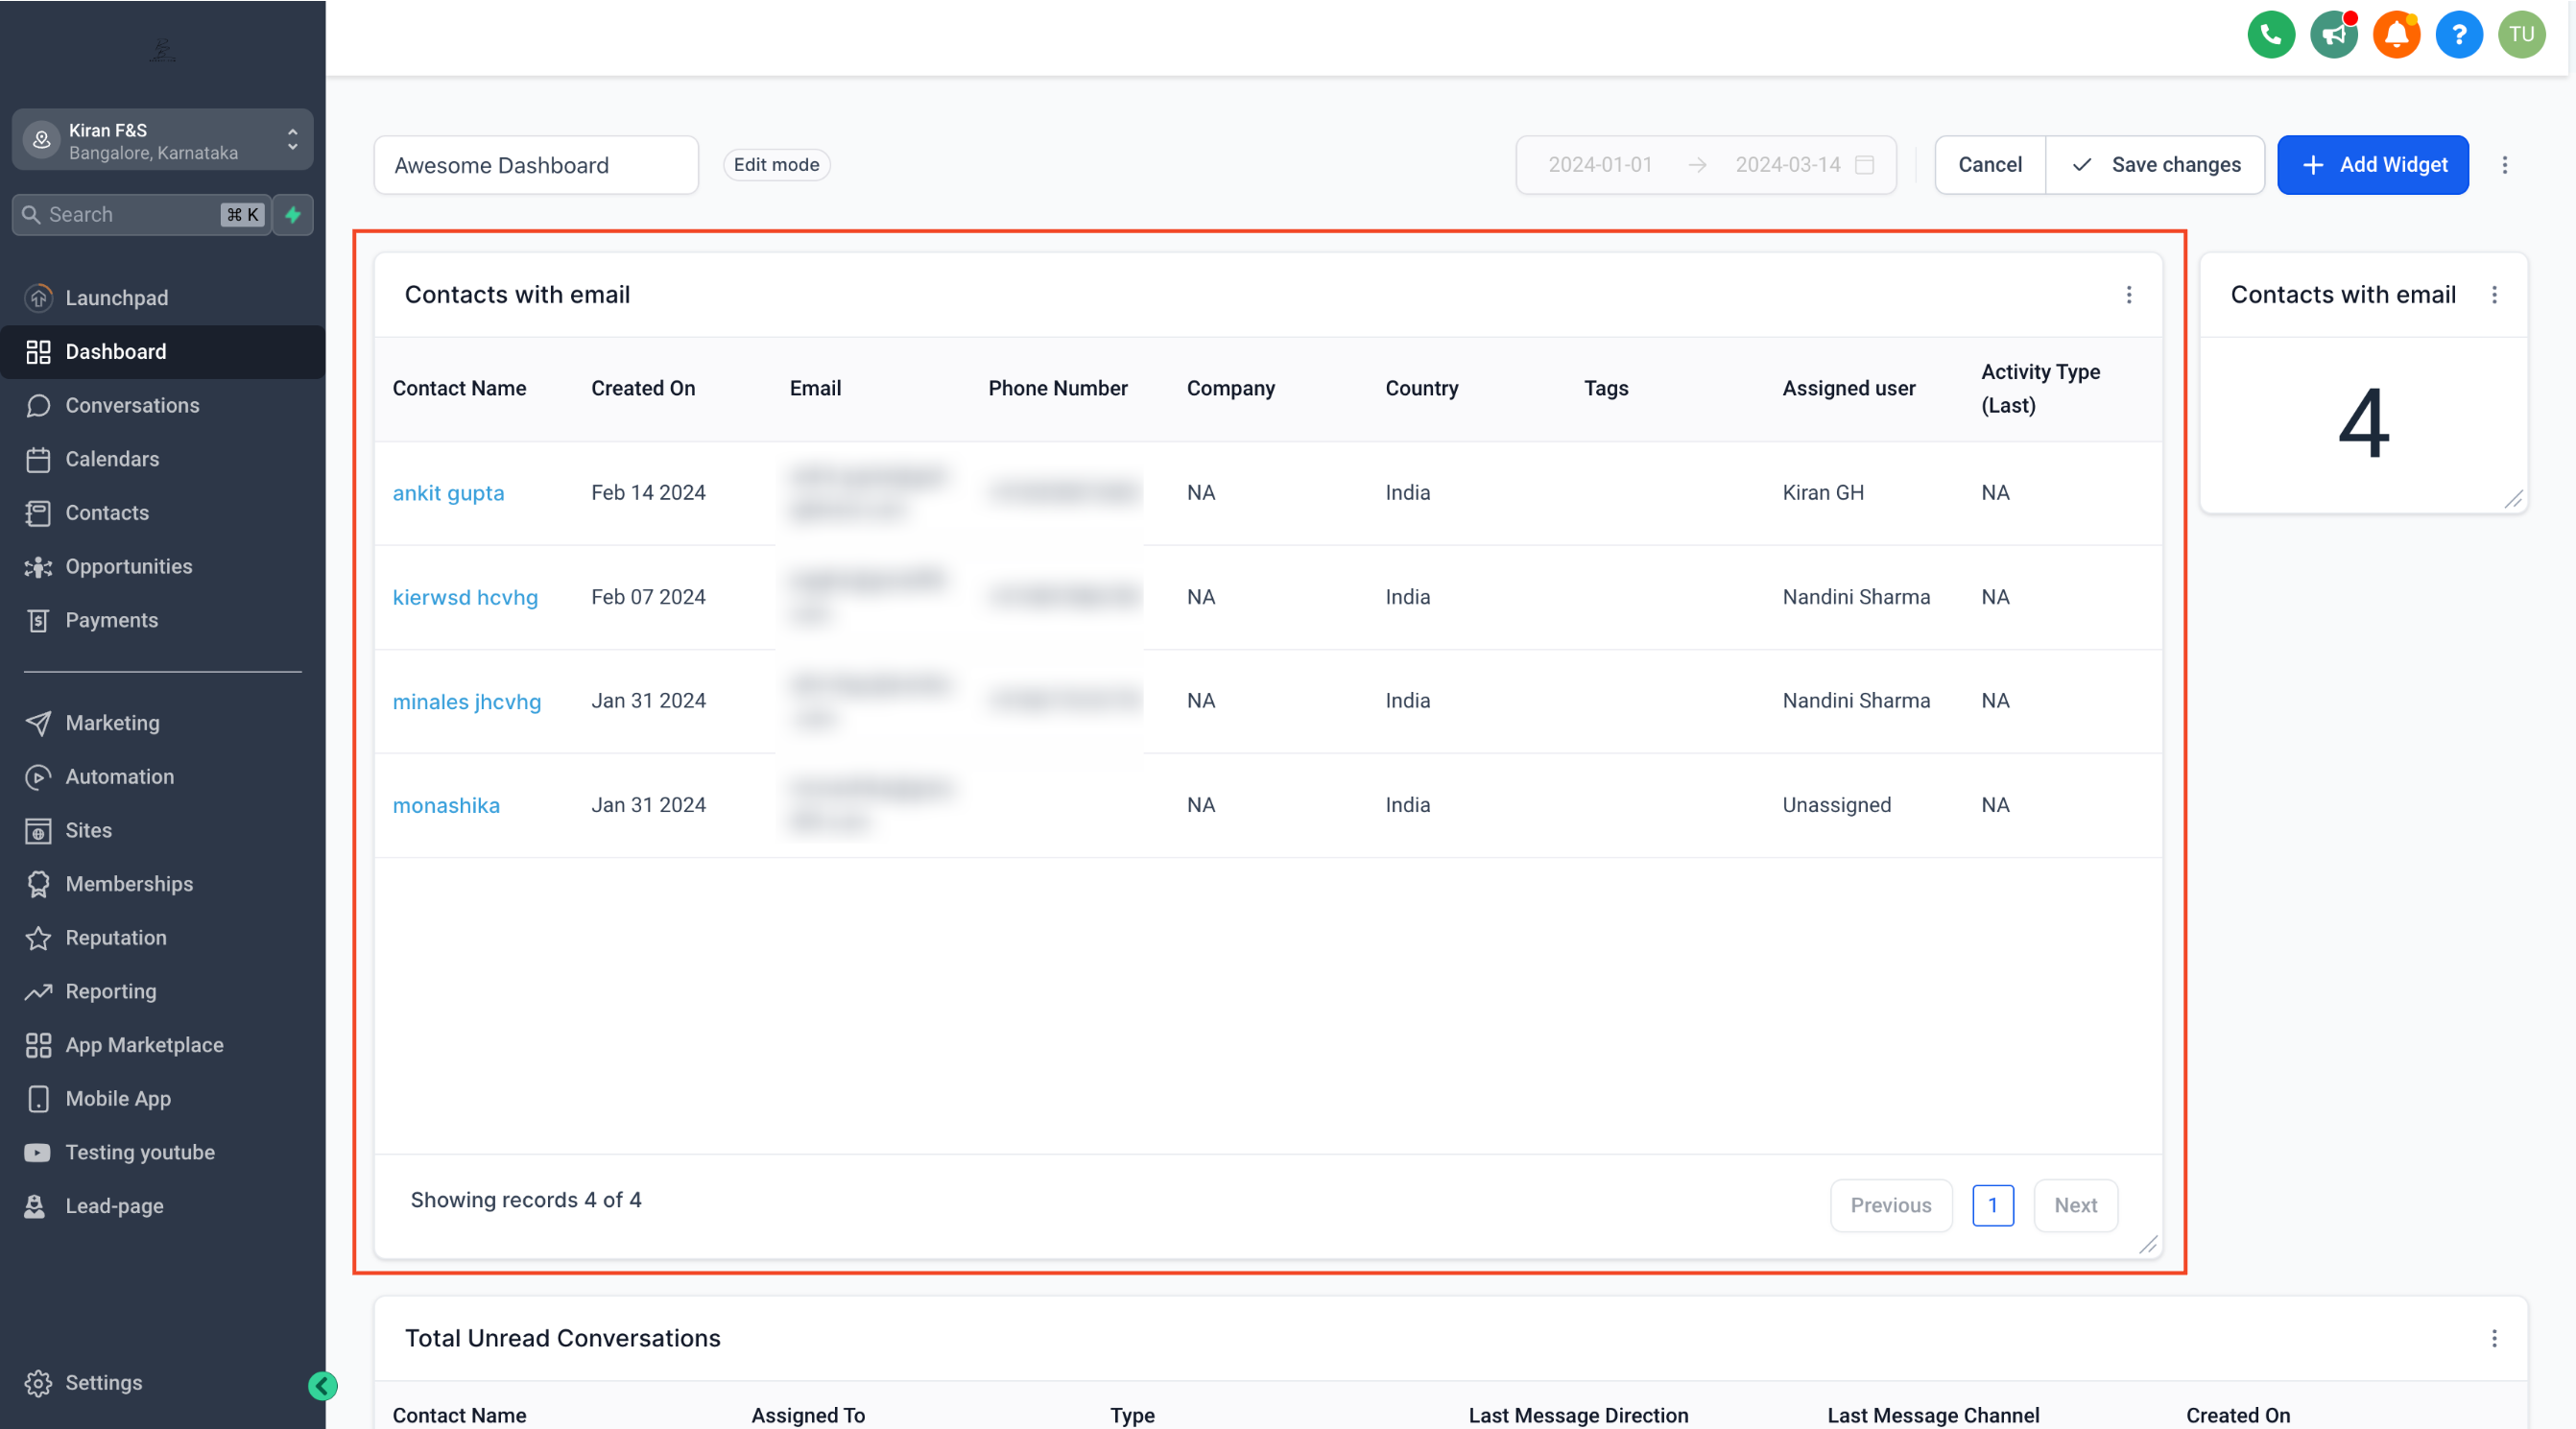
The table chart widget turns metric data into a grid of rows and columns. It lives on any custom dashboard you build in HighLevel. After adding the widget, you pick which data columns appear and optionally set a column that determines the table's sort order. When the widget is saved, it appears alongside other widgets, updating in real time as the underlying data changes. For email widgets, the Source Action Name column reveals the workflow step that triggered each email, helping you track campaign actions directly from the dashboard.
03How businesses use table charts for dashboard widgets
- Email workflow monitoring. Add a table chart widget to an email dashboard, select the Source Action Name column, and sort by that column to see which workflow steps triggered each email.
- General metric reporting. Create a table chart widget, choose the relevant metric columns, set a column for sorting, and save to view up to date data in a tabular format.
- Quick data sorting. Select a column in Advance Settings to define the order of rows, allowing users to right away reorganize the table by any metric.
04How to set up and use table charts for dashboard widgets in HighLevel
Add a table chart widget to a dashboard
- Open your dashboard, click the edit icon, then choose Add widget.
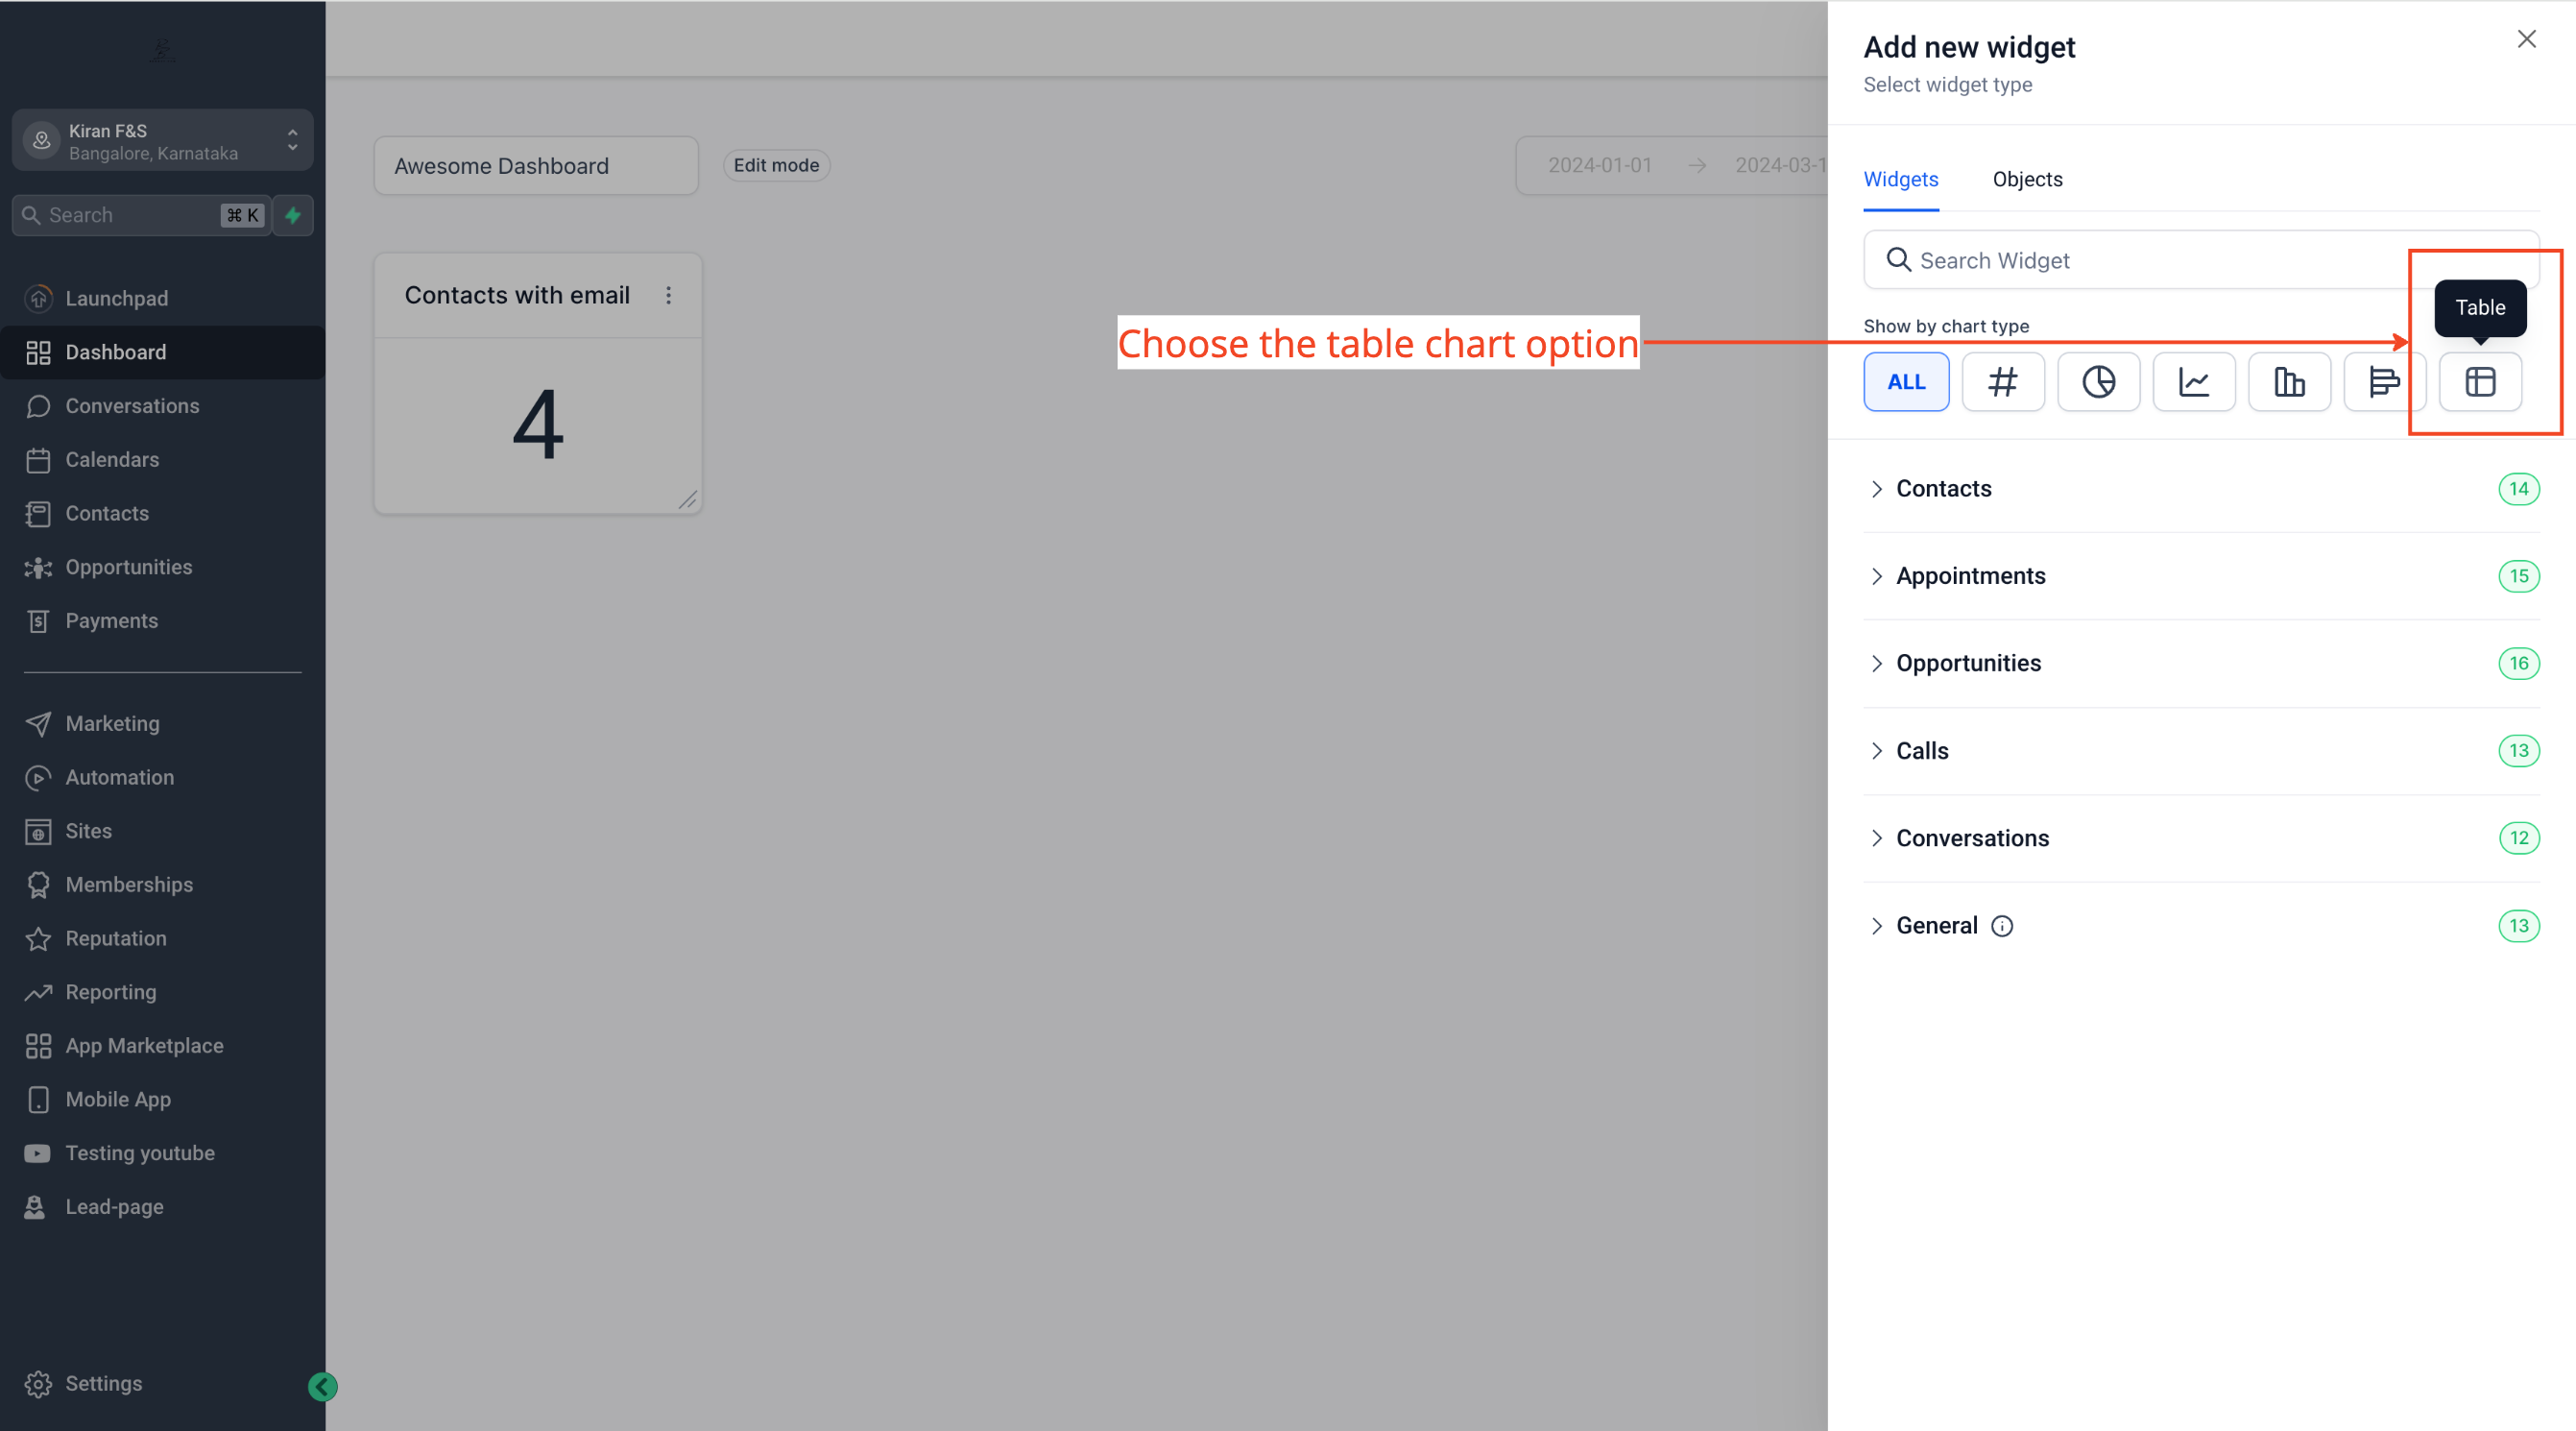
- Scroll through the widget list and change the chart type to Table.
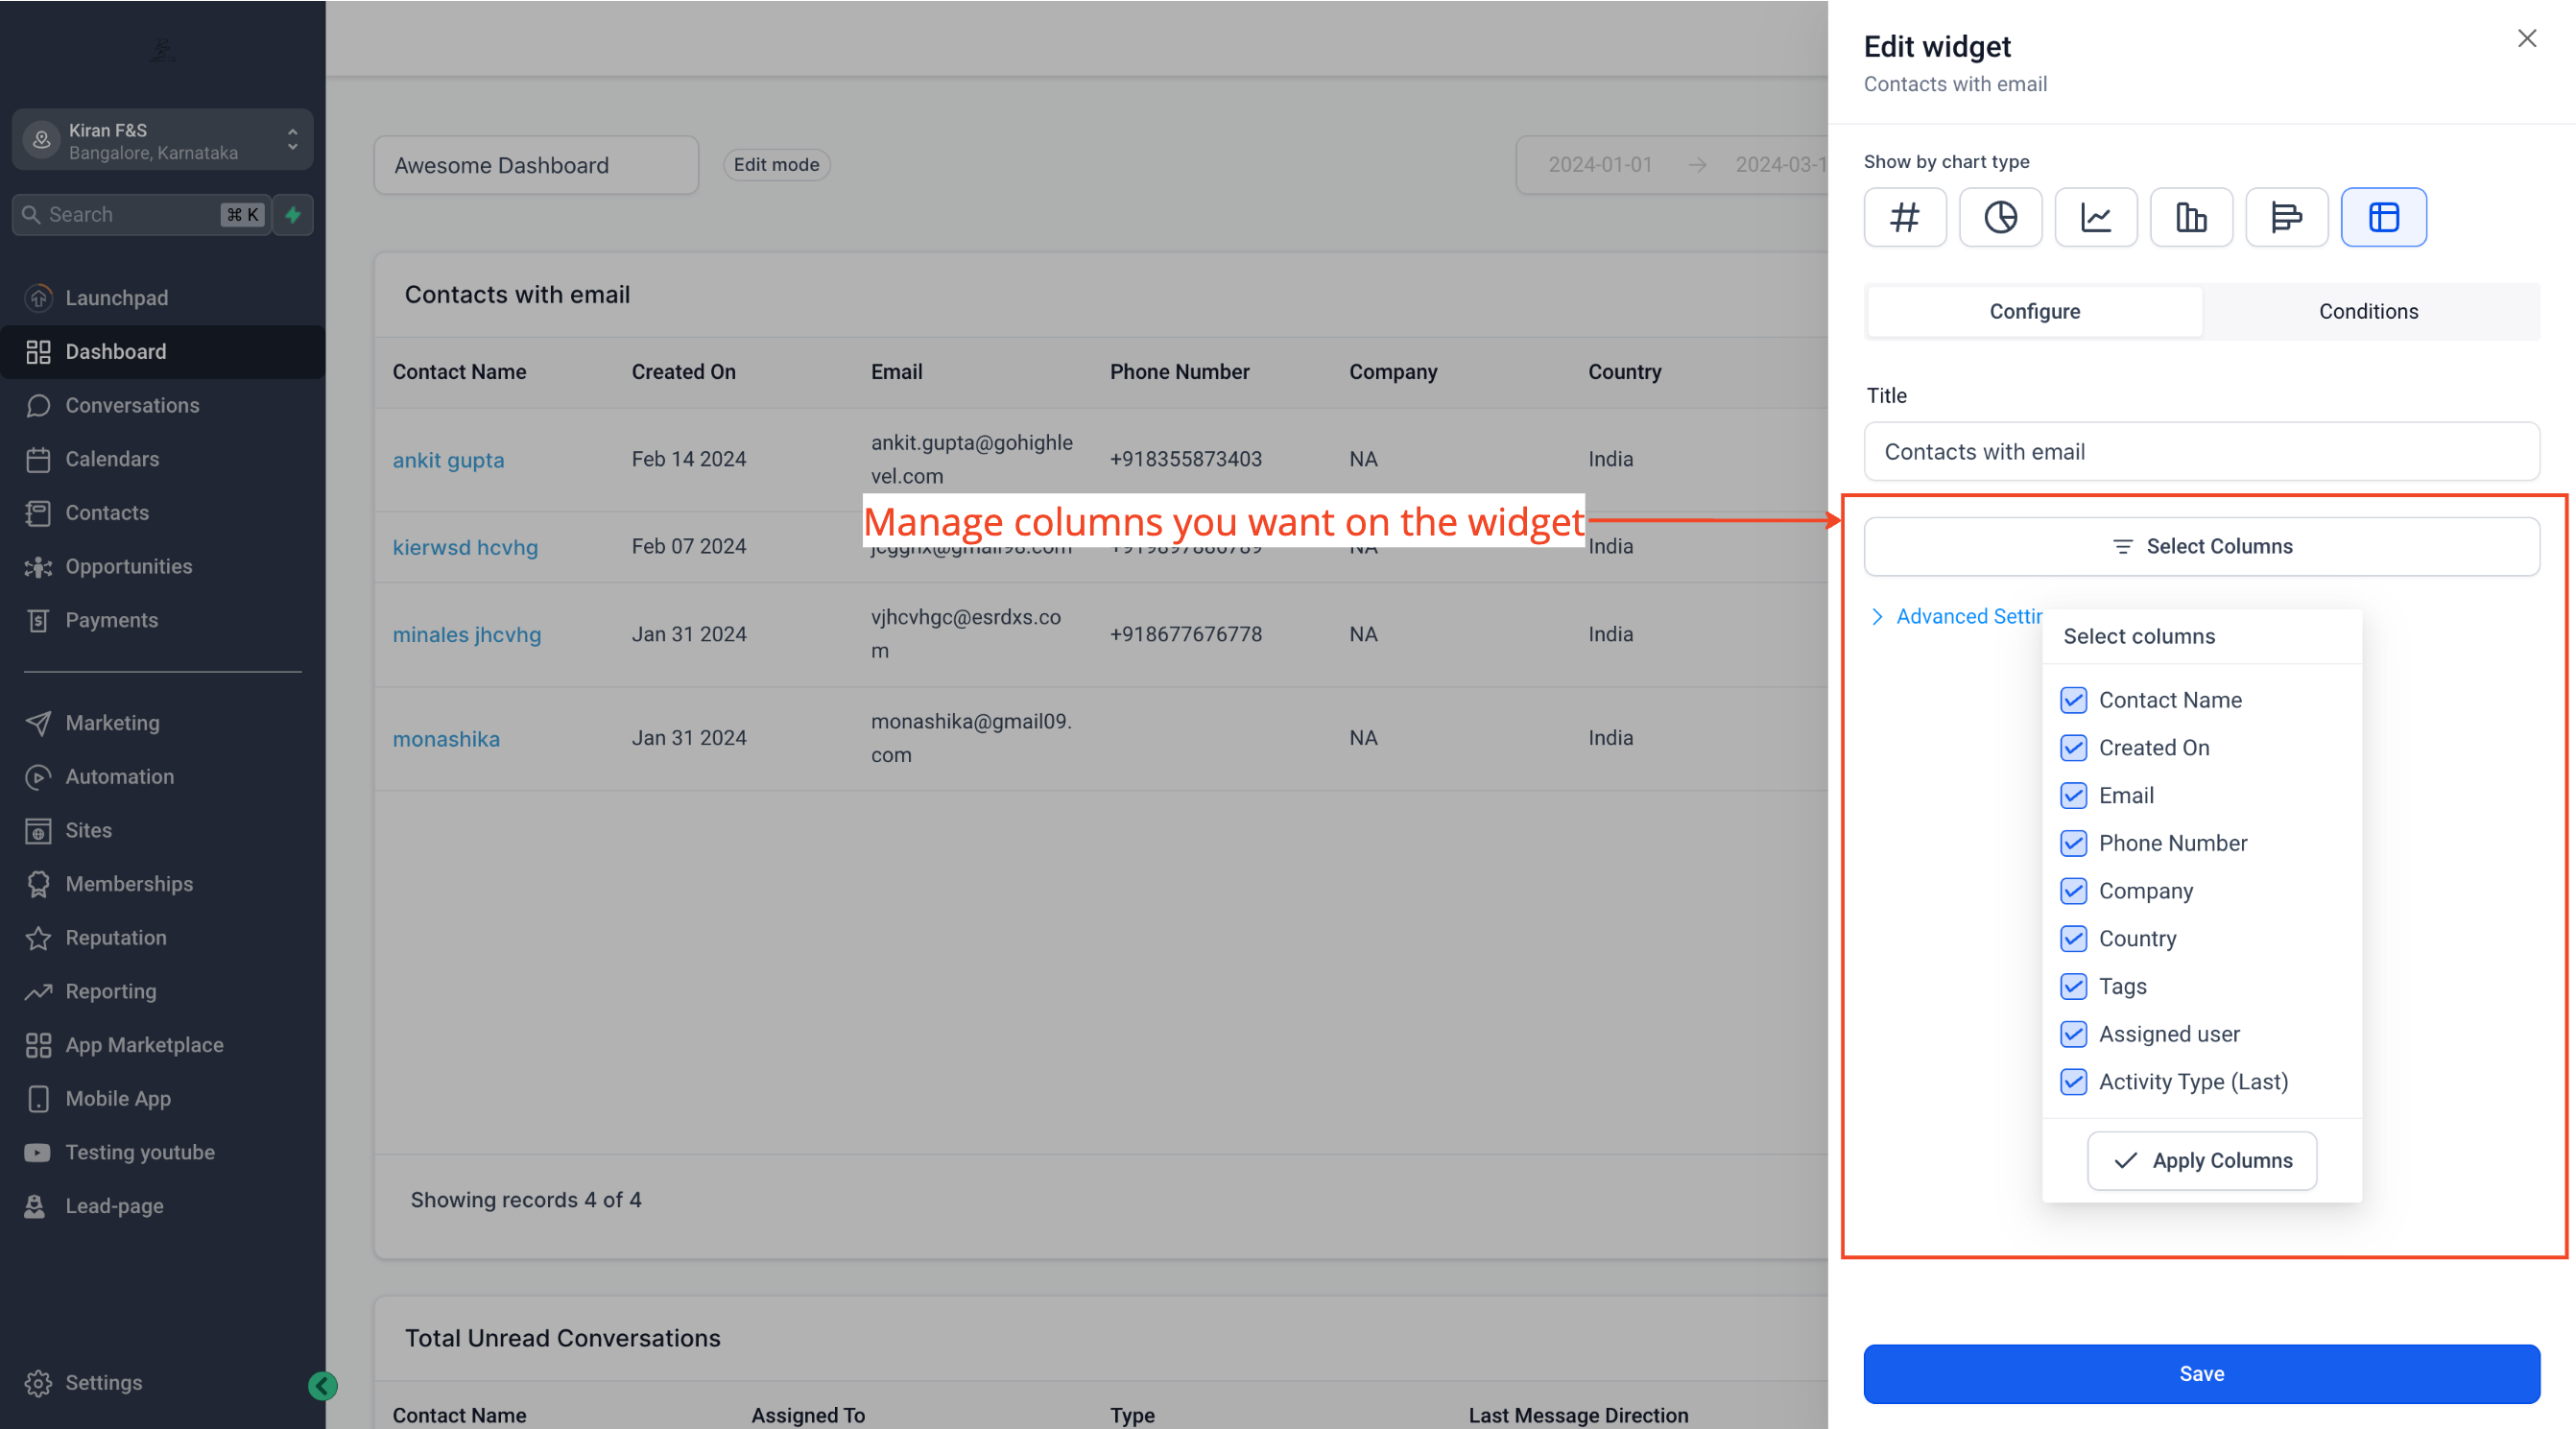
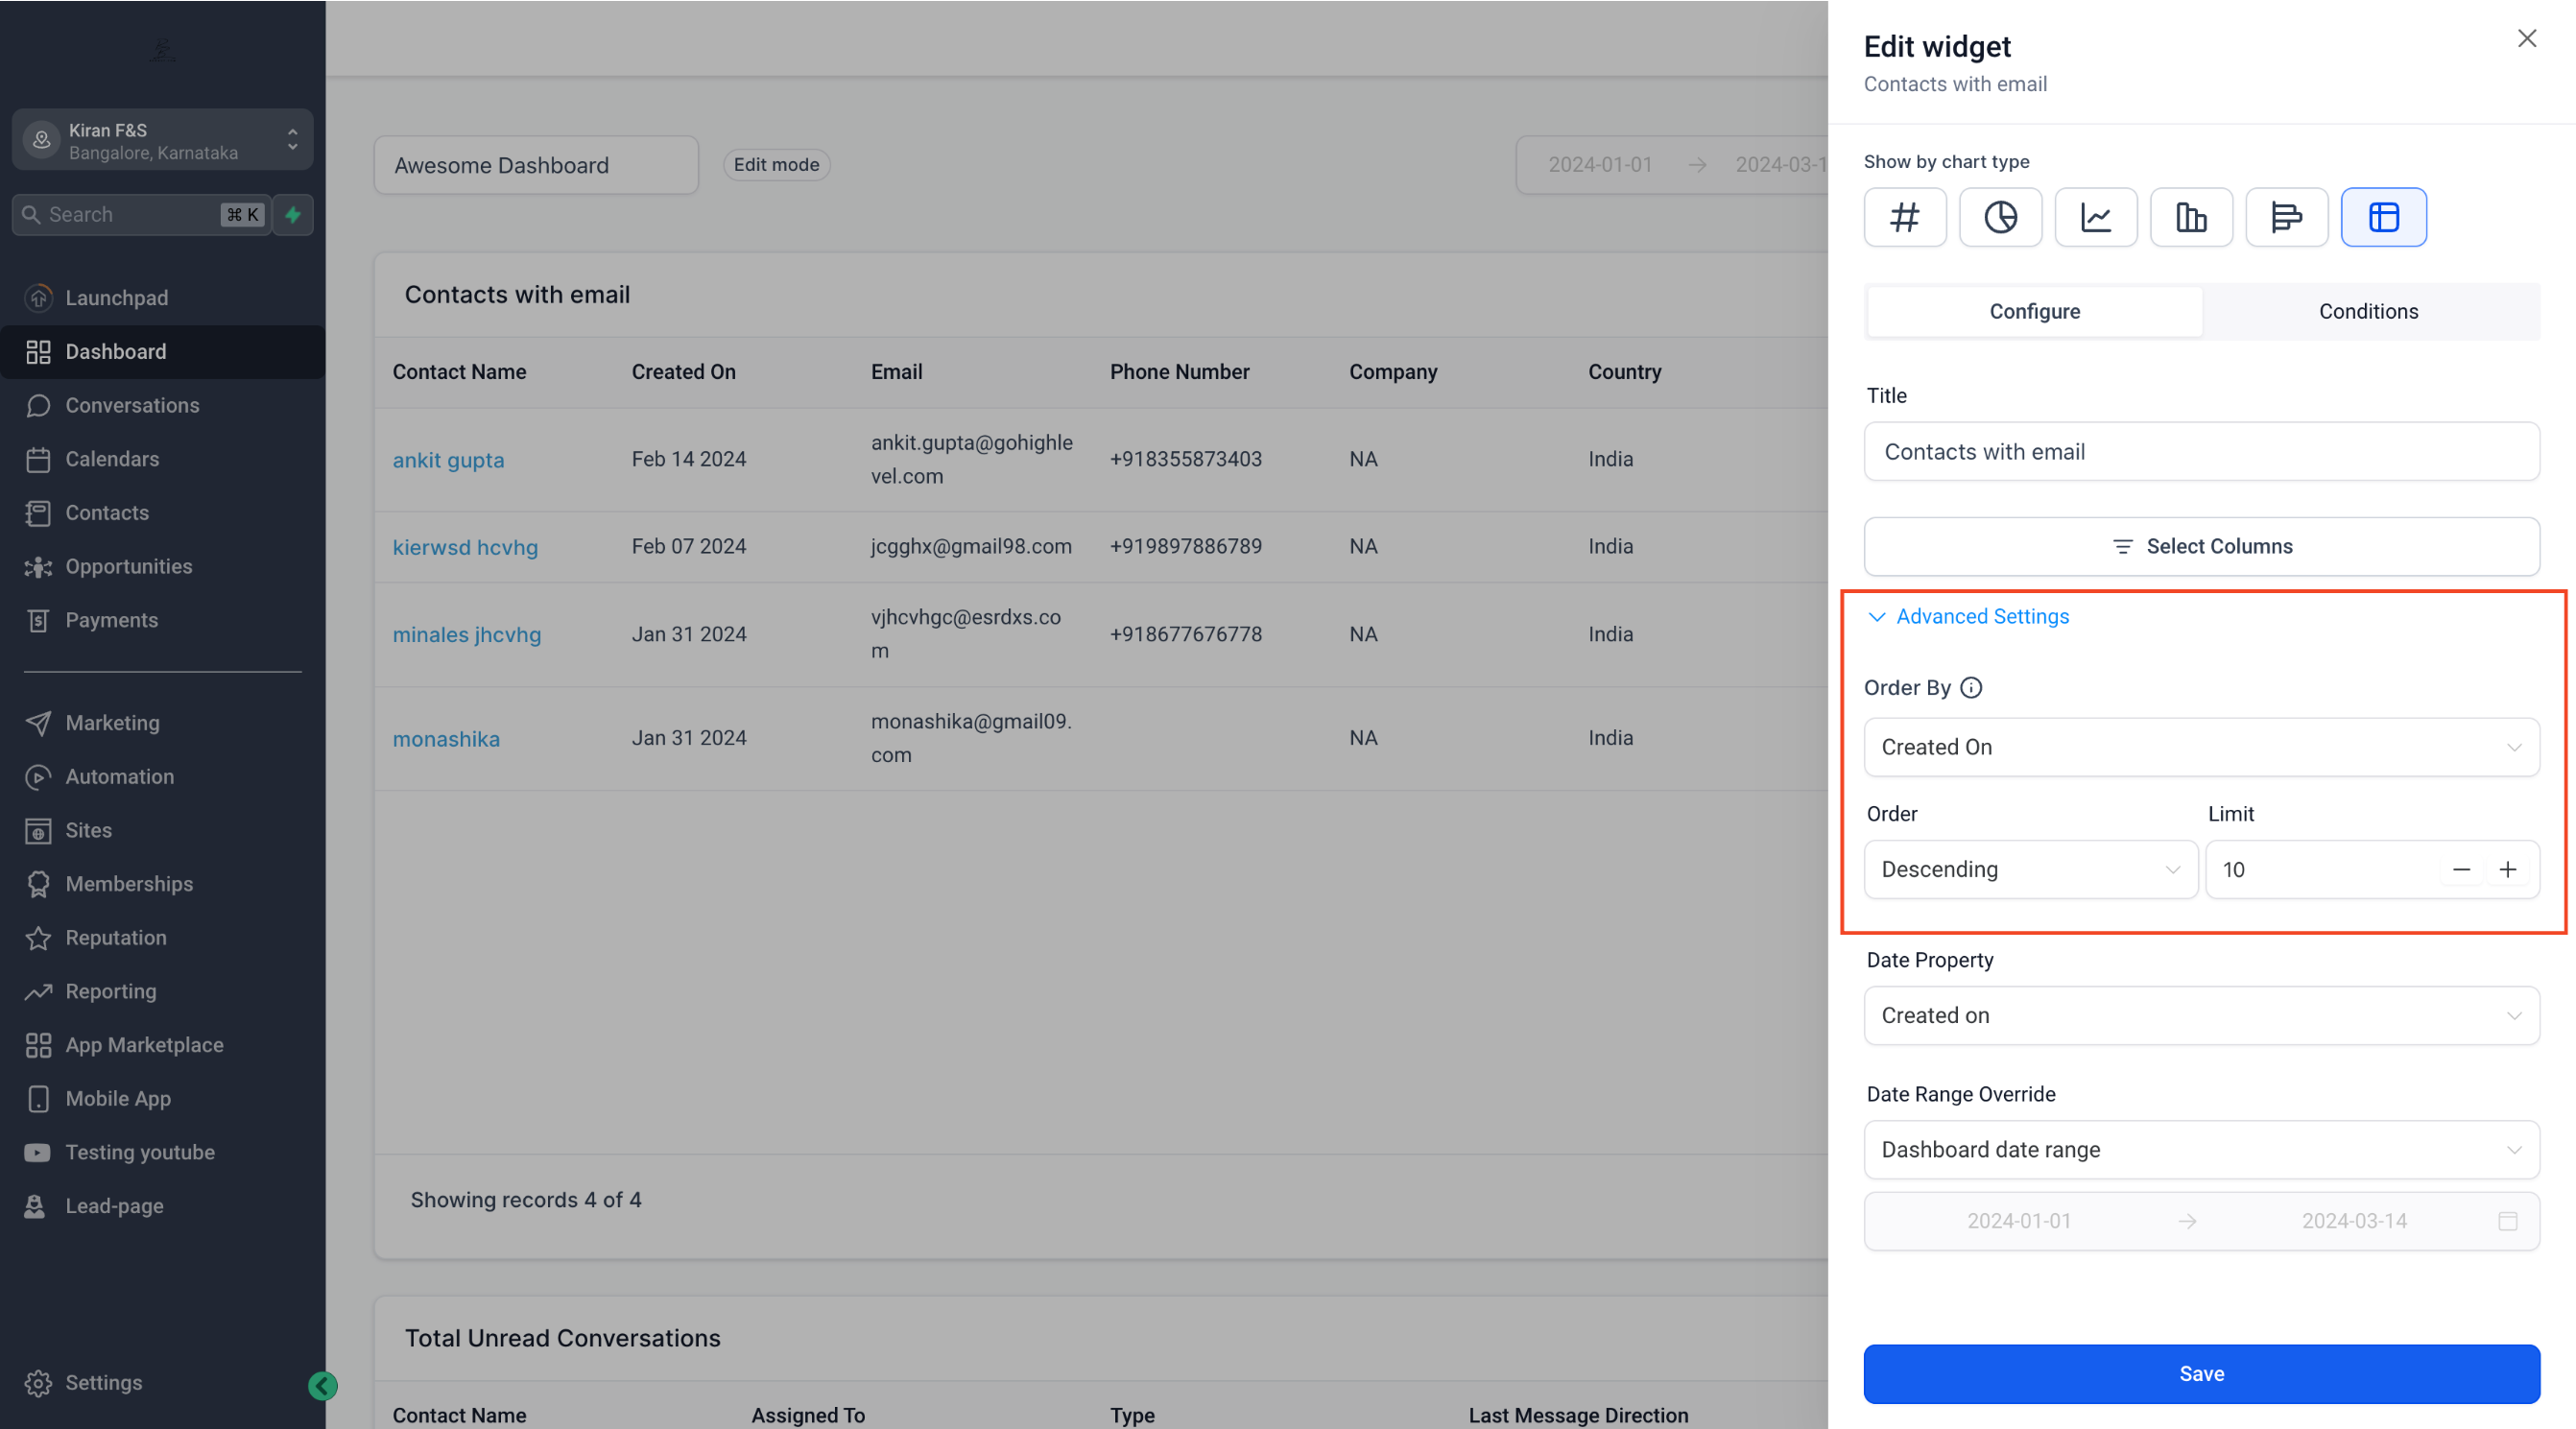
- Click Select Columns and pick the columns you want displayed; in Advance Settings pick the column to order the table.
- Click Save to place the widget on the dashboard.
05What it looks like in HighLevel
06Settings that matter
- Select Columns. Controls which data fields appear as columns in the table widget.
- Advance Settings. Allows you to choose the column used to sort the table rows.
- Source Action Name (Email widget). Shows the workflow step that triggered each email, adding traceability to the table.
07How it connects to the rest of HighLevel
- Learn what dashboard widgets are and how to add them. Dashboard widgets overview
- Step by step guide for creating and adding new widgets. Create widgets guide
- Information on setting permissions for dashboard widgets. Dashboard permissions
Michael's take

When you’re pulling data from multiple campaigns, it’s easy to lose sight of which email or action actually drove the result. A table chart puts that information into rows you can scan, so you see the source of each email and the numbers behind it.
The first thing I would lock in is the column order setting. Getting the right column to sort on makes the widget readable at a glance, and you won’t have to chase down the right view later.