
01Who this is for
- Course creators who sell online training can see enrollment trends at a glance.
- Small business owners offering membership courses can monitor revenue without leaving the platform.
- Educational consultants can spot drop off points to prioritize content improvements.
02Courses dashboard, explained
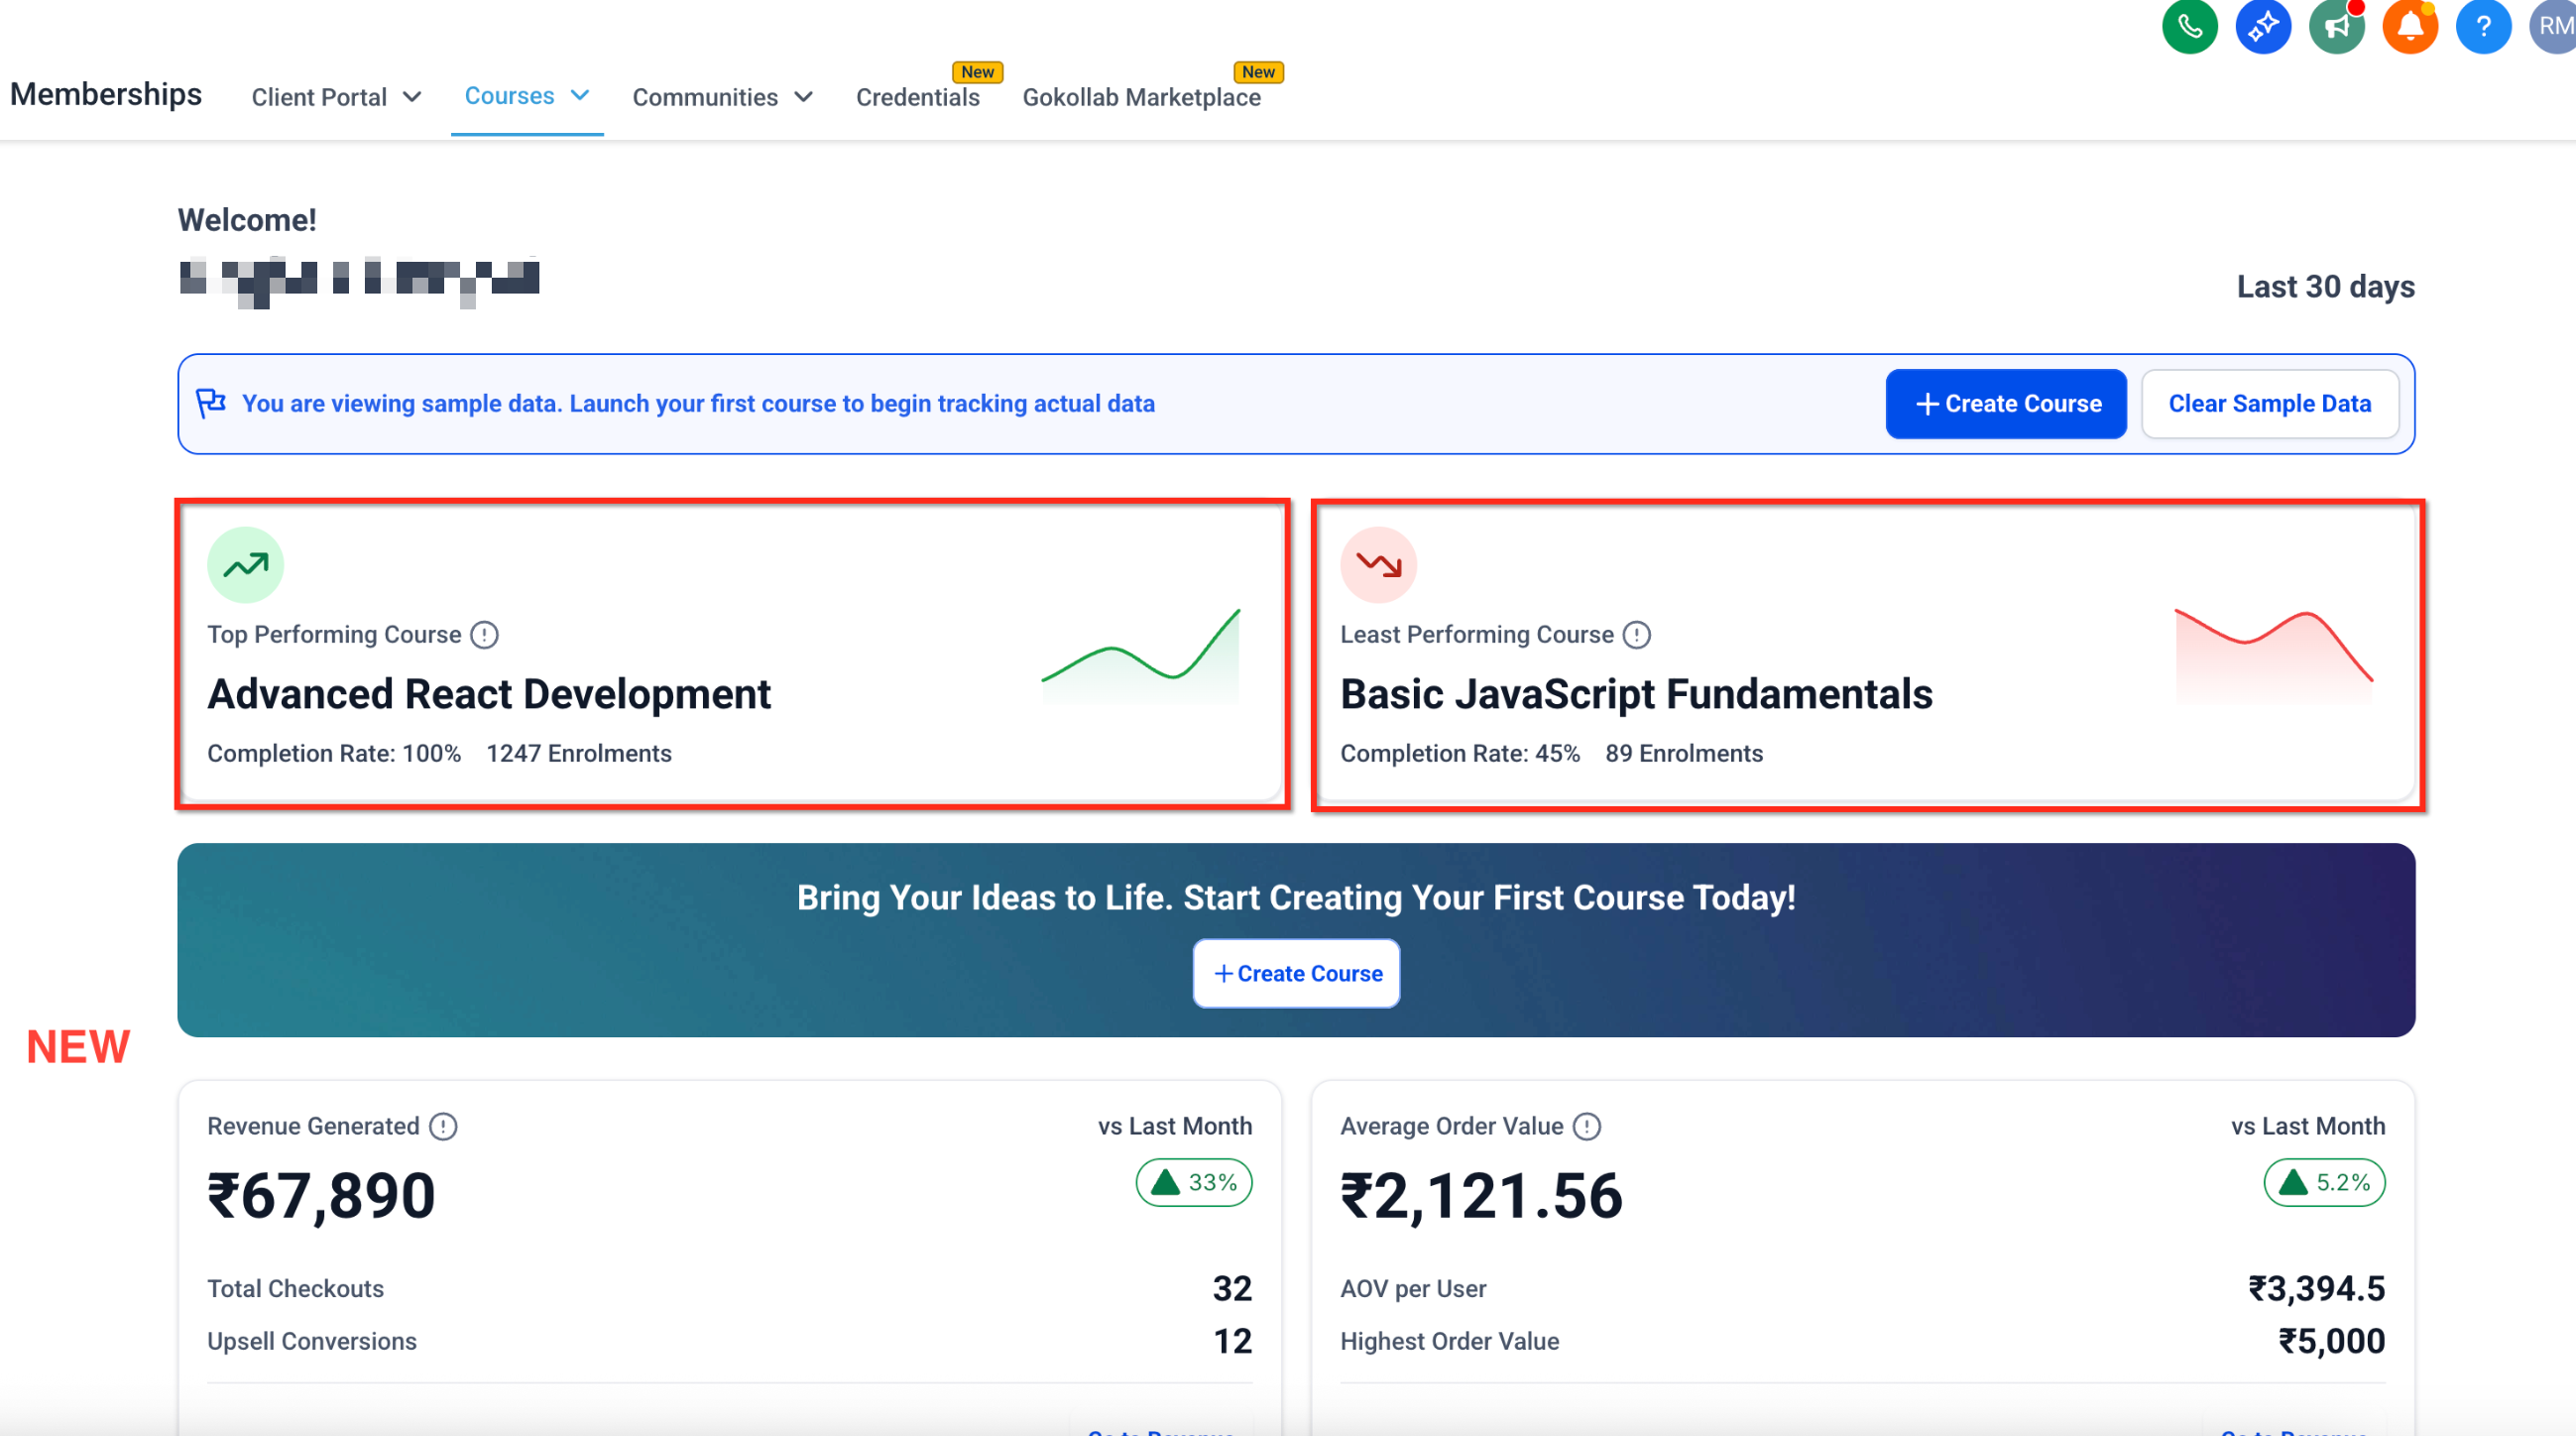
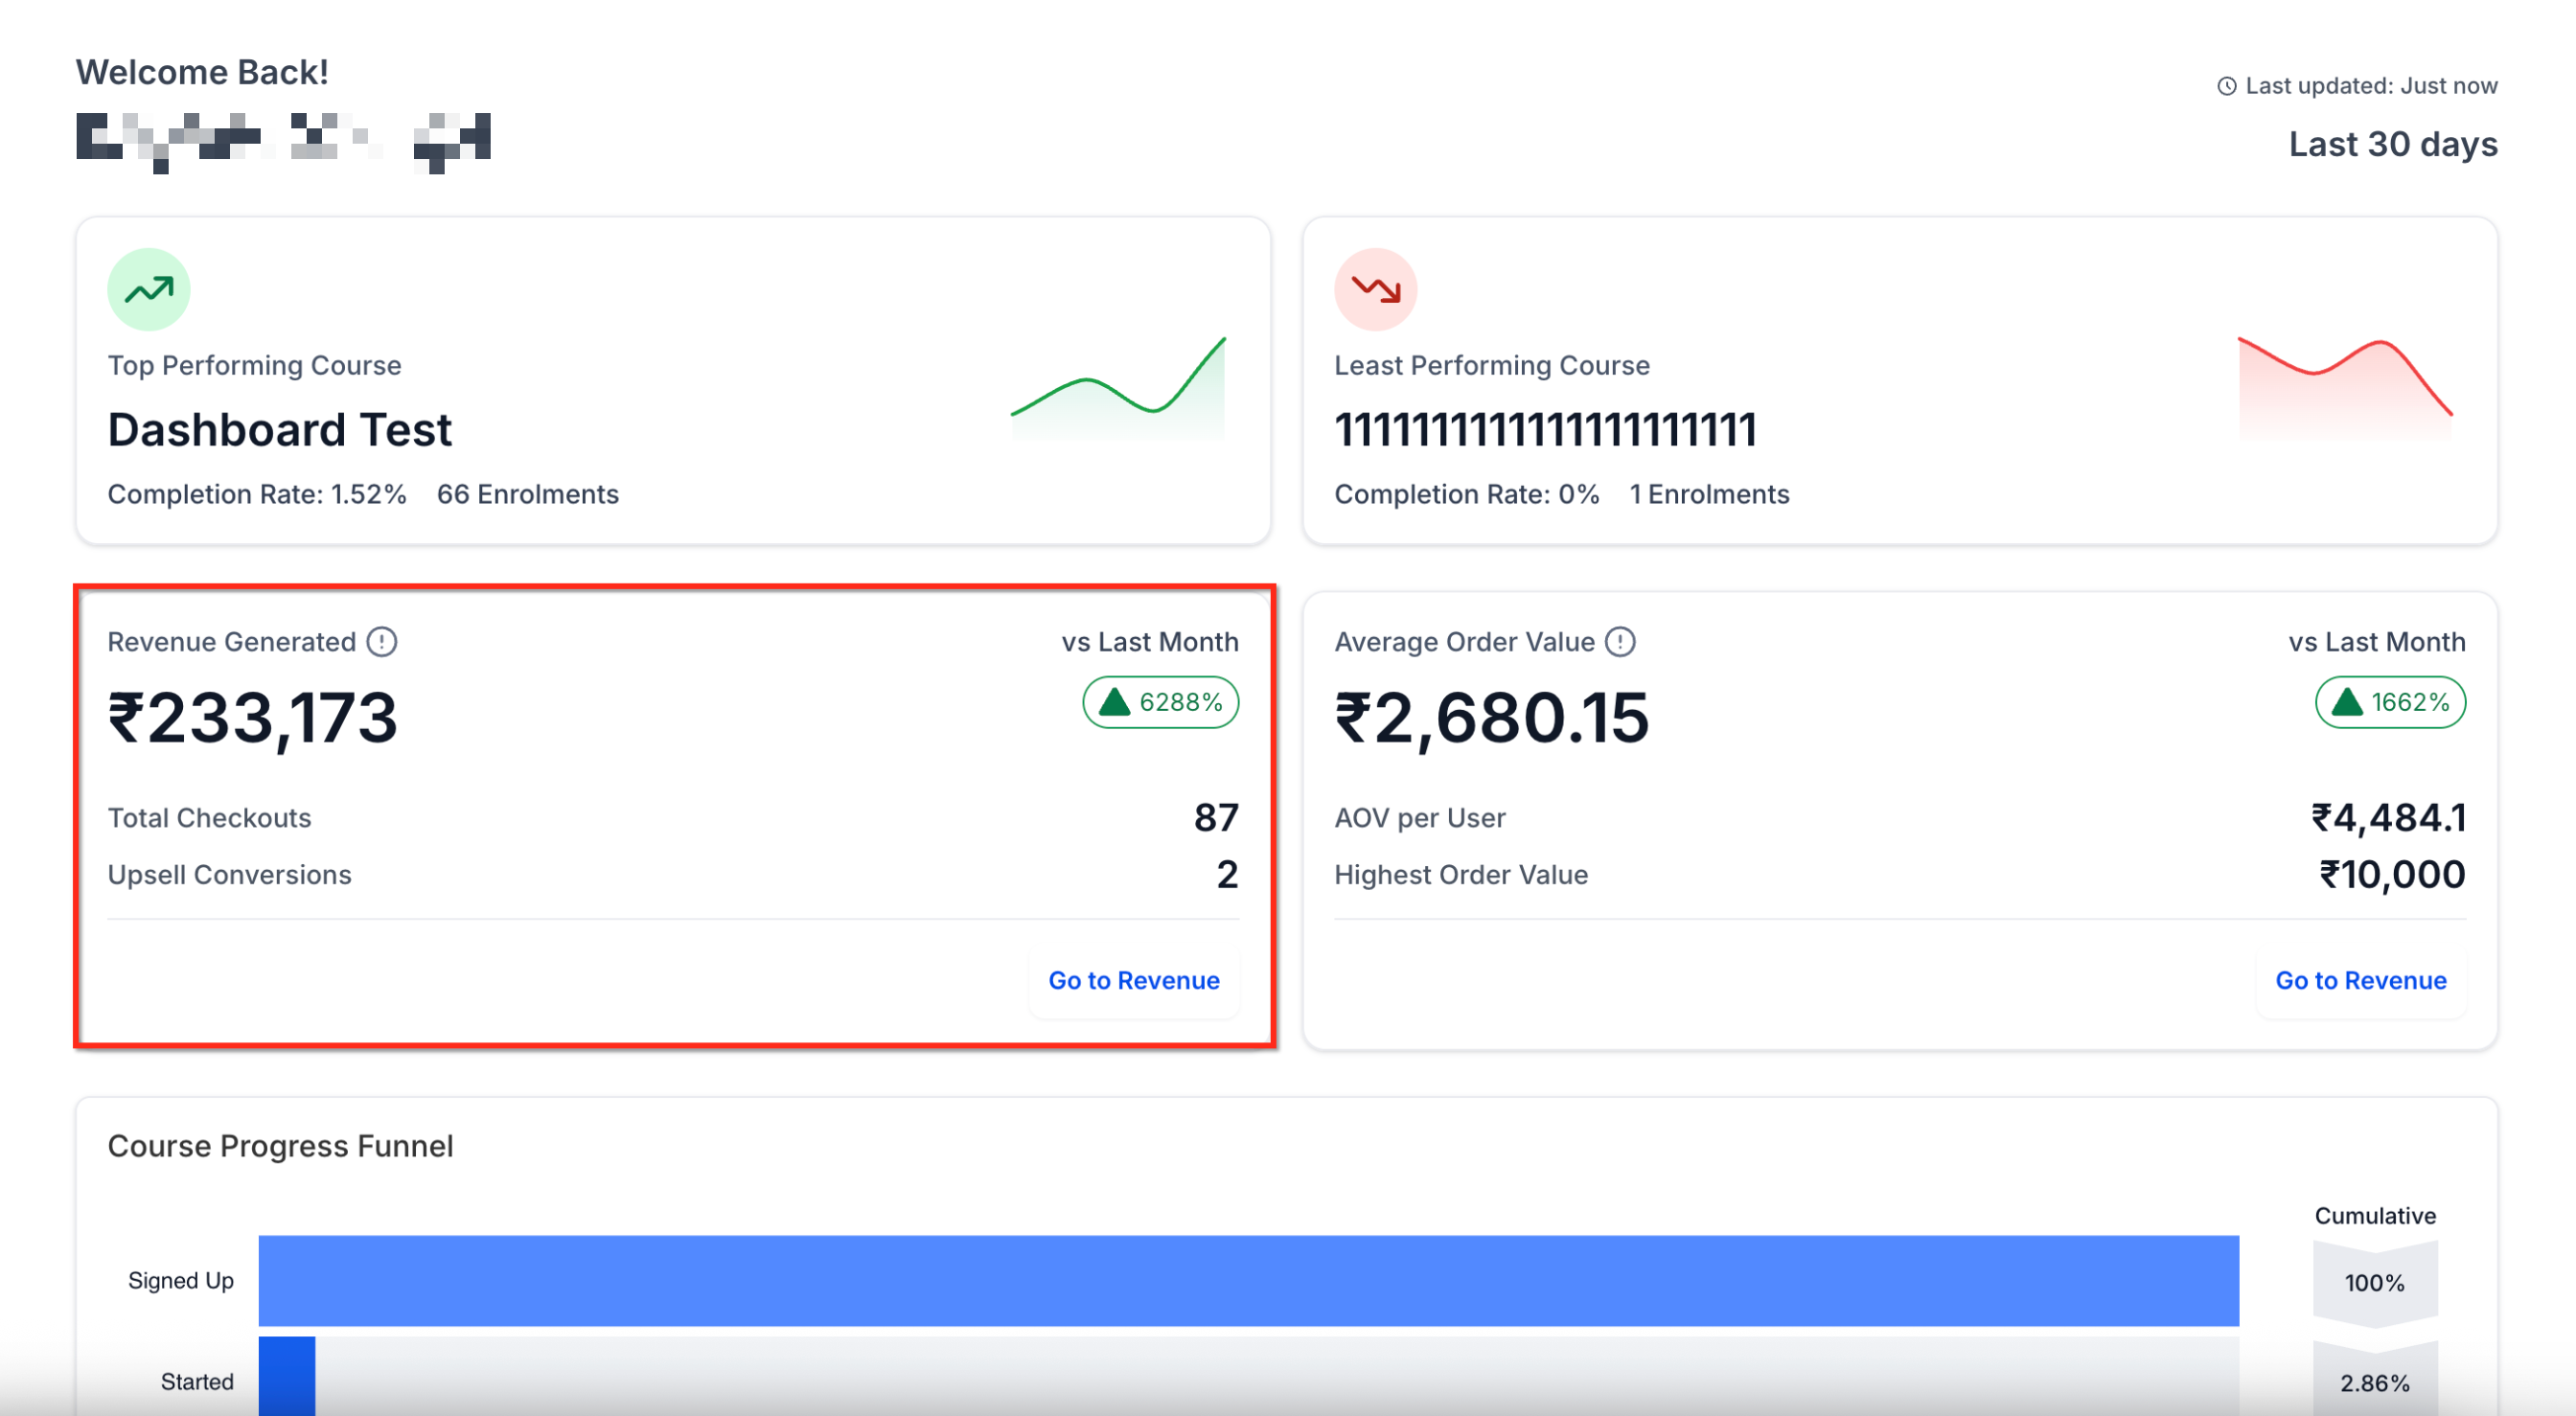
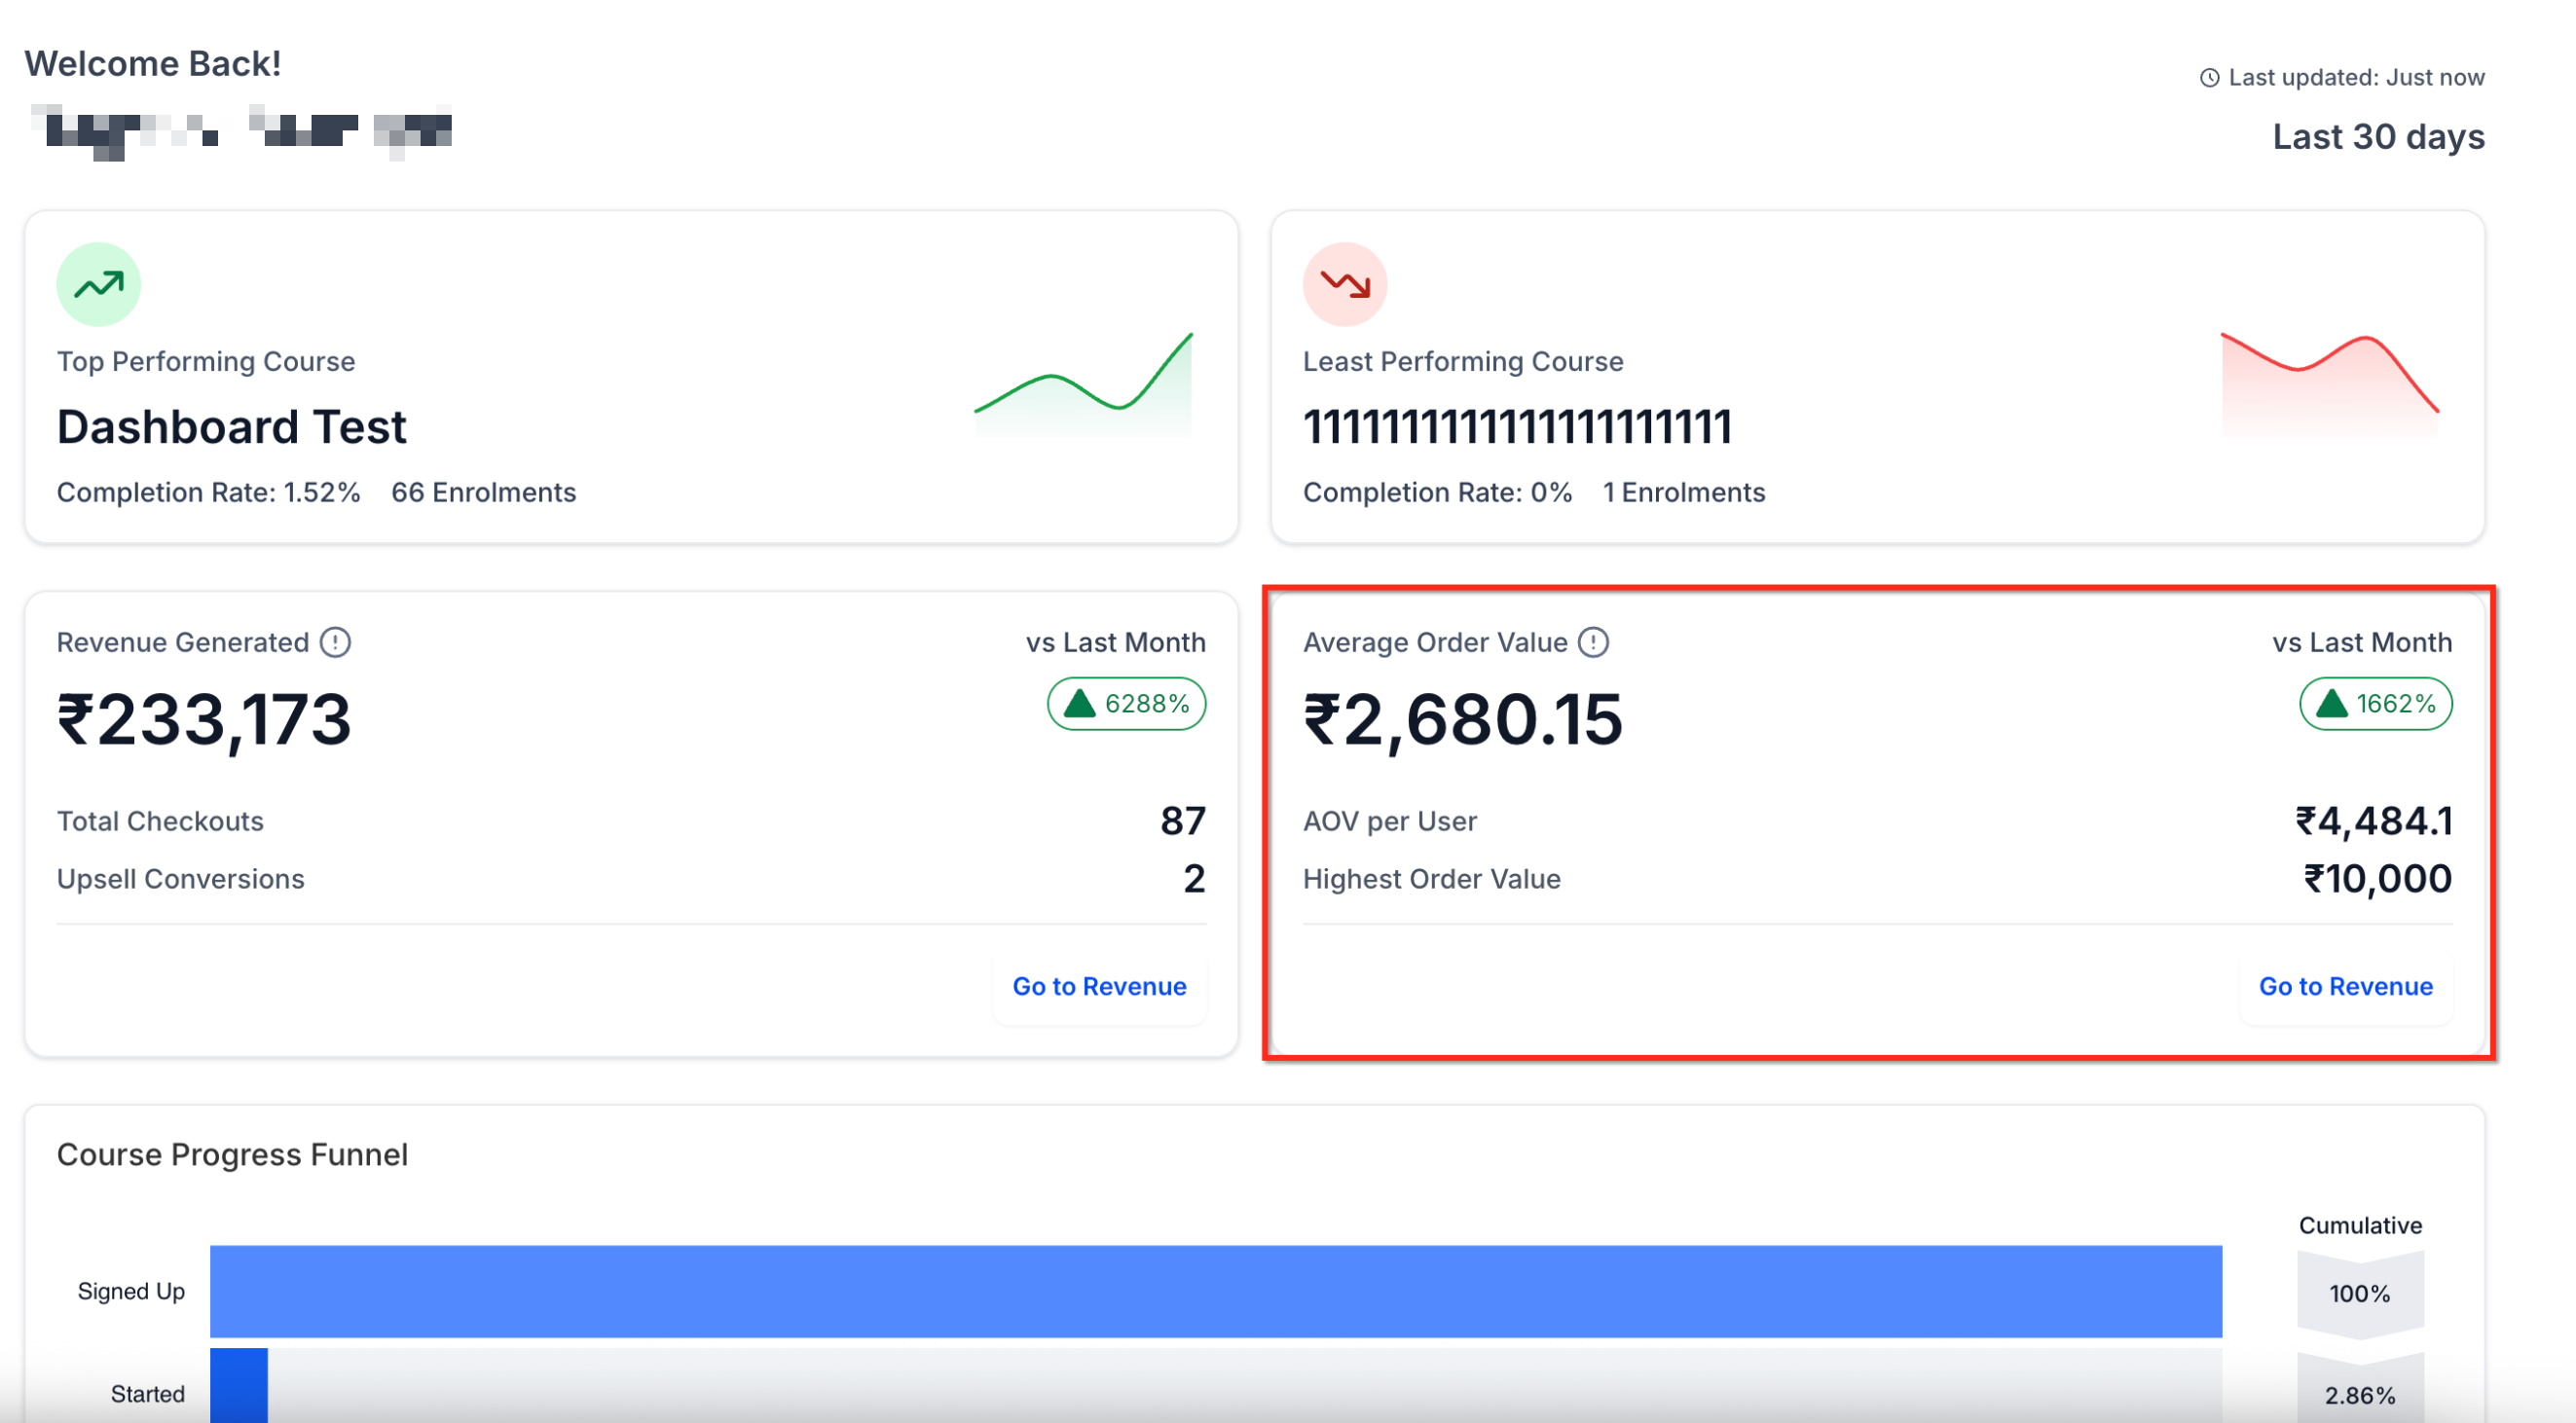
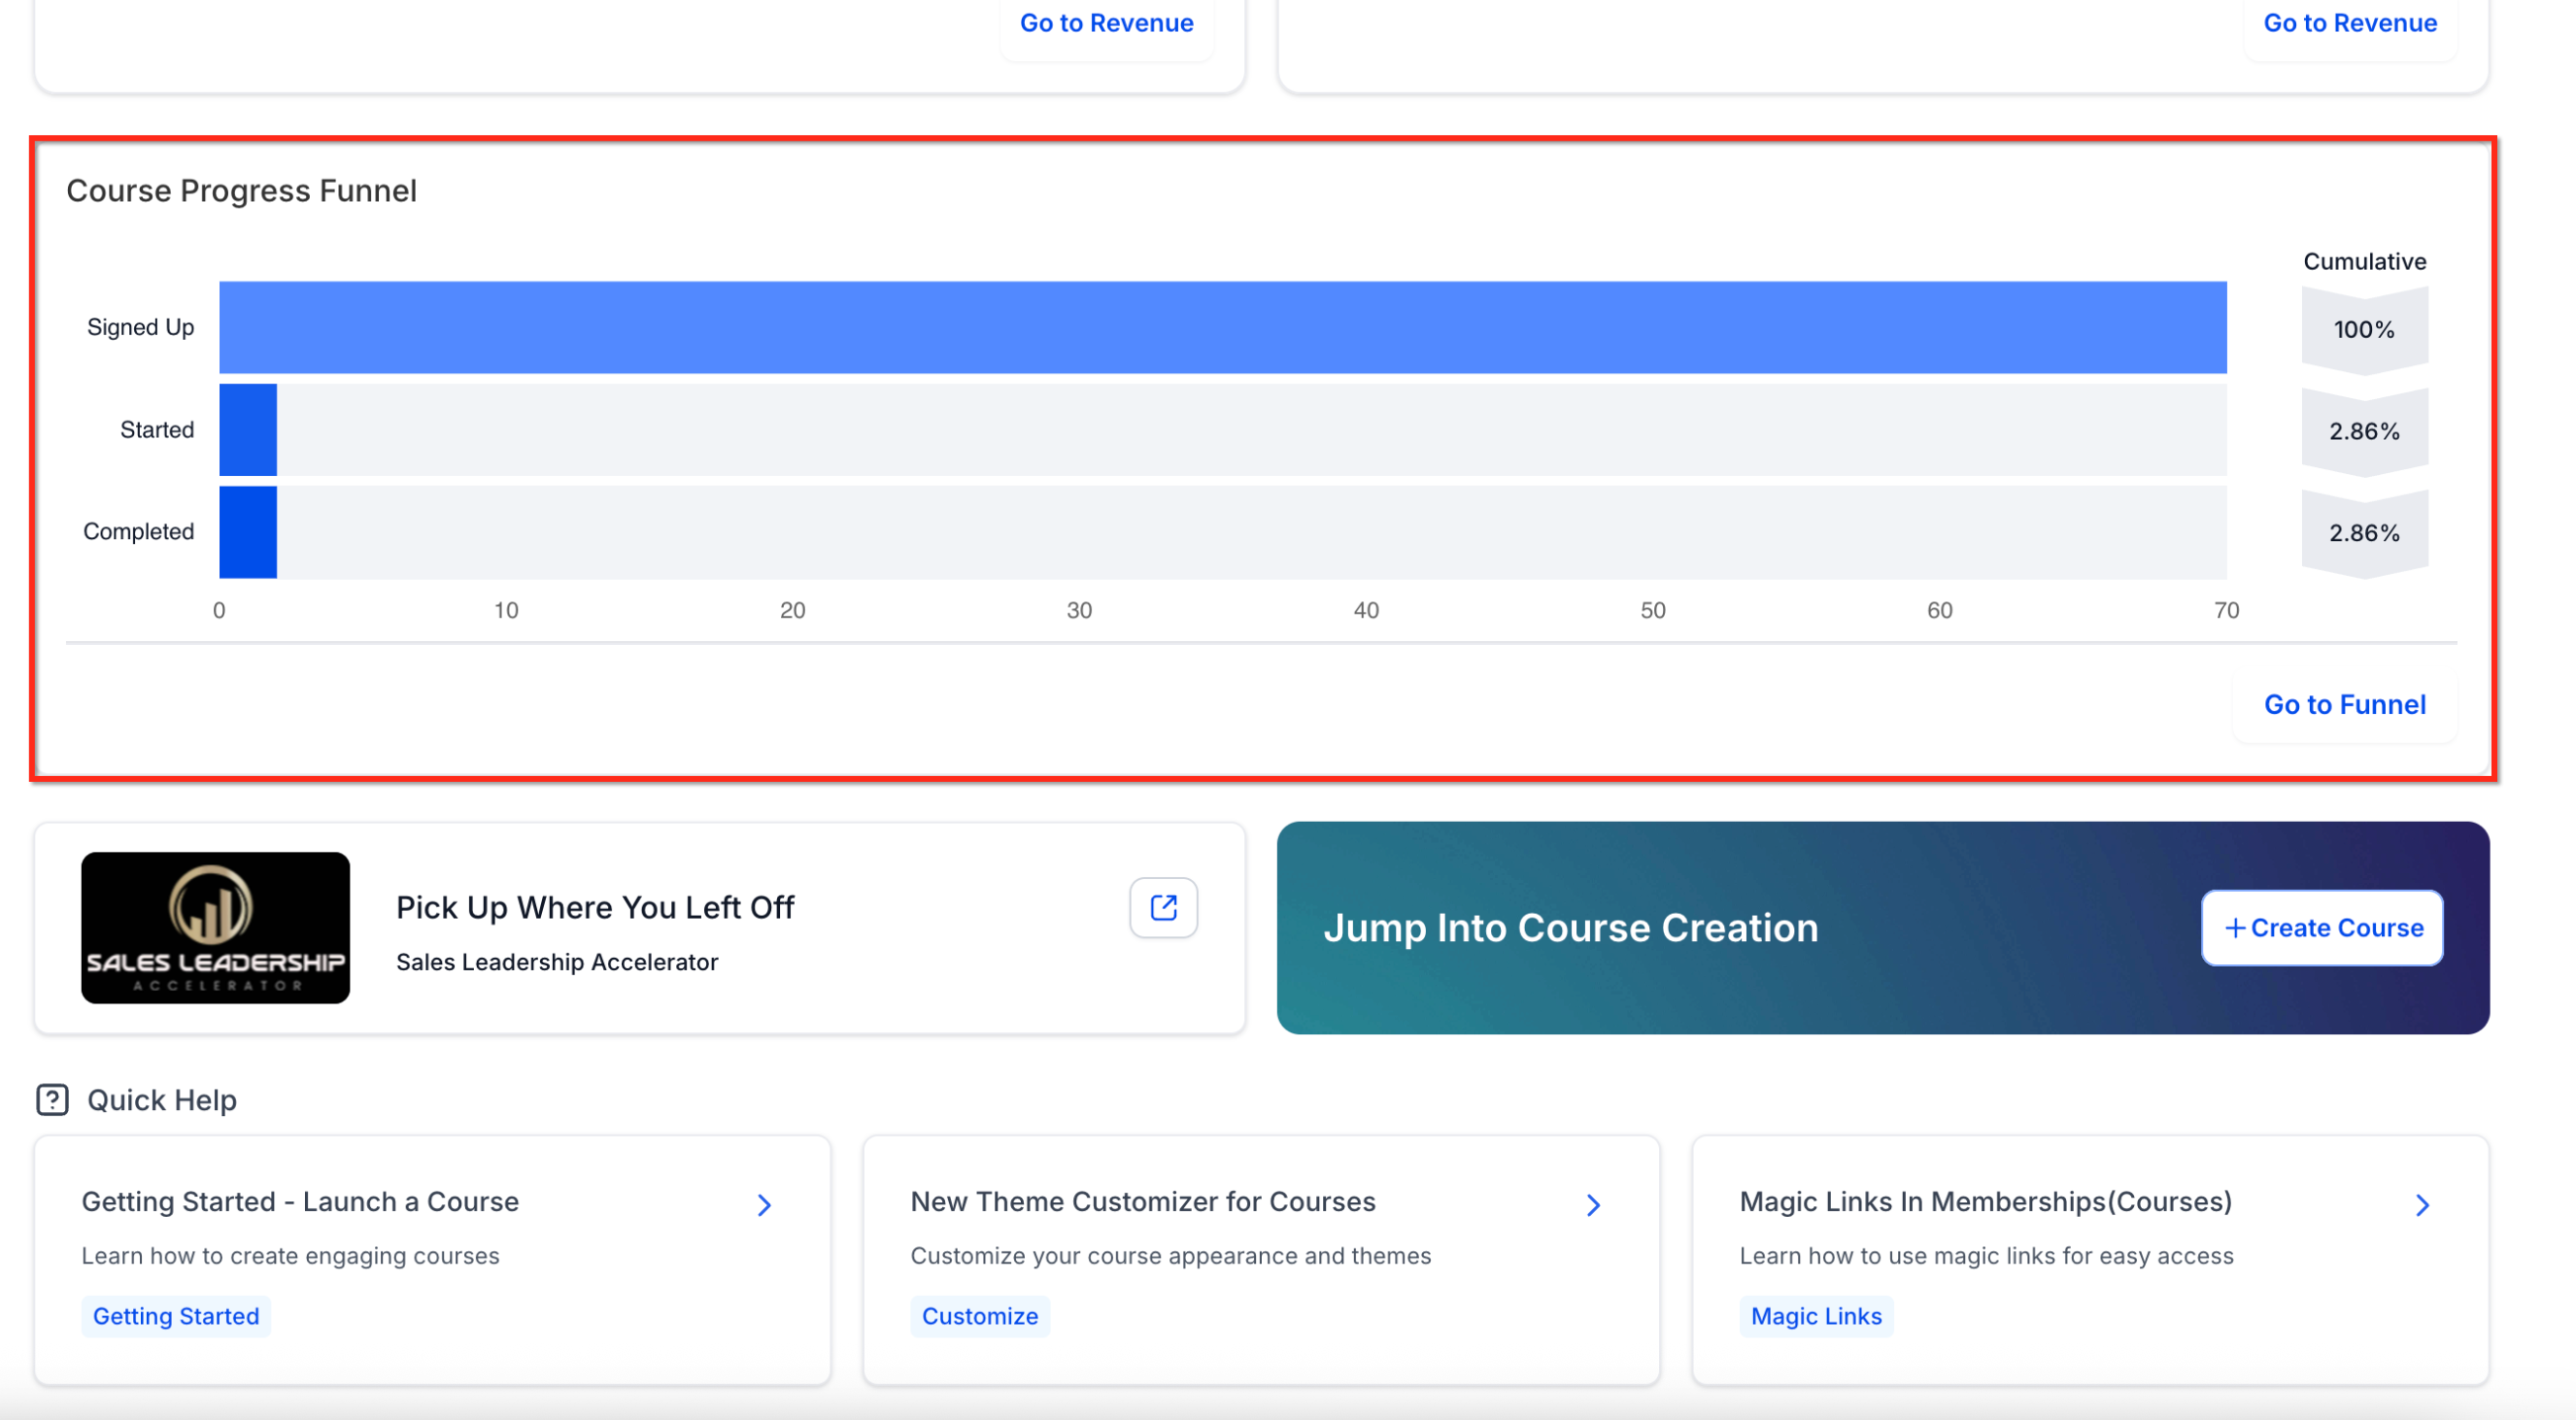
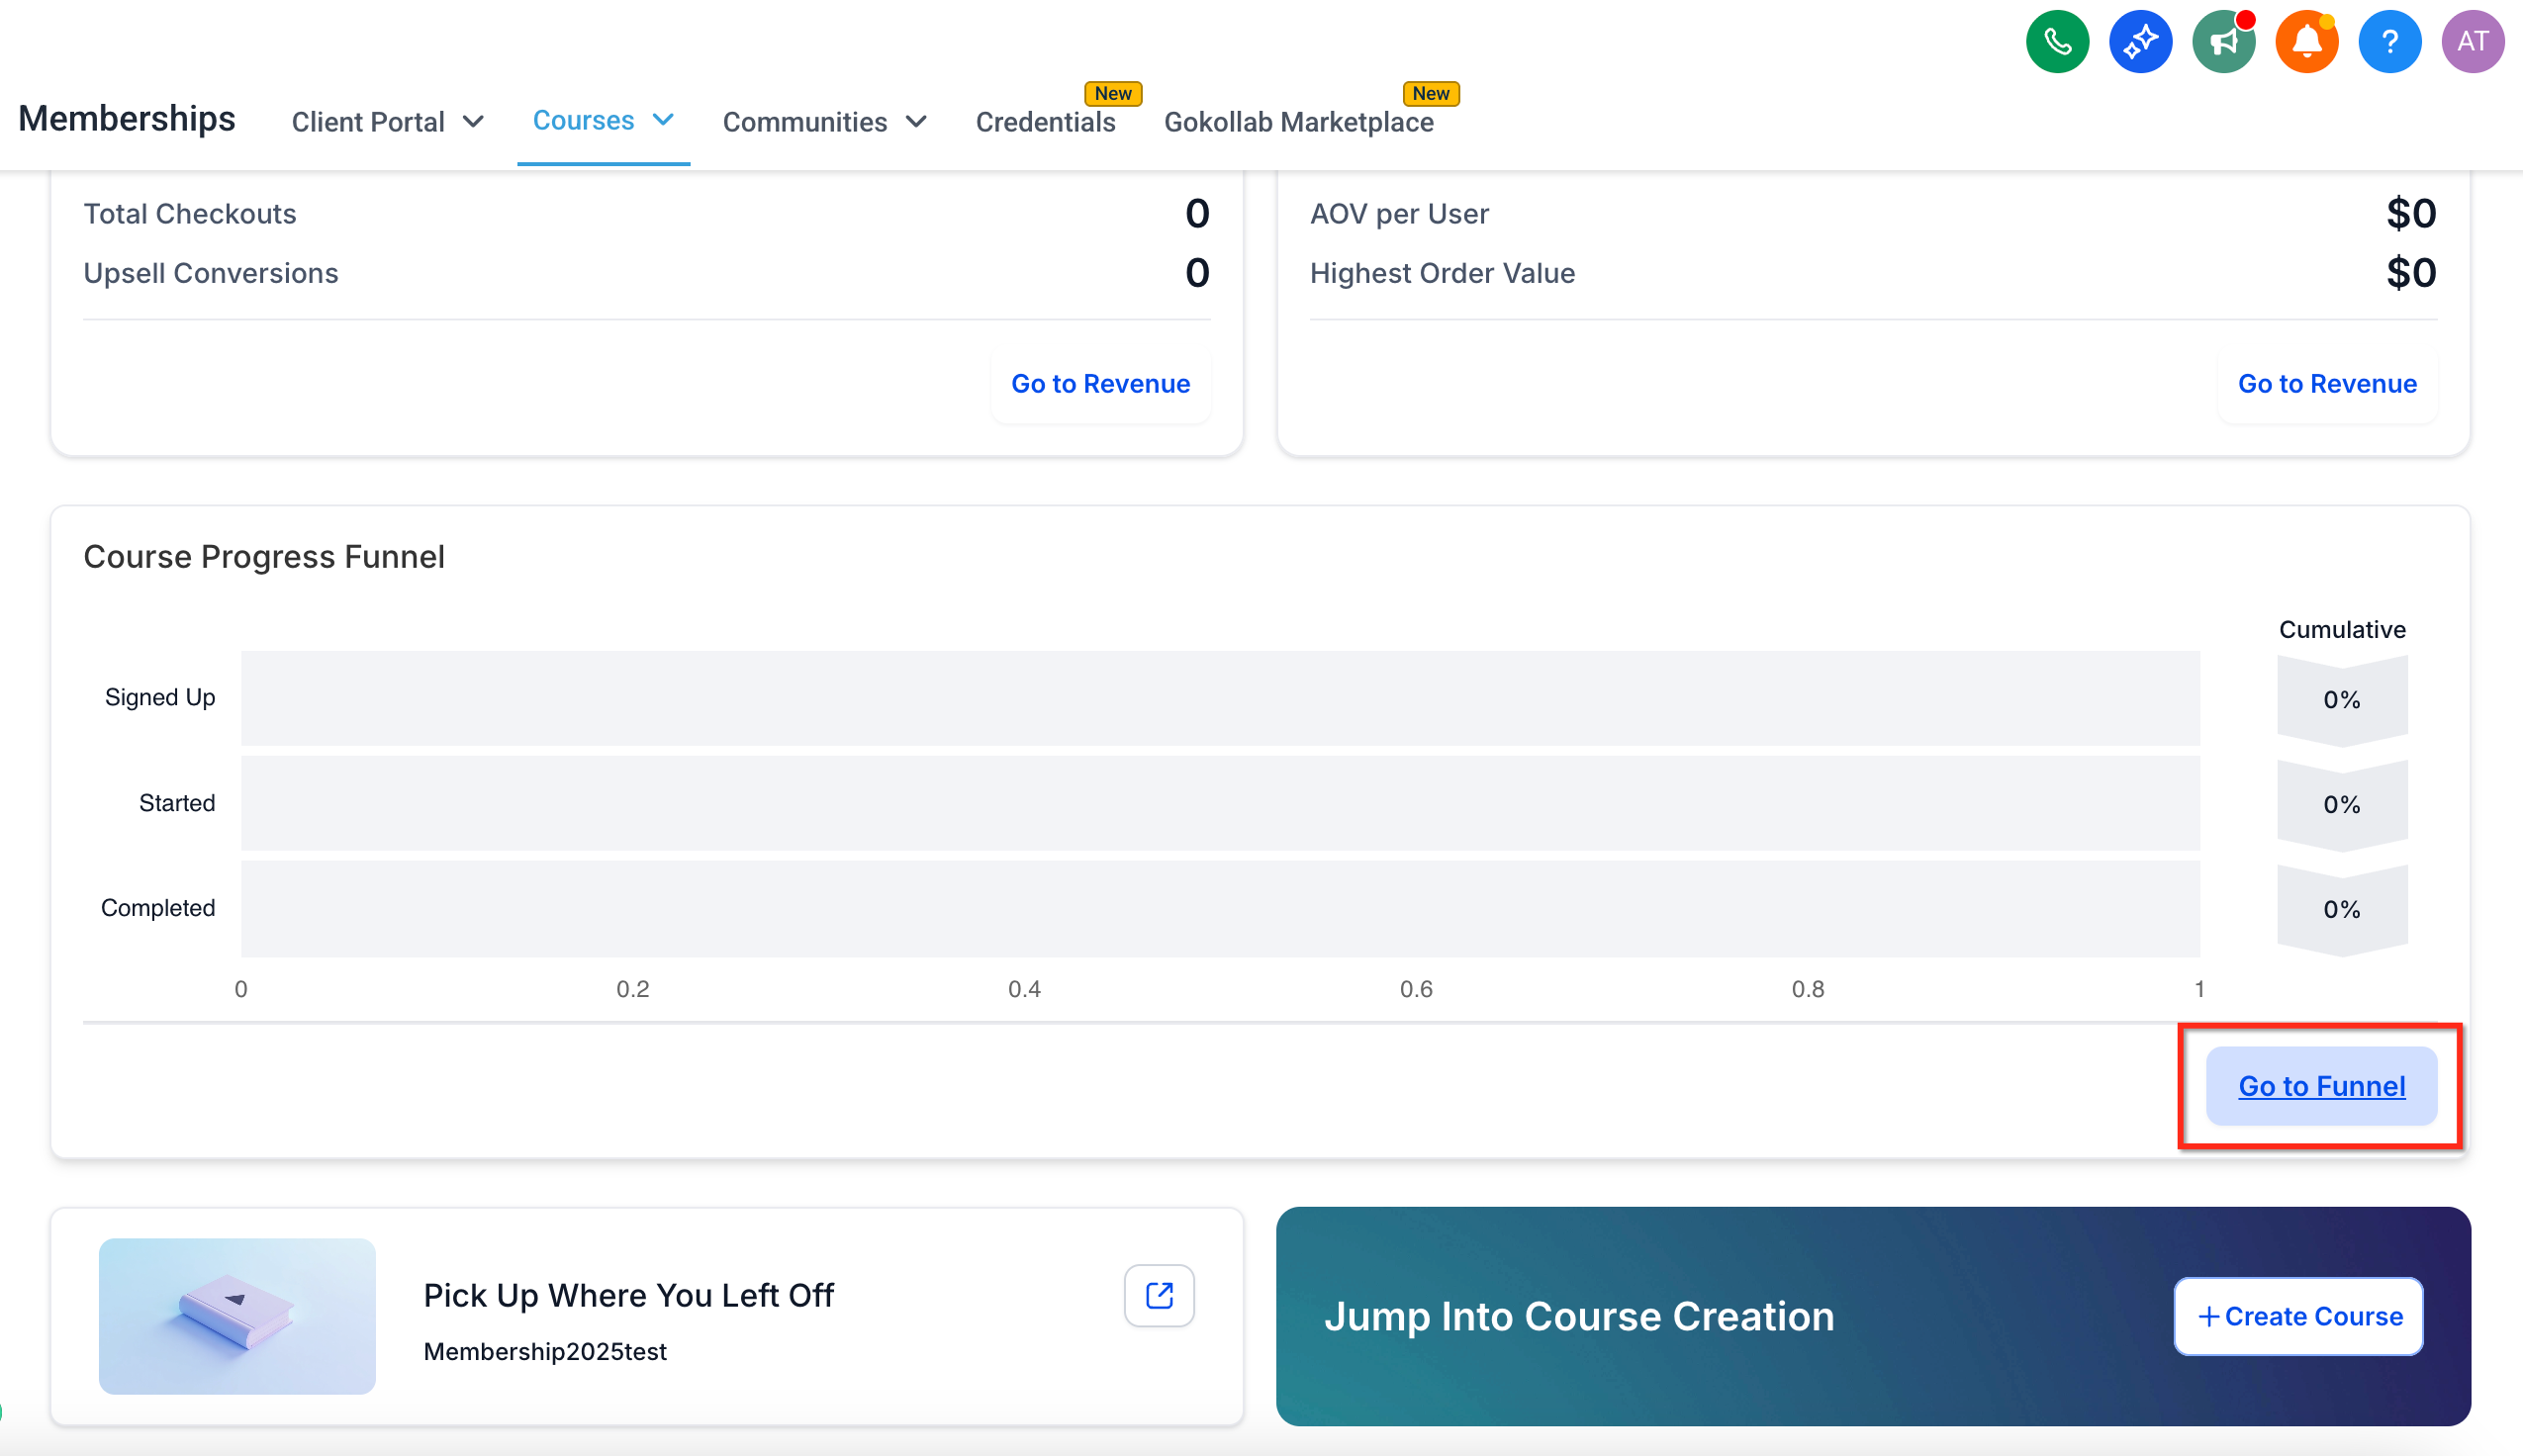
The Courses Dashboard appears as the default welcome page for anyone who creates courses in HighLevel. It replaces the older SQL powered view and presents enrollment counts, revenue totals, average order value and a visual funnel for the past 30 days. Data refreshes automatically every six hours, keeping insights current.
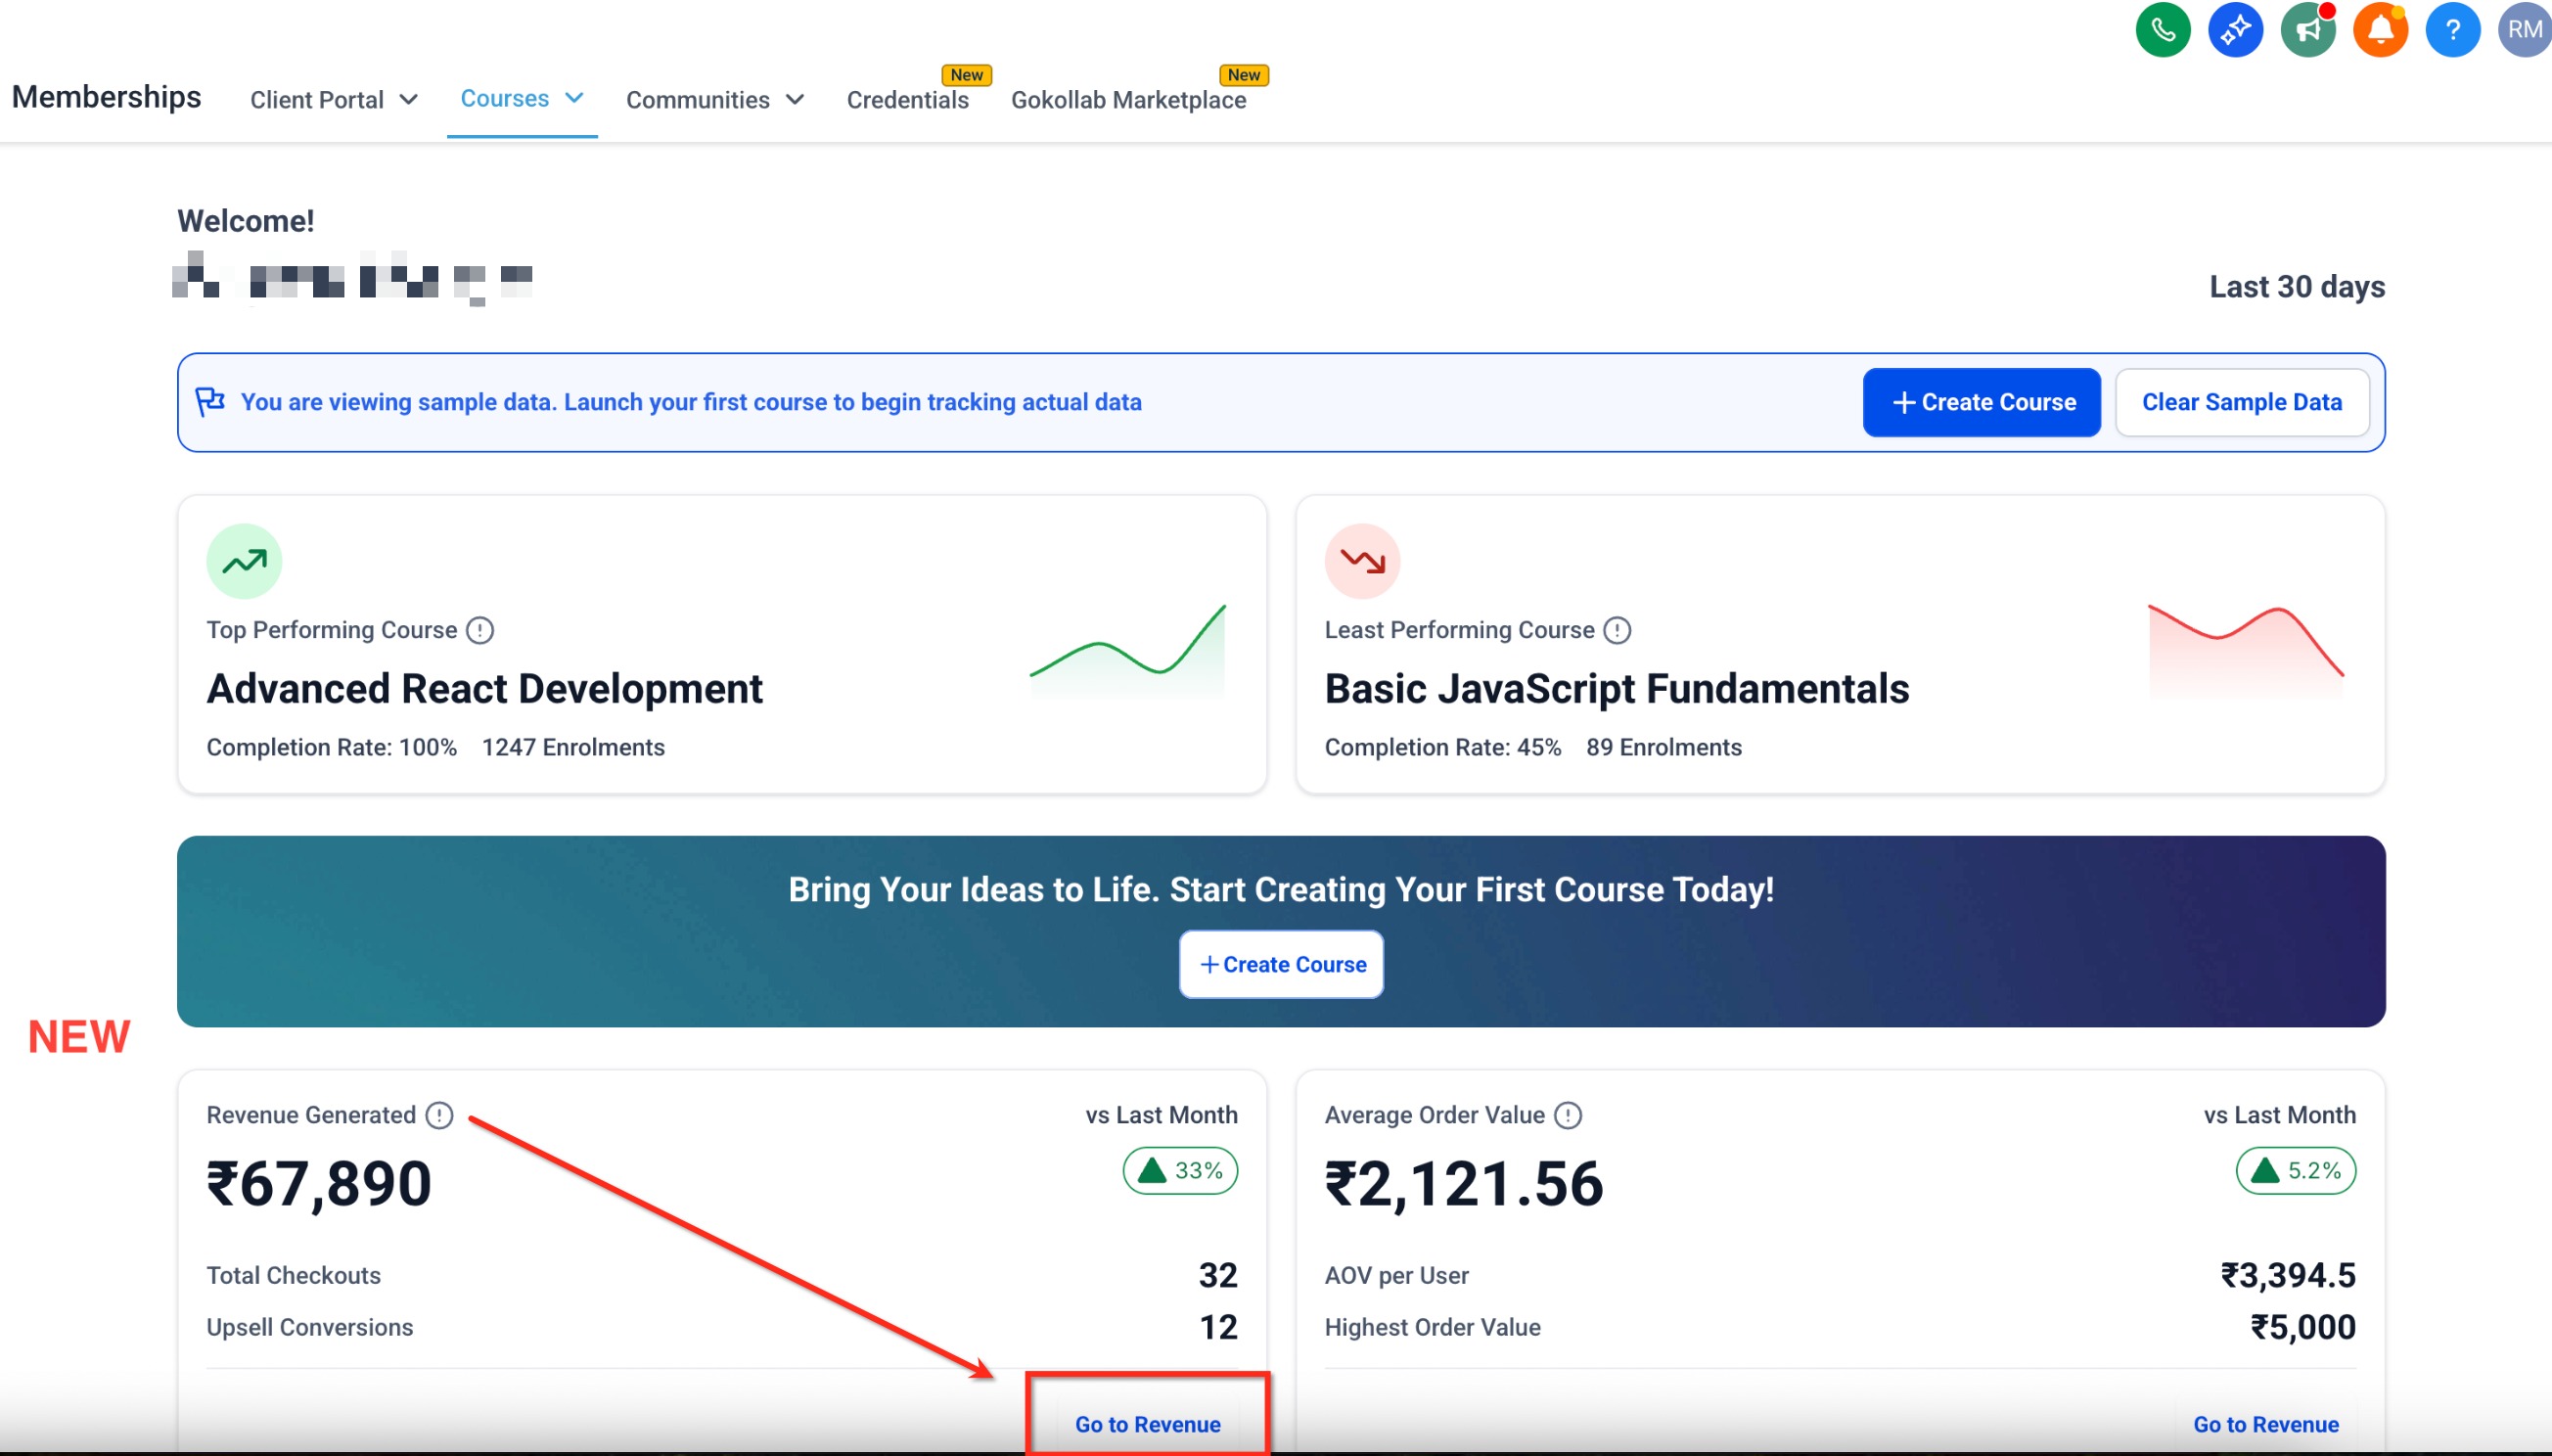
The dashboard lives under Memberships > Courses. When you open Courses, the Dashboard tab opens by default. From there you can click cards to jump to detailed revenue reports, funnel analytics, or individual course details. The interface is built with the Highrise UI system, so it works on desktops, tablets and phones.
All metric tiles are preset; you cannot rearrange them yet, but you can pin the dashboard for quick access and hide the sample data that appears for new accounts.
03How businesses use the courses dashboard
- Fitness coaching business. The coach opens the Courses Dashboard to see which workout programs have the highest completion rates and which need attention. By clicking the revenue card, they review earnings from paid programs and adjust pricing if needed.
- Software training company. The trainer checks the funnel visualization to identify where learners stop after signing up. They use the drill through link to export learner level data and improve the onboarding module.
- Language school. The school looks at the Top vs. Least Performing Course cards to decide which language course to promote next. They hide the sample data to keep the view focused on real enrollments.
04The numbers and rules that matter
- Data is updated every 6 hours.
- Shows a 30 day snapshot of enrollment, revenue and engagement metrics.
- Dashboard queries do not count toward API limits.
05Before you start
- An active HighLevel account with the Courses feature enabled.
06How to set up and use the courses dashboard in HighLevel
Access and customise the Courses Dashboard
- Sign in to HighLevel and go to Memberships > Courses.
- Select the Dashboard tab, which opens automatically for creators.
- Pin the dashboard to the sidebar for one click access.
- Optionally hide the sample data by clicking the three dot menu and choosing Remove Sample Data.
- Click the Revenue or Funnel cards to navigate to detailed analytics pages.
- Review the dashboard daily or weekly; data updates every six hours.
07What it looks like in HighLevel
08Settings that matter
- Remove Sample Data. Deletes the placeholder data shown for new creators so only real enrollment numbers appear.
- Pin dashboard to sidebar. Adds a shortcut icon to the left navigation, letting you open the dashboard with a single click.
09Things to know before you rely on it
- Dashboard data refreshes only every six hours, not in real time.
- Metric tiles are fixed; you cannot add or rearrange them at this time.
- Revenue cards show values only after at least one paid checkout is processed through HighLevel Payments or Stripe.
- Dashboard queries run server side and do not count toward API limits.
10If something goes wrong
- Revenue data does not appear on the dashboard.. Ensure a paid checkout has been completed via HighLevel Payments or Stripe; the cards populate after the first transaction.
- Dashboard does not appear after opening Courses.. All existing course data updates automatically; simply navigate to Memberships > Courses and the Dashboard tab will load as the default view.
11How it connects to the rest of HighLevel
- Build and organize your courses with the HighLevel course builder. Course builder
- Review pricing and plans to ensure your account supports paid courses. Pricing
- Start a free trial to explore the Courses Dashboard. 30 day trial