
01Who this is for
- Course creators who need a single view of learner engagement across multiple courses.
- Membership site administrators tracking completion rates to spot at risk members.
- Education marketers analyzing funnel drop offs to improve content effectiveness.
02Progress analytics, explained
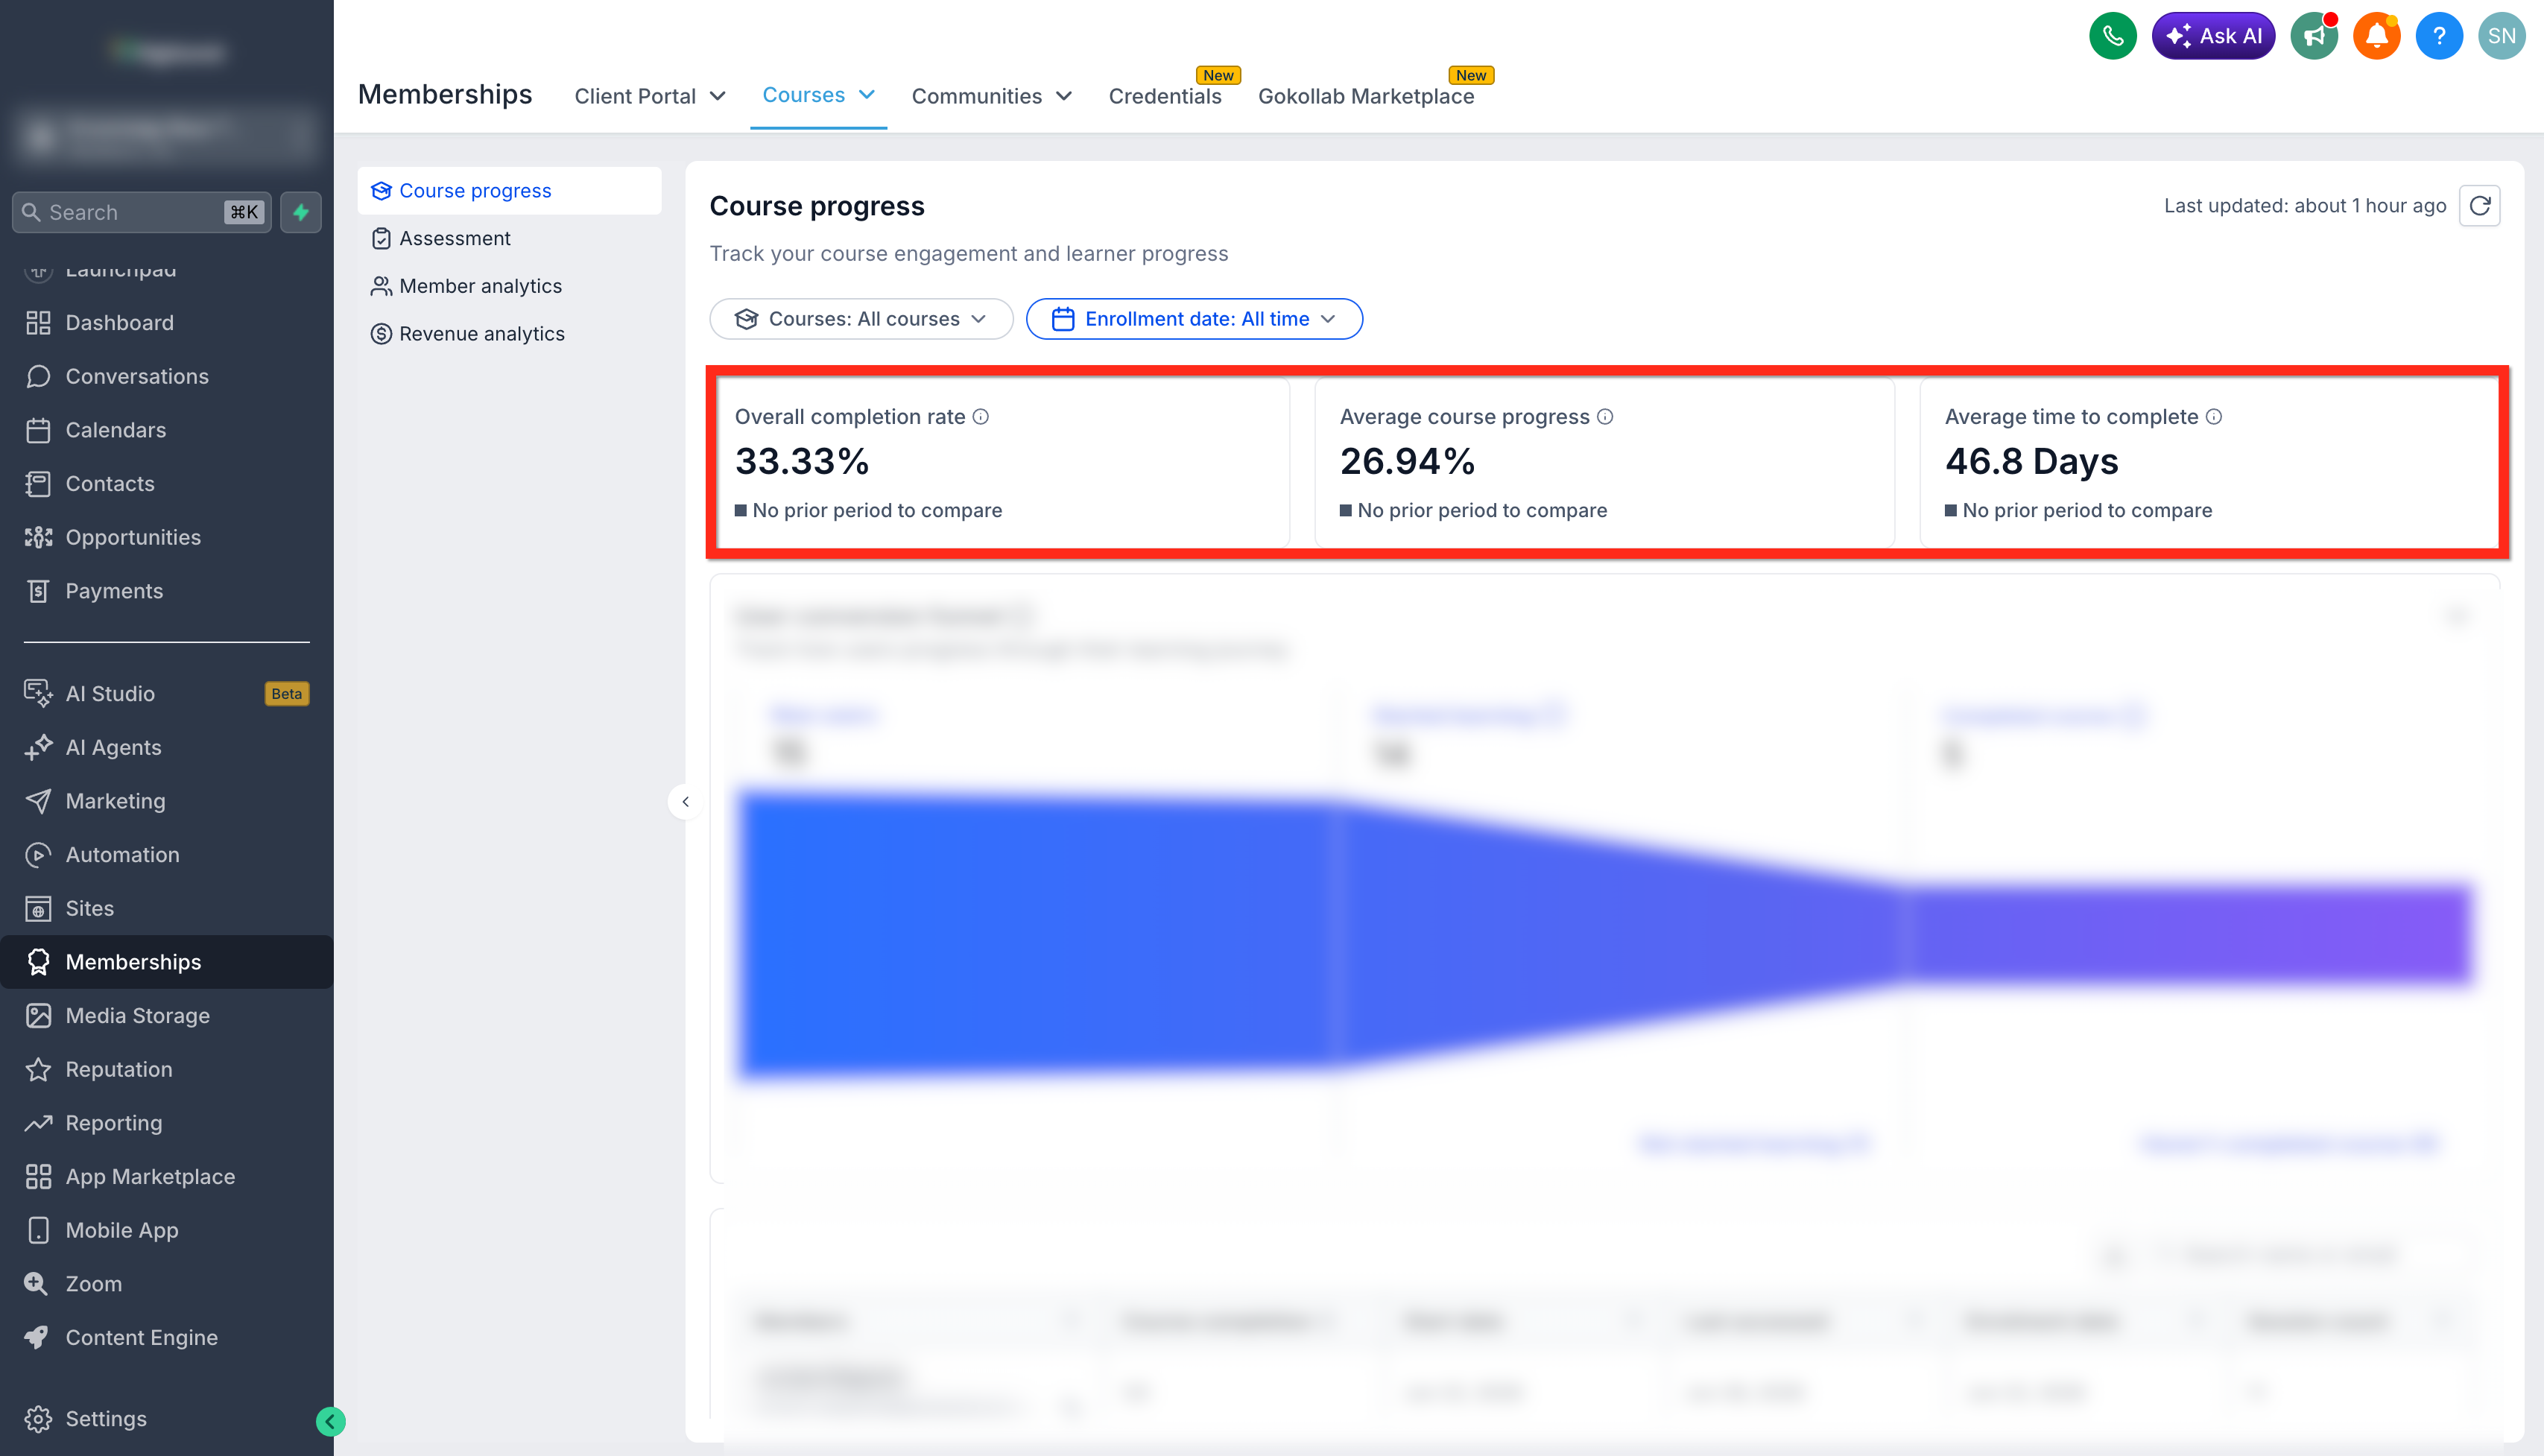
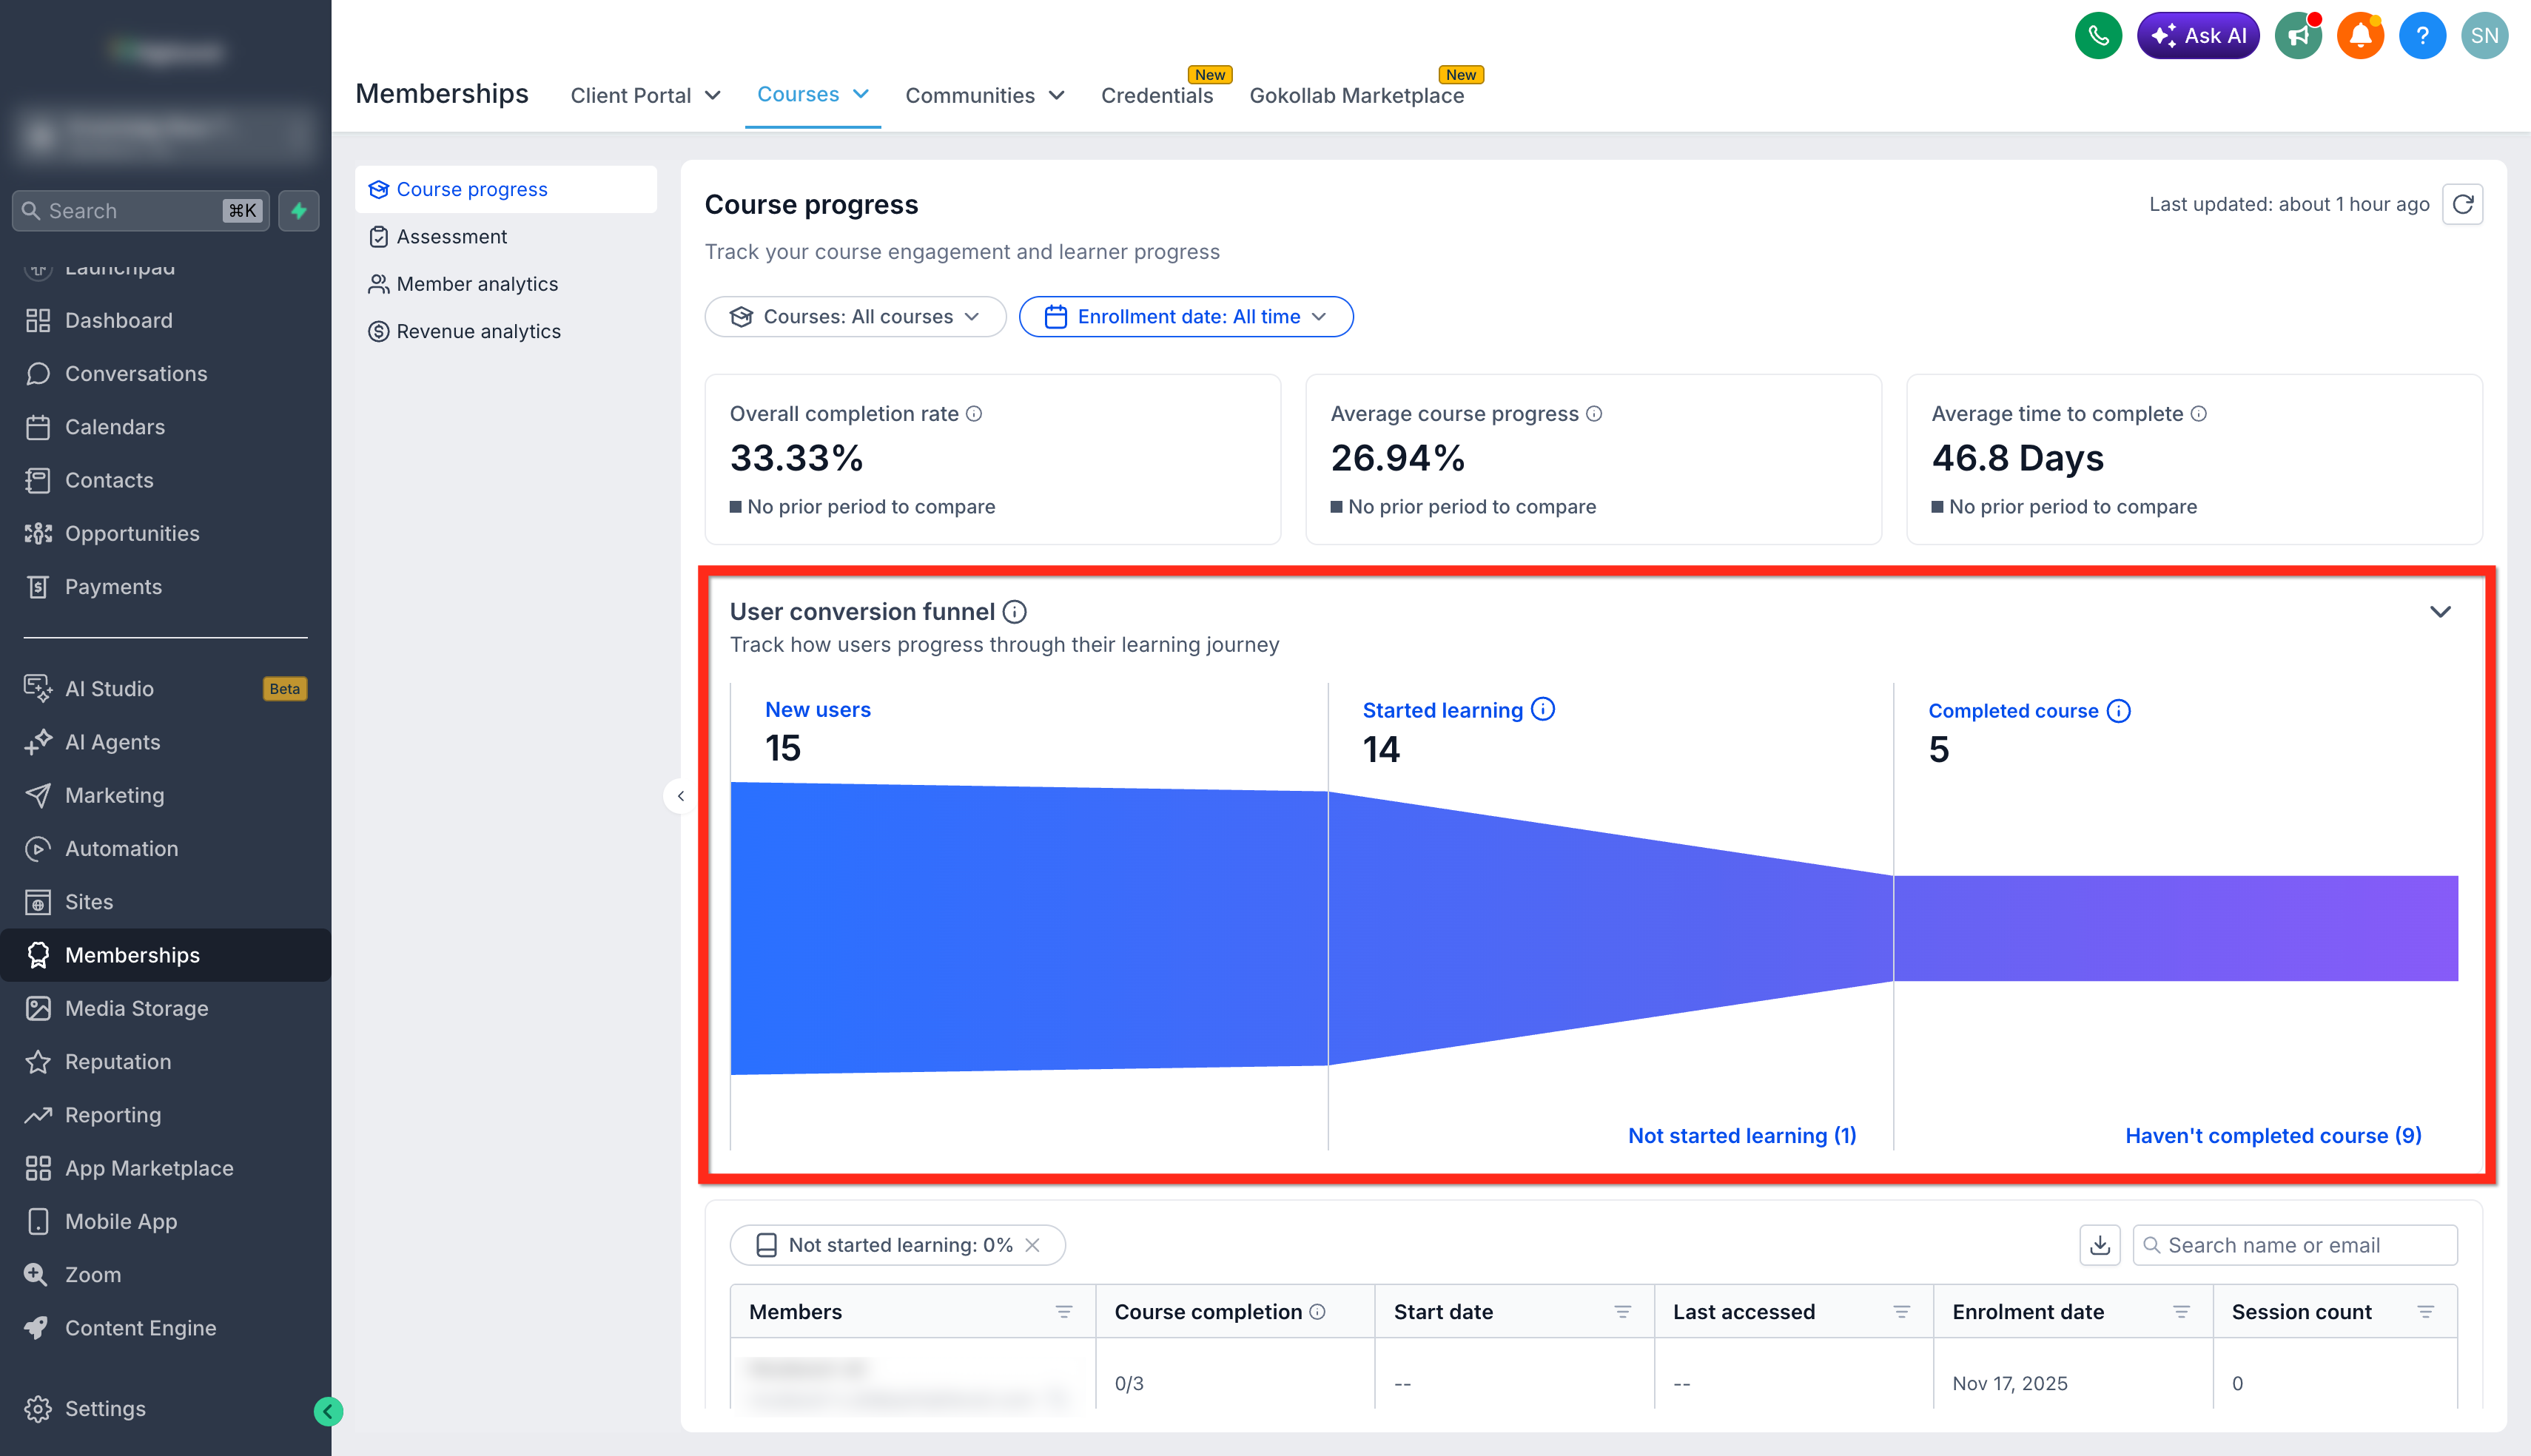
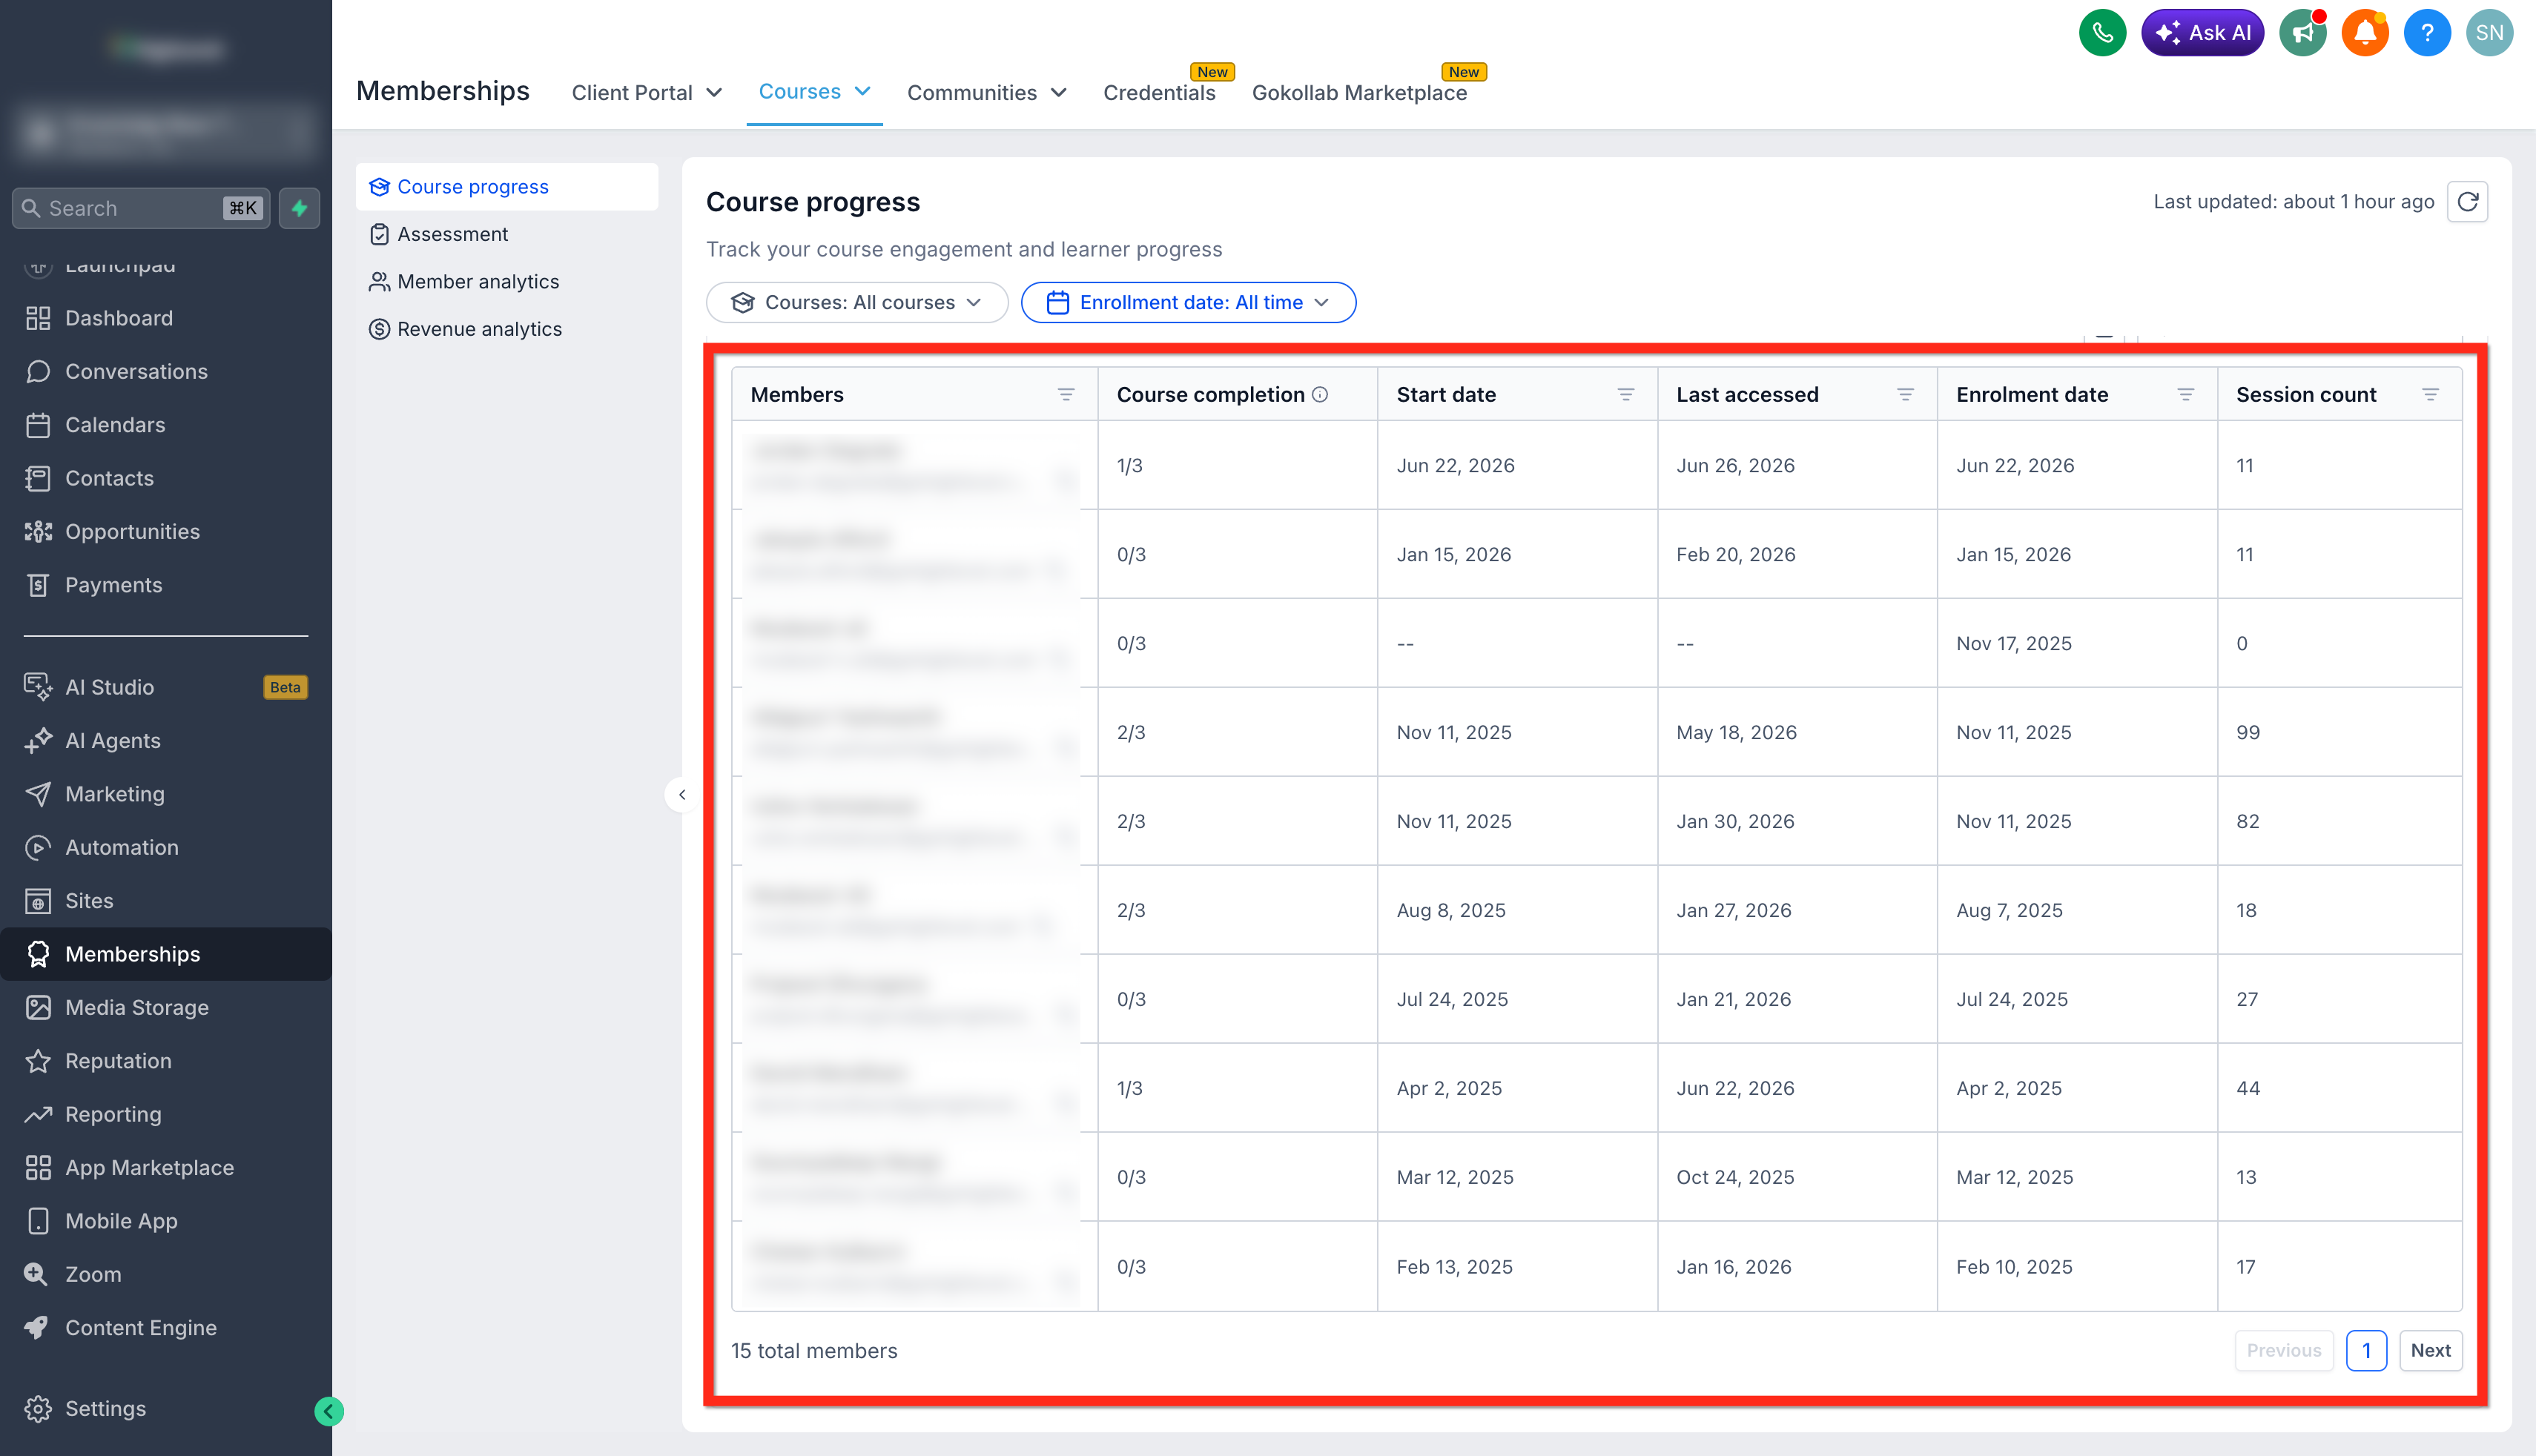
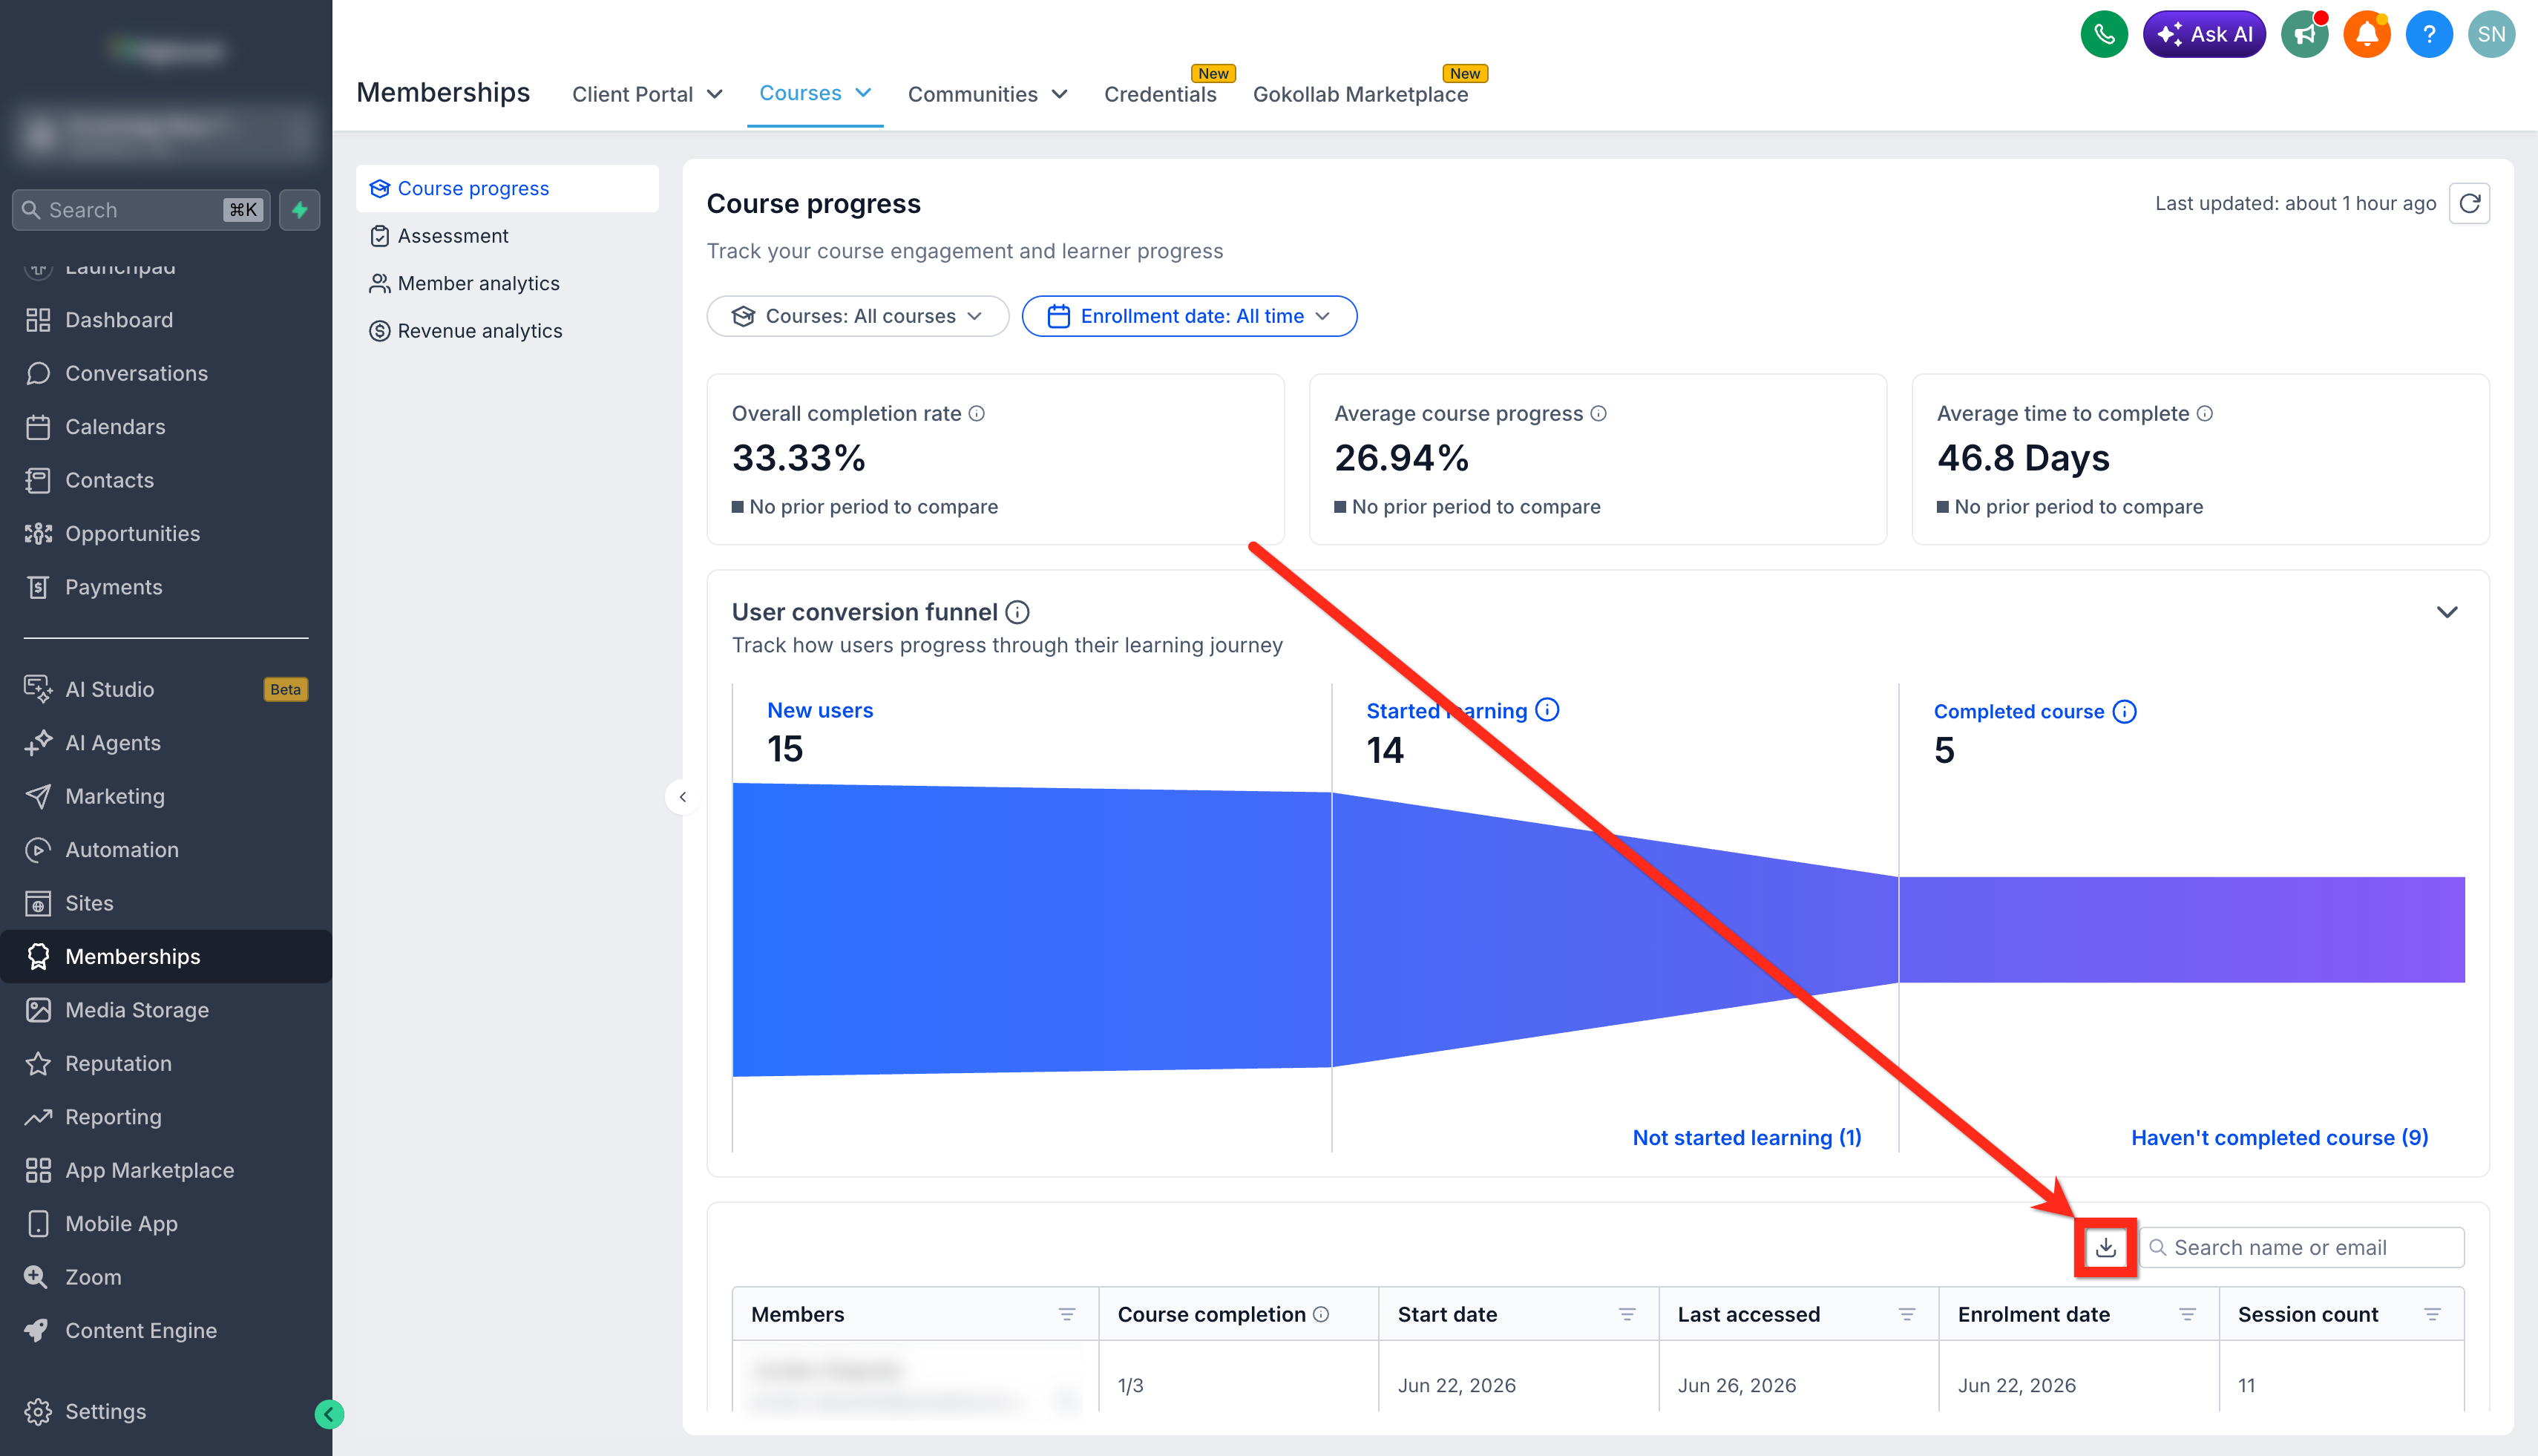
The Course Progress Analytics dashboard aggregates key engagement metrics for every learner enrolled in any course within a location. It surfaces overall completion rates, average progress percentages, average time to complete, a three stage funnel, and a detailed member progress table.
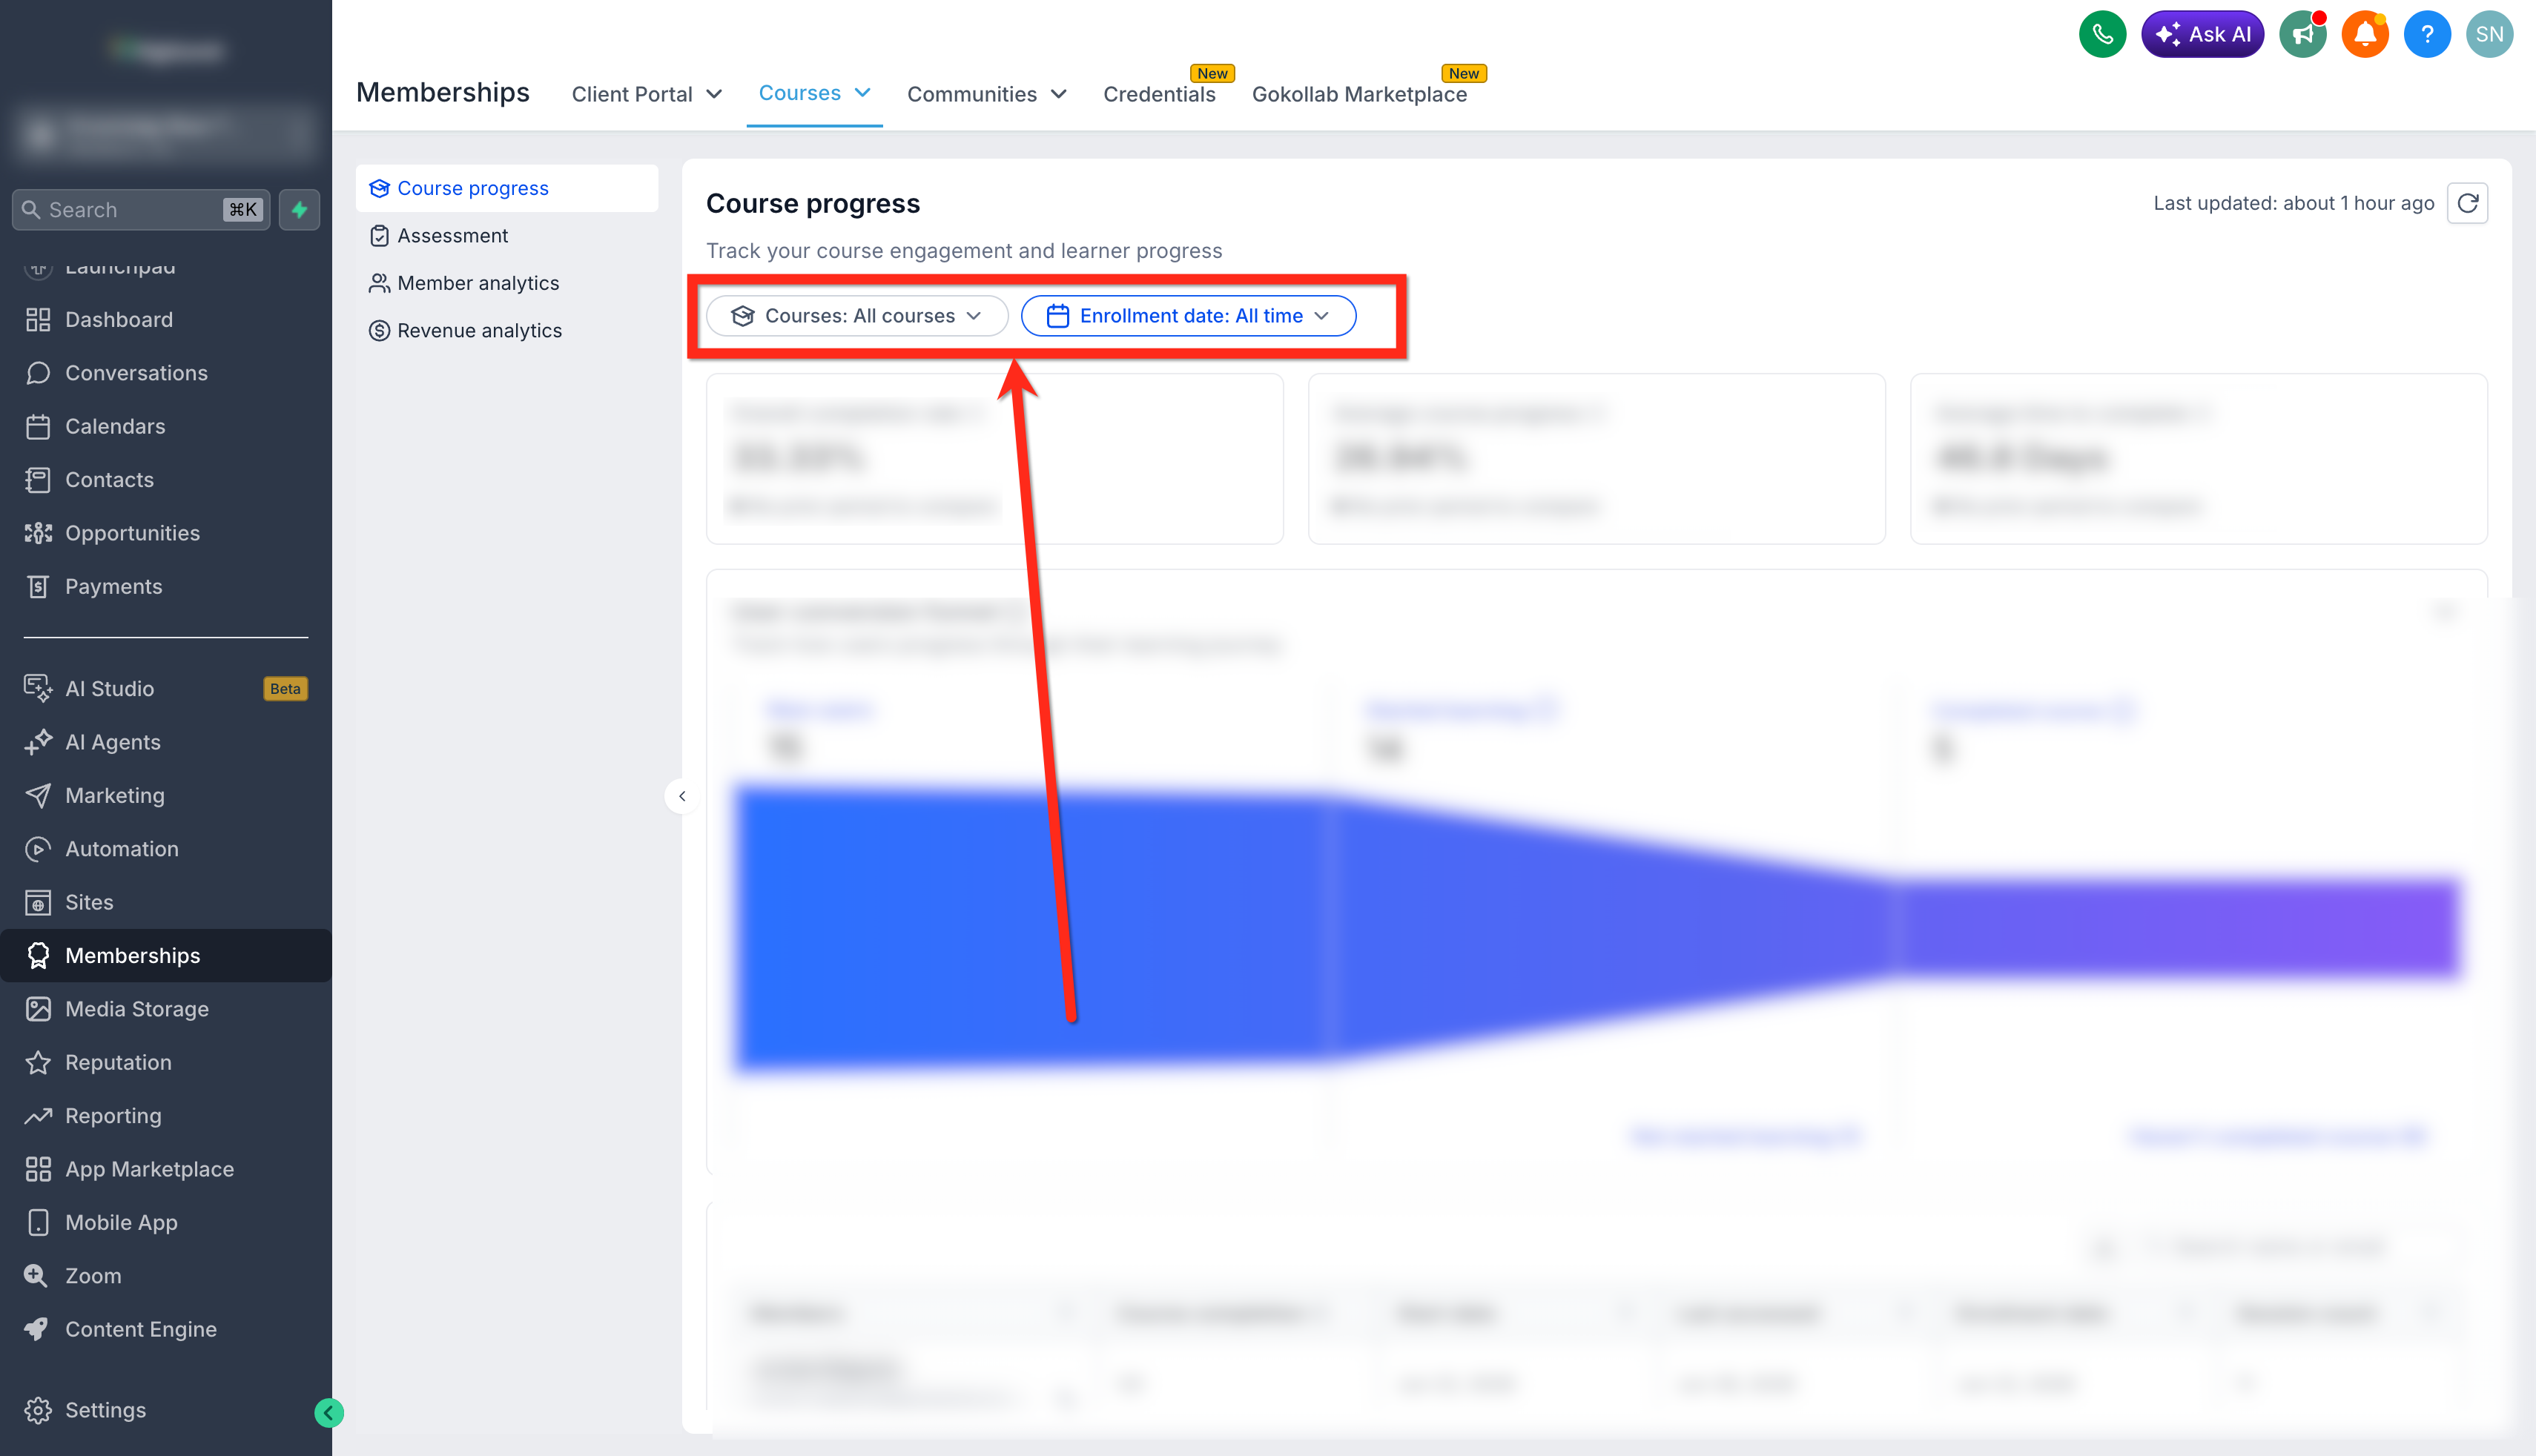
All components share the same filters for course and enrollment date, so selecting a filter right away updates every metric, chart, and table on the page. The dashboard also lets you export the current view to CSV, with small files downloading immediately and larger files sent by email.
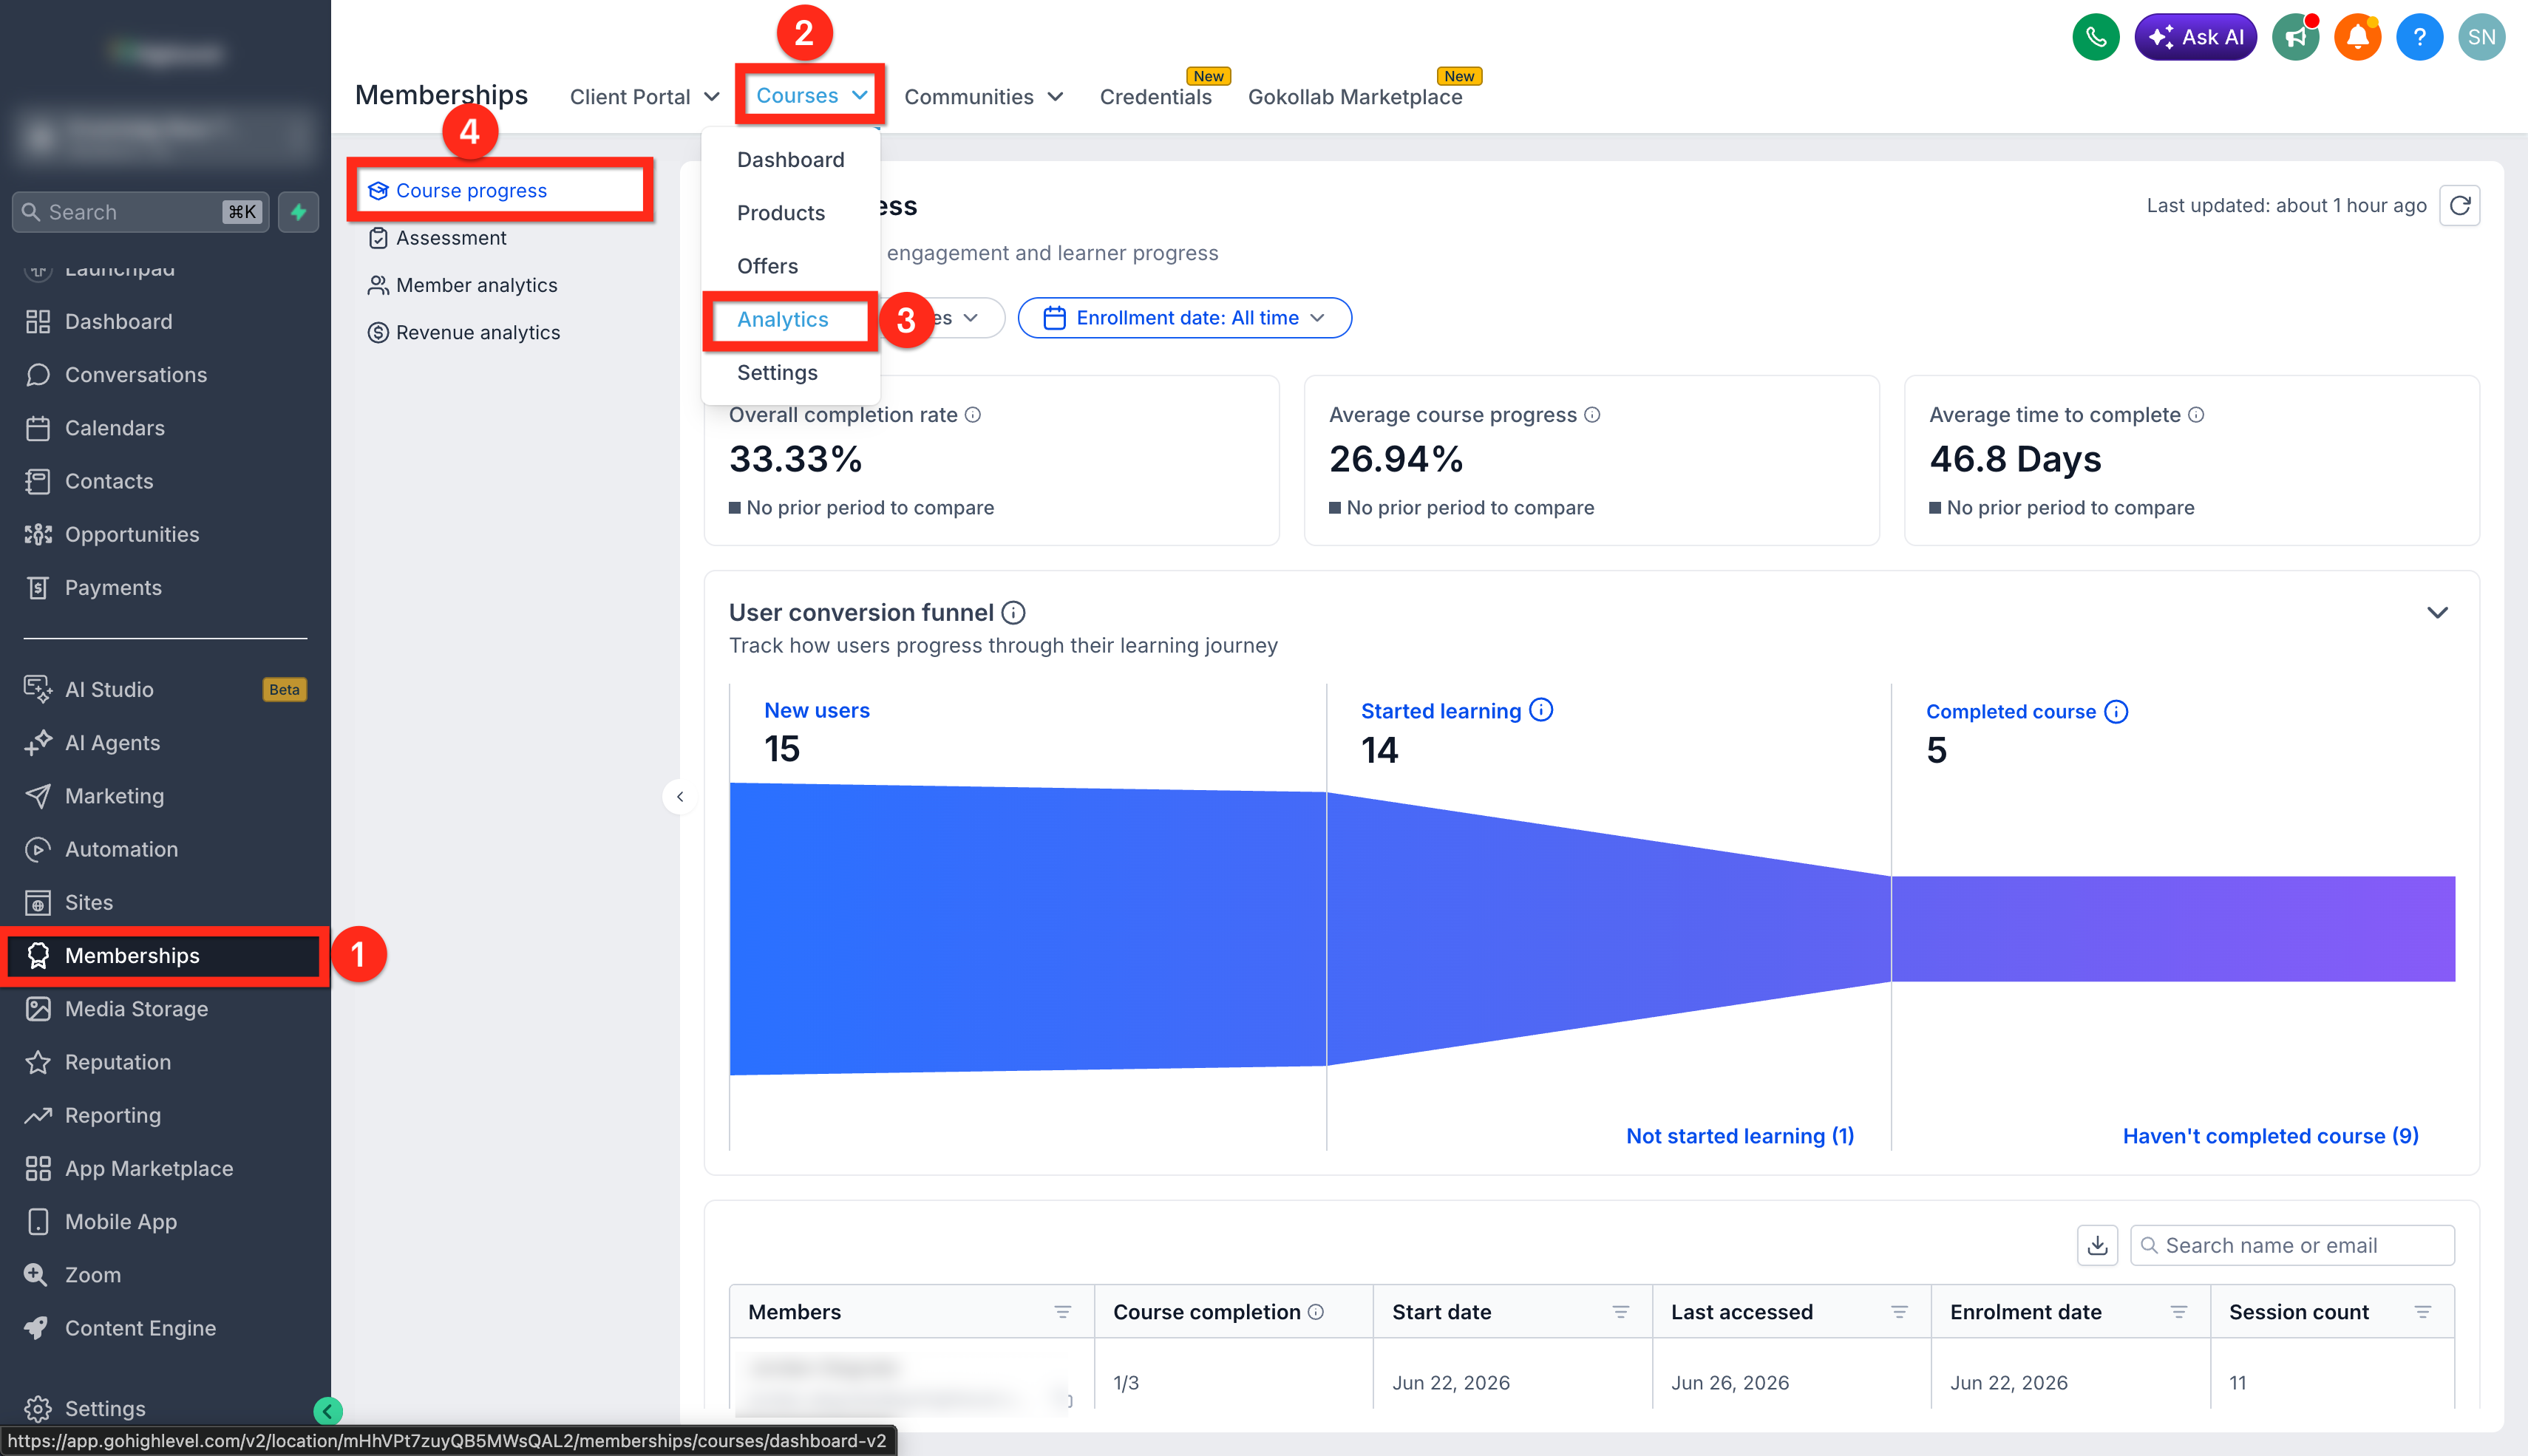
You find the dashboard by opening the HighLevel interface, then selecting Memberships > Courses > Analytics > Course progress from the main navigation.
03How businesses use progress analytics
- Online fitness coaching business. The coach opens the Course Progress Analytics dashboard, filters by the specific workout program, and reviews completion percentages to see which members are finishing the routine. They also export the data to share progress reports with clients.
- SaaS product training team. The team selects the onboarding course in the analytics dashboard, applies an enrollment date range to compare recent sign ups with earlier cohorts, and examines the funnel to identify where users stop watching tutorials.
- Language tutoring platform. Tutors filter the dashboard by the Spanish language course, inspect the member progress table for learners with low session counts, and download a CSV to schedule targeted follow up sessions.
04The numbers and rules that matter
- Approximately 43% faster page loads than previous analytics implementations.
- Nearly 90% less data downloaded compared to prior versions.
- CSV export: Smaller exports download fast; larger exports with 500 or more rows are emailed with a secure 24 hour download link.
05How to set up and use progress analytics in HighLevel
Access Course Progress Analytics
- From the HighLevel dashboard, click the Memberships menu.
- Choose Courses, then Analytics, and finally Course progress.
- Apply the course and enrollment date filters, then review the updated metrics, funnel and member table.
06What it looks like in HighLevel
07Things to know before you rely on it
- Page loads are about 43% faster than previous analytics implementations.
- Data download size is reduced by roughly 90%, helping performance on slower connections.
- CSV exports with 500 or more rows are processed on the server and delivered by email with a secure link that expires after 24 hours.
- The dashboard works with all current and future courses without additional configuration.
08How it connects to the rest of HighLevel
- Build and organize your courses before analyzing them. Course builder
- Generate magic links for password free access to your membership portal. Magic links
- Explore pricing options and start a trial if you need access to analytics features. Pricing
Michael's take

Progress analytics is valuable because it provides clear insights from enrollment data.
Don’t forget to apply the same filters across the dashboard or you’ll compare mismatched data.