
01Who this is for
- Founders who rely on AI chatbots for customer support can see exactly why a response is generated and fix issues before launch.
- Small business owners building lead qualification agents benefit from real time latency badges that reveal slow steps.
- Product managers overseeing AI driven workflows gain confidence by inspecting model metrics and cost estimates during testing.
02Message execution timeline and chat emulator, explained
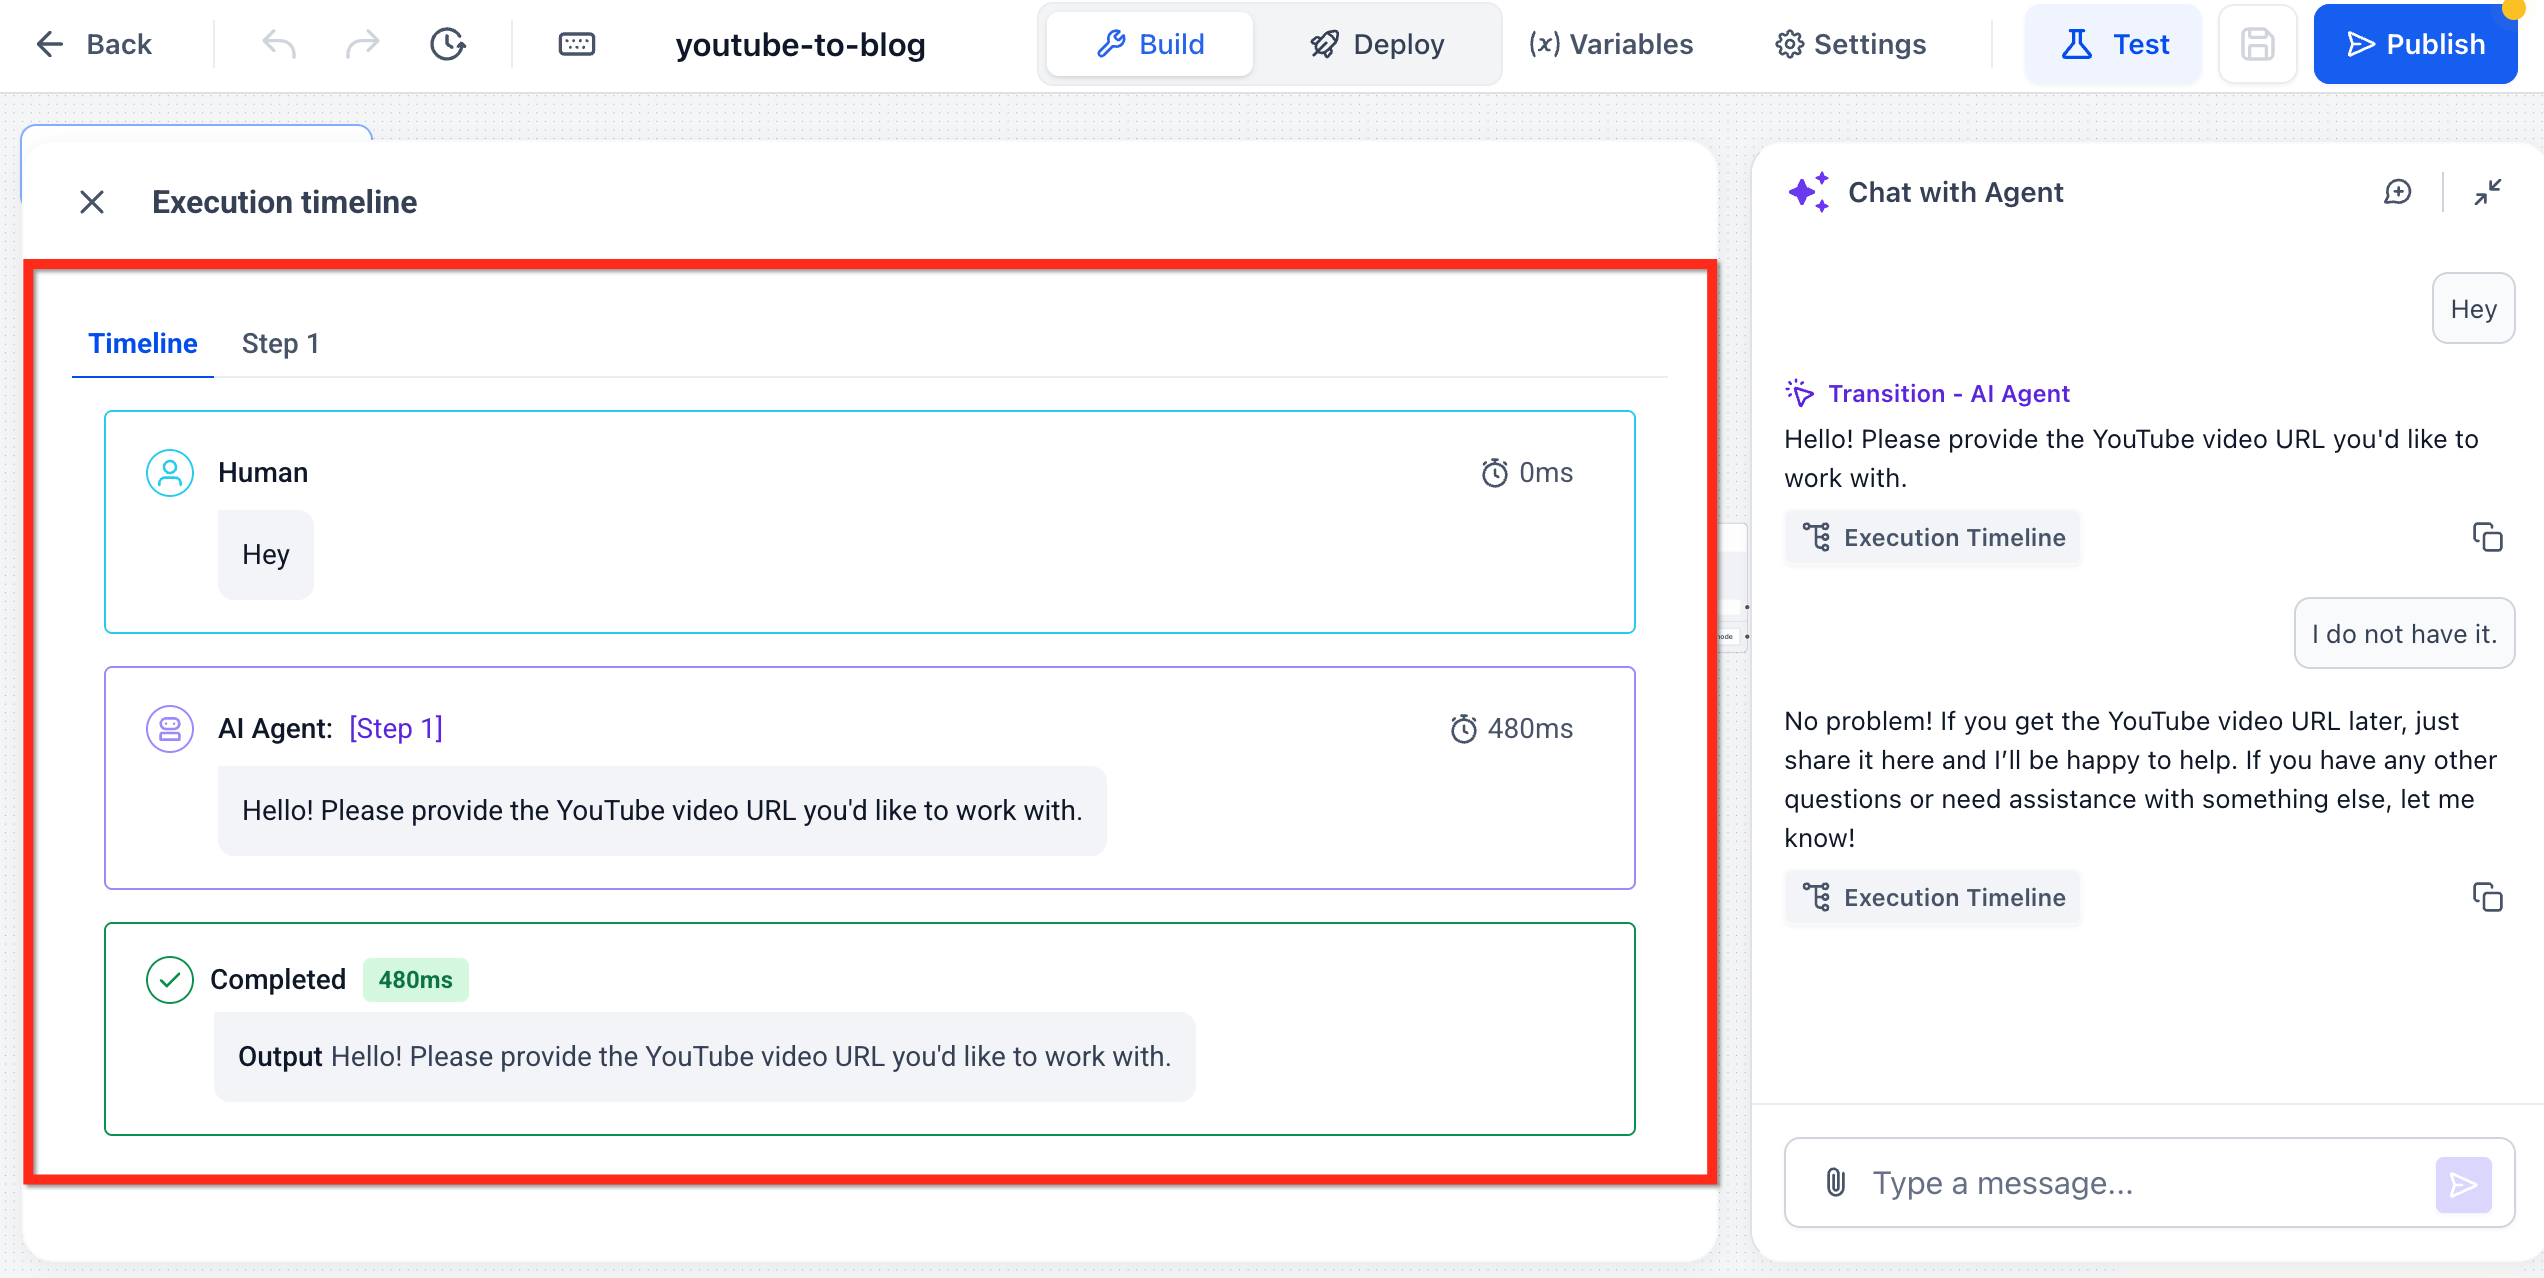
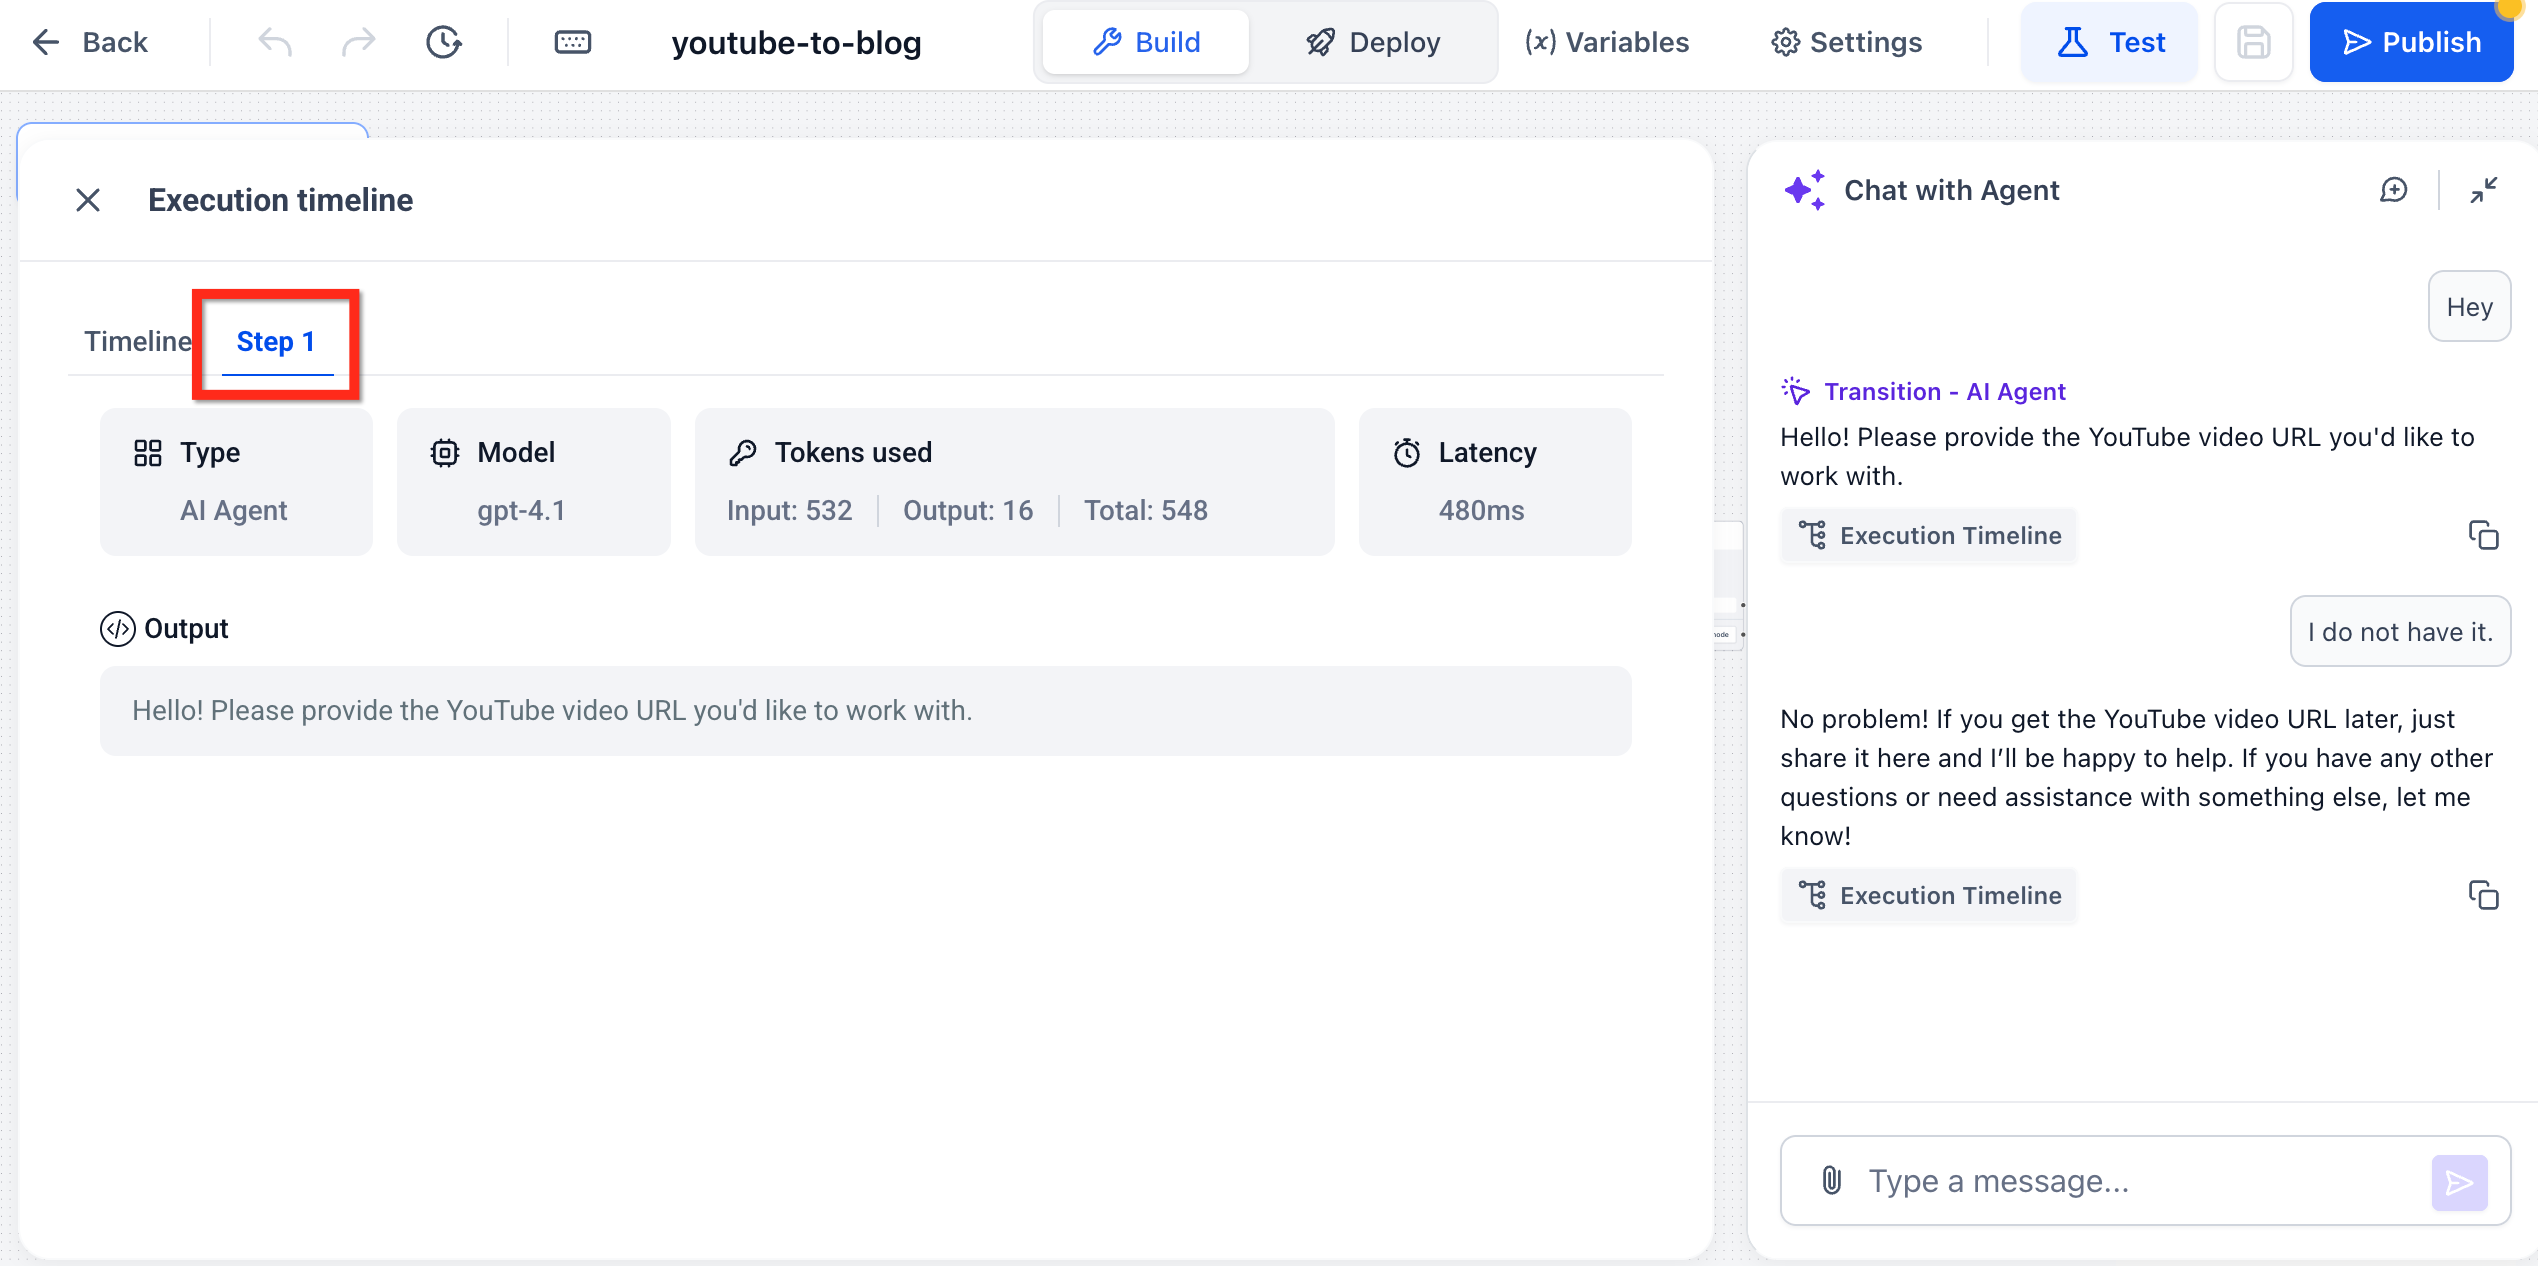
The Message Execution Timeline records each event the agent performs, including node transitions, tool calls, model executions, token counts, and execution time. It displays this data in event cards next to the chat window, with colored latency badges to flag slow steps. A Performance Metrics panel under each message shows model version, temperature, token usage and cost estimates.
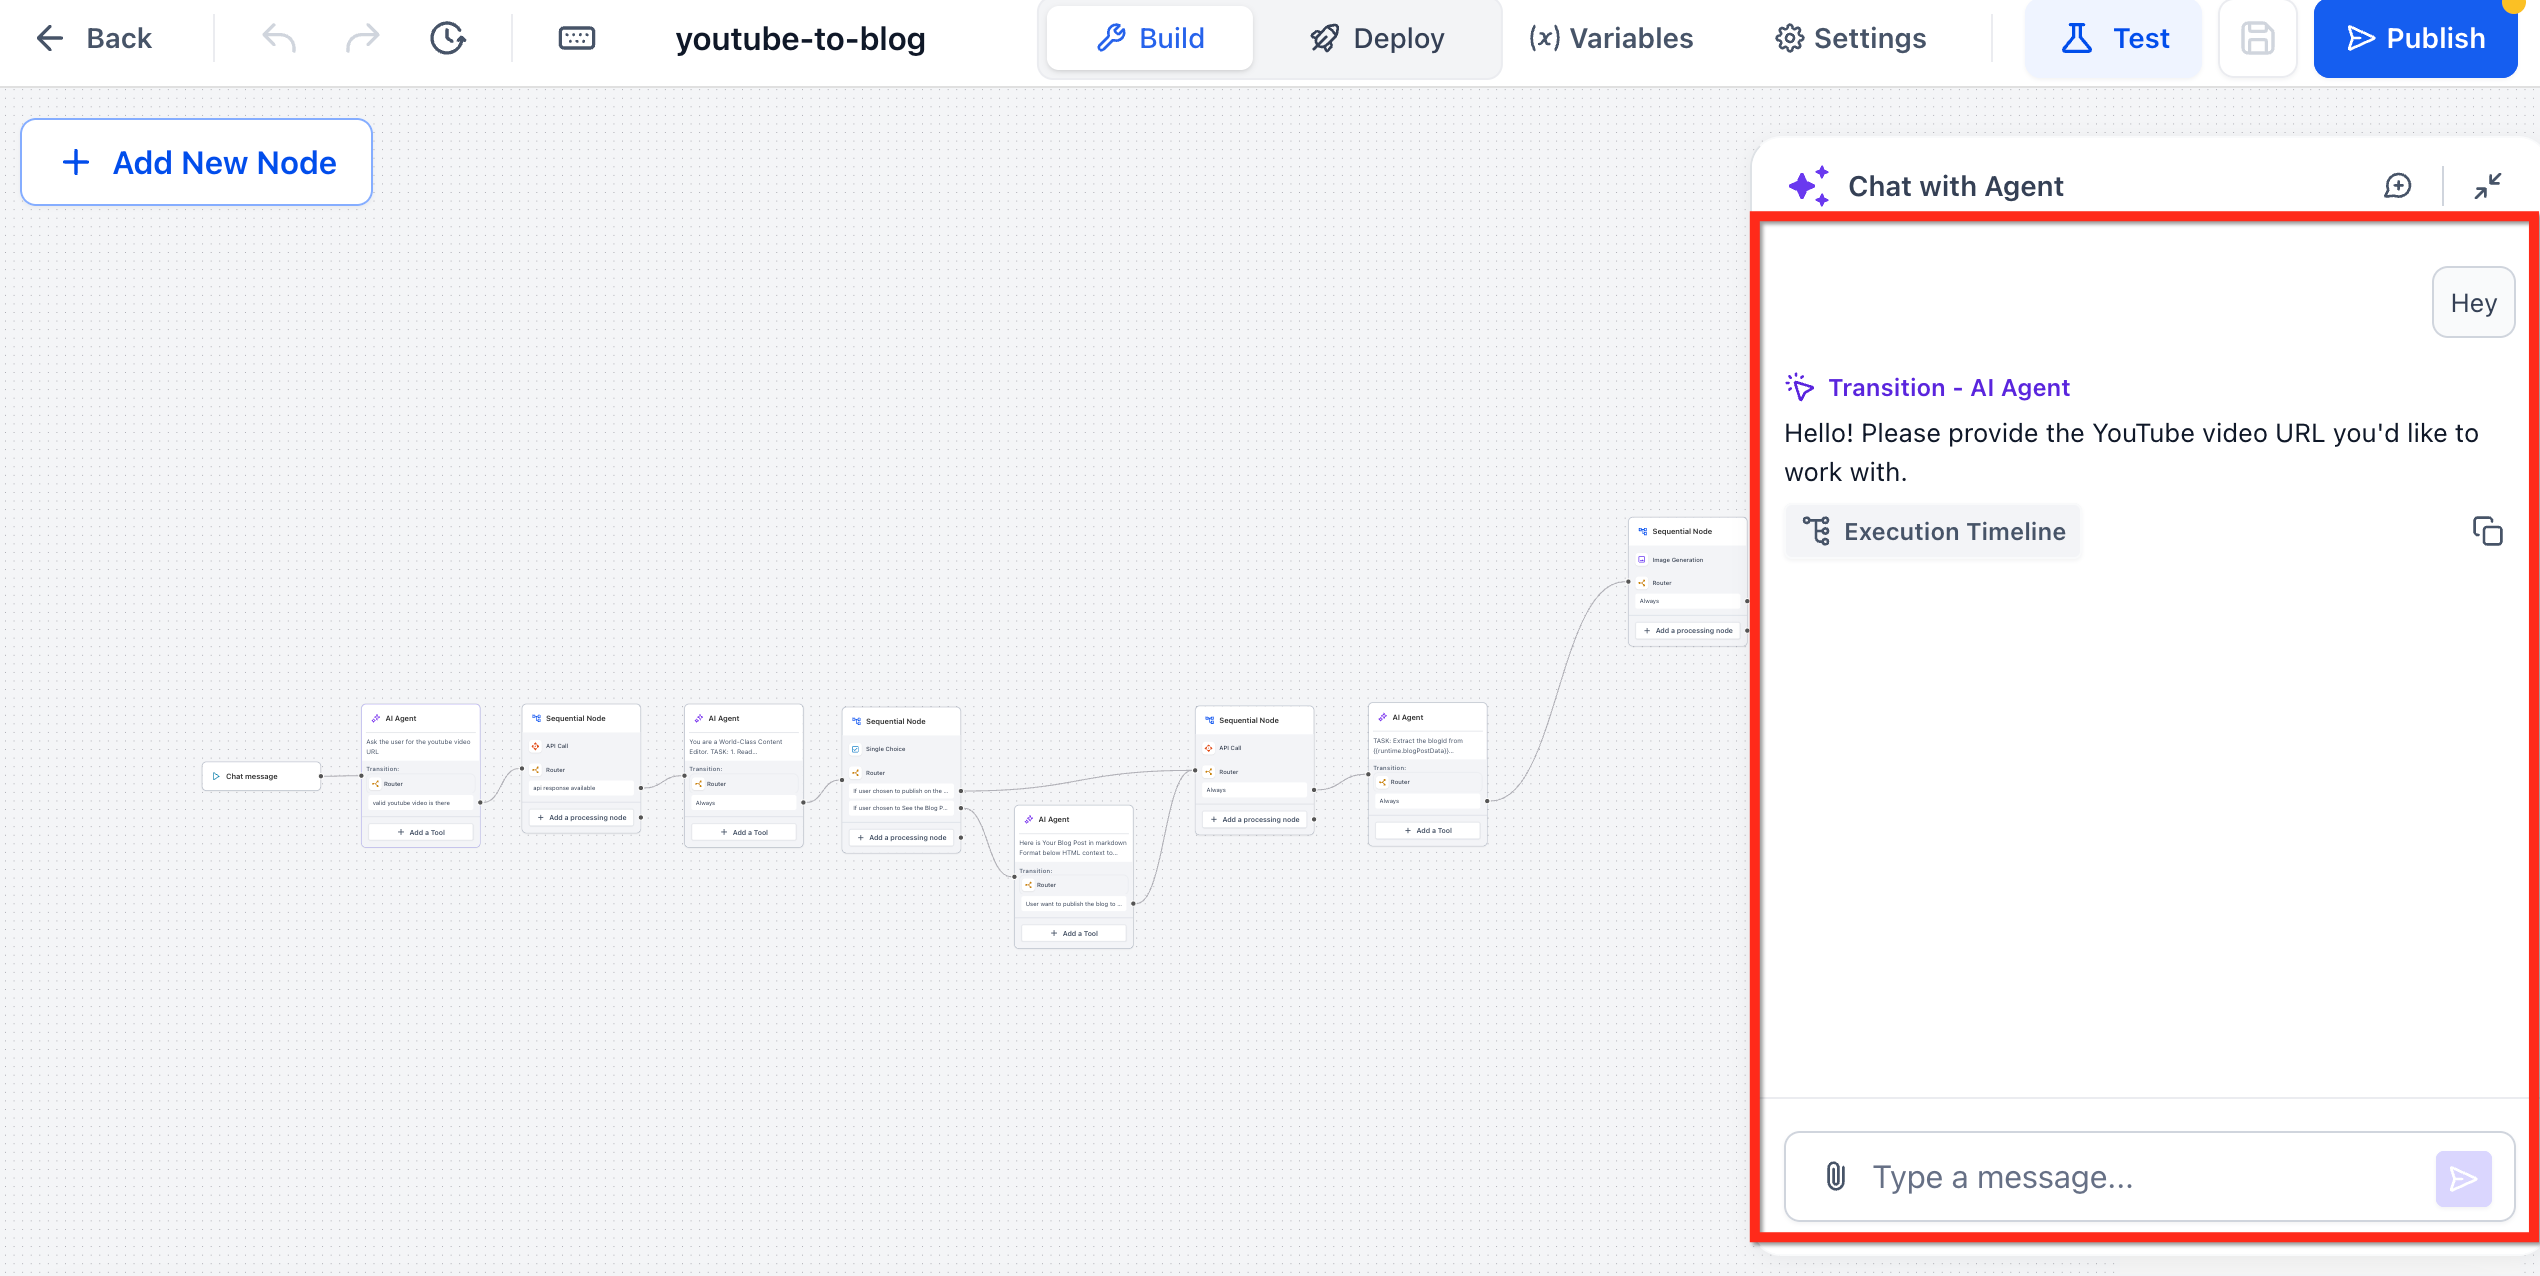
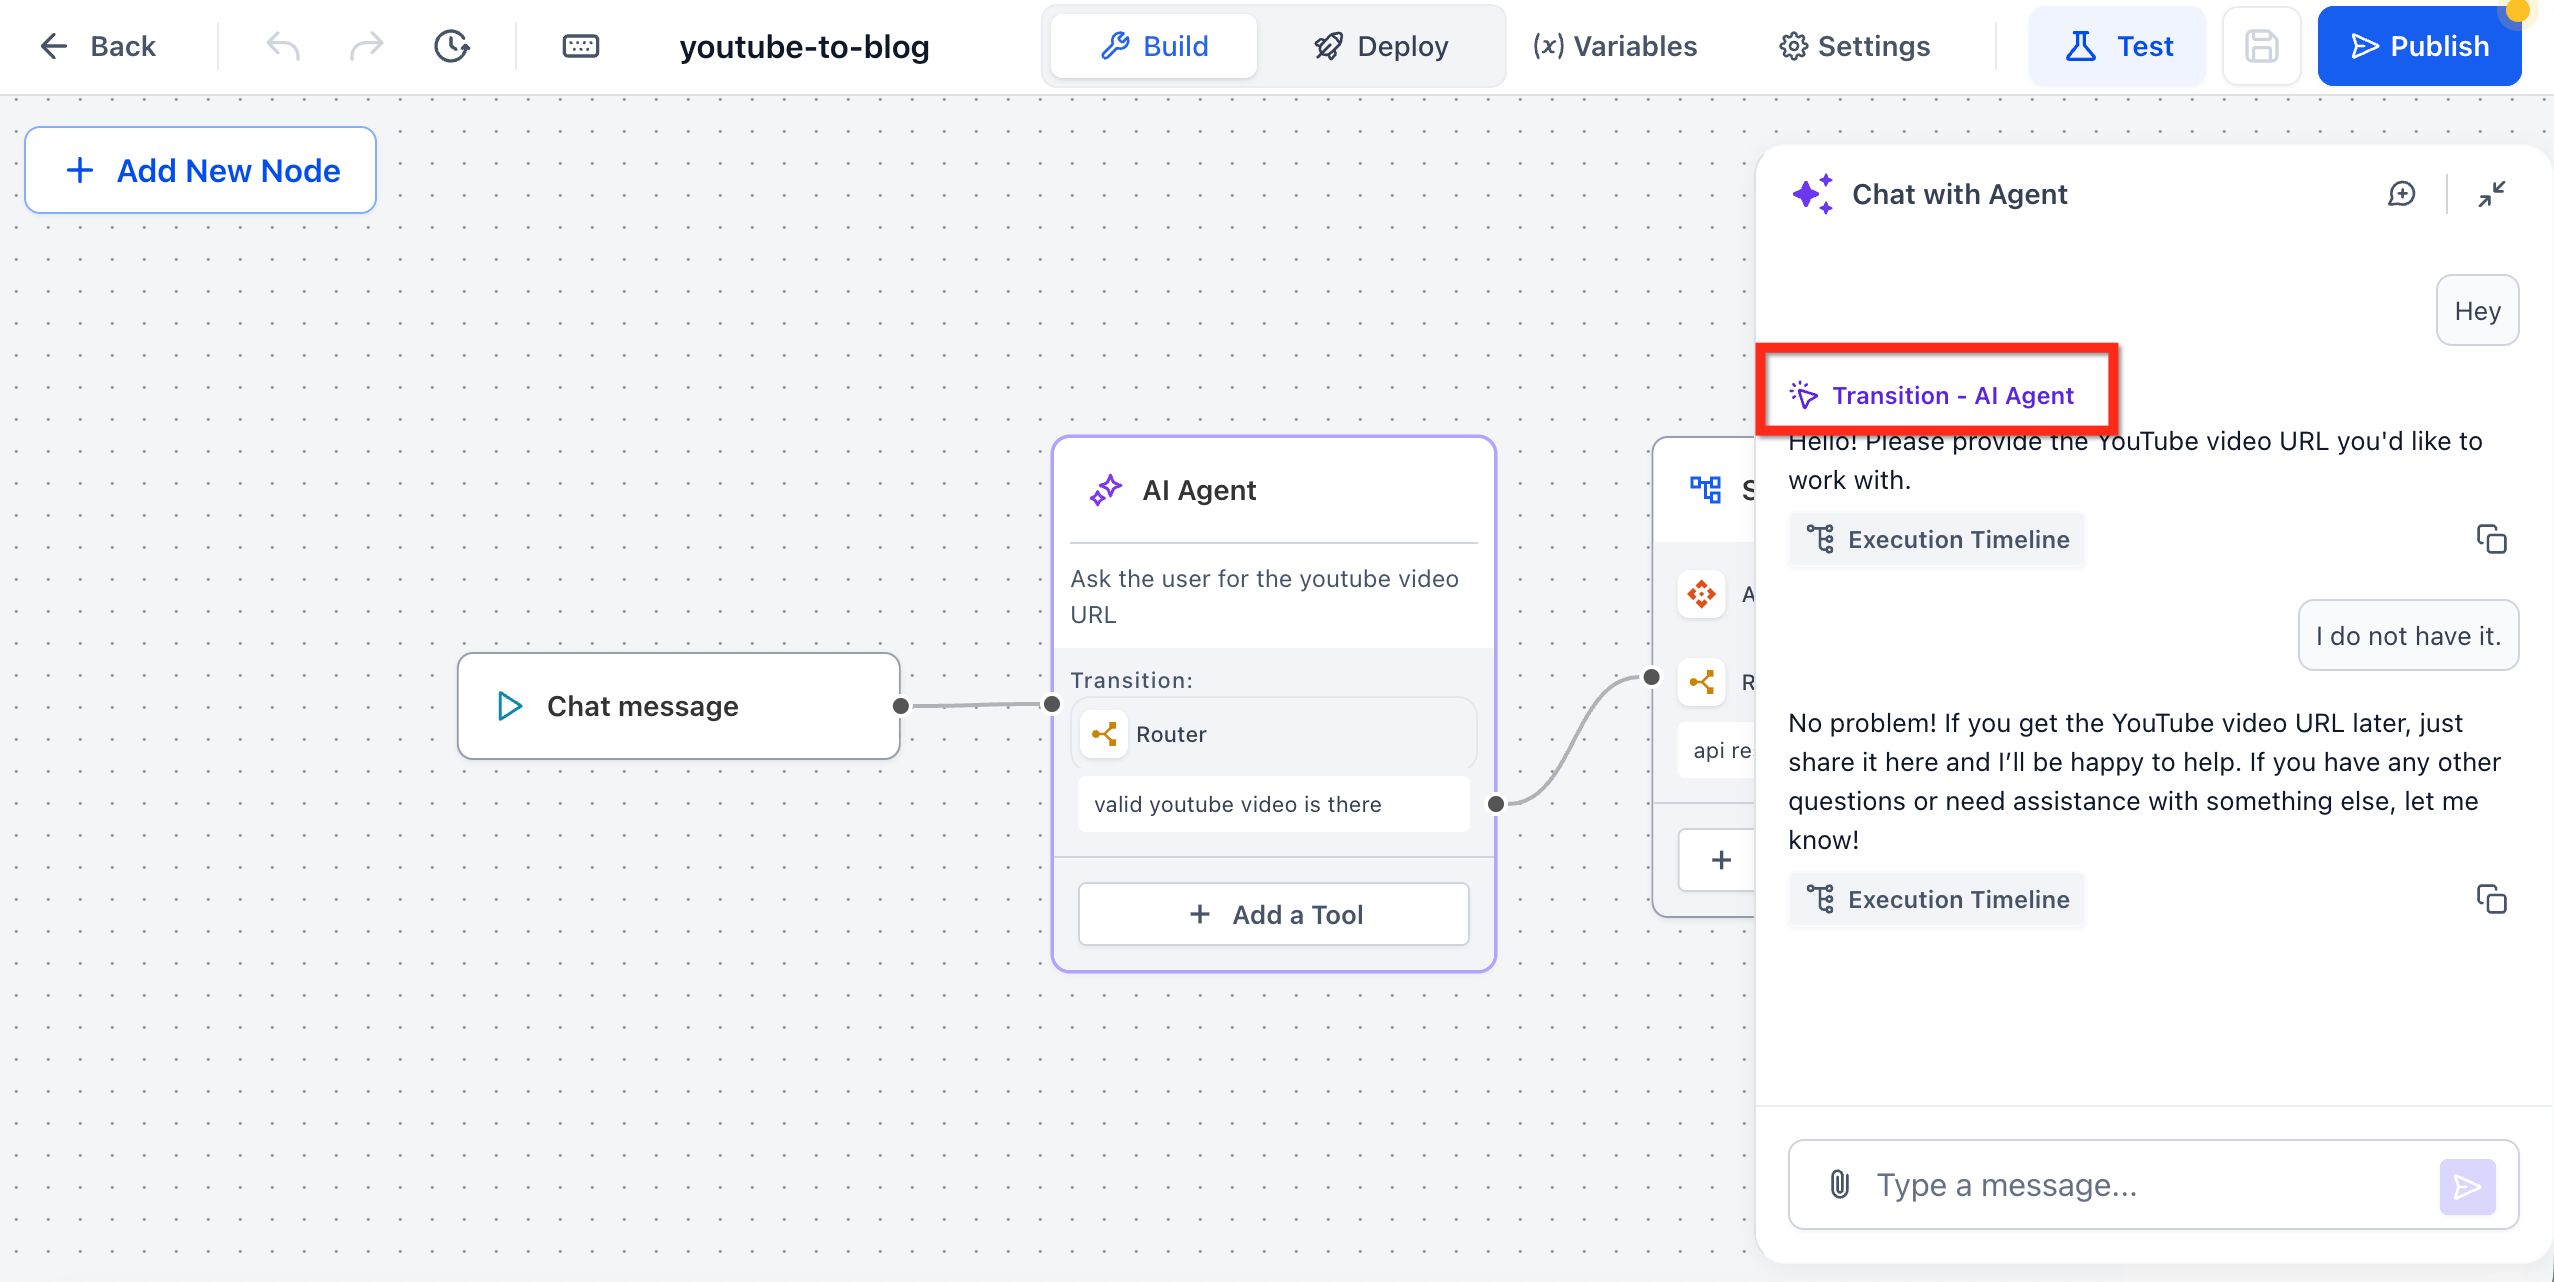
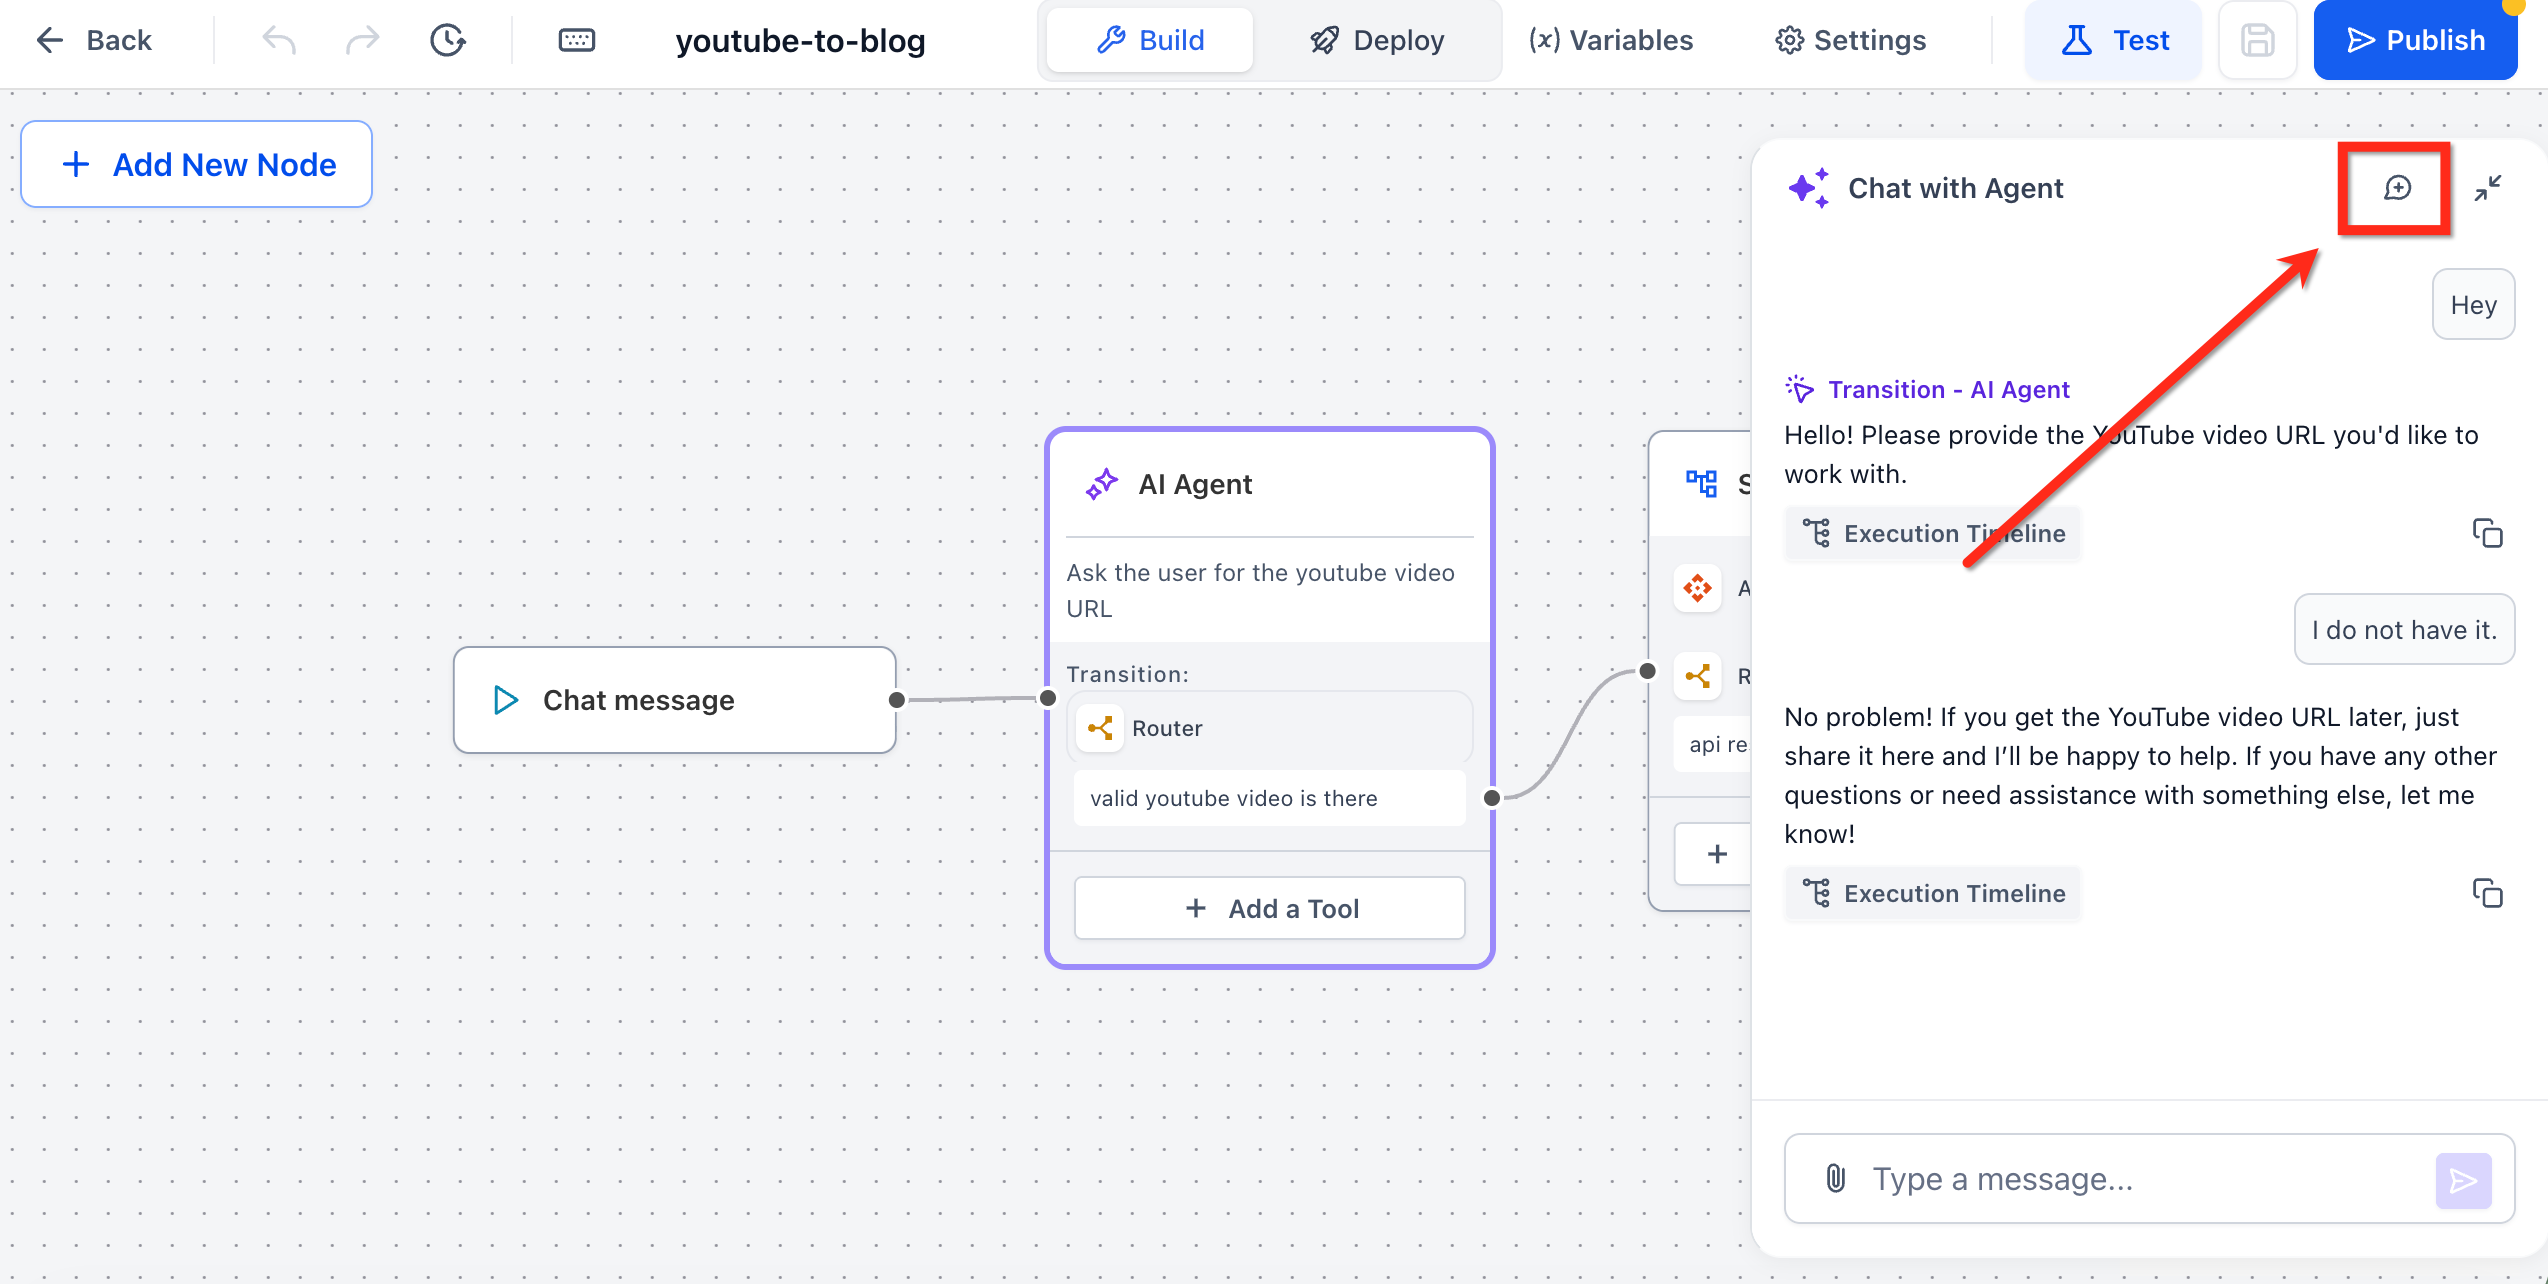
The Chat Emulator simulates a real conversation in a mobile responsive window. You can send test messages, reset the session, and view the timeline side by side. Clicking a log entry highlights the corresponding node on the canvas, letting you edit logic right away. The tools are accessed from the Test tab of an agent inside AI Agents > Agent Studio.
03How businesses use the message execution timeline and chat emulator
- Ecommerce store. The store runs a product recommendation bot in Agent Studio. Using the Chat Emulator, the team sends sample queries, watches the Timeline for token usage and latency, and clicks any slow node to adjust prompts before deploying the bot to shoppers.
- Healthcare clinic. A clinic uses an AI triage assistant. The staff tests appointment booking flows in the Emulator, inspects model settings like temperature and max tokens in the metrics panel, and jumps to nodes that misinterpret symptoms to refine the logic.
- Real estate agency. The agency's lead qualification agent is debugged by sending mock buyer inquiries through the Emulator. Agents review the Timeline for tool calls, reset the session to try alternative paths, and update the flow directly from the highlighted nodes.
04The numbers and rules that matter
- Metrics footer includes model & version, token counts, temperature, max tokens, top p, frequency / presence penalties, total cost estimate (if billing is enabled).
05Before you start
- Create an agent in Agent Studio.
- Save the agent at least once so the Go to Node button becomes available.
- Fill any required fields on nodes to avoid the orange warning during testing.
06How to set up and use the message execution timeline and chat emulator in HighLevel
Test and debug an AI agent in Agent Studio
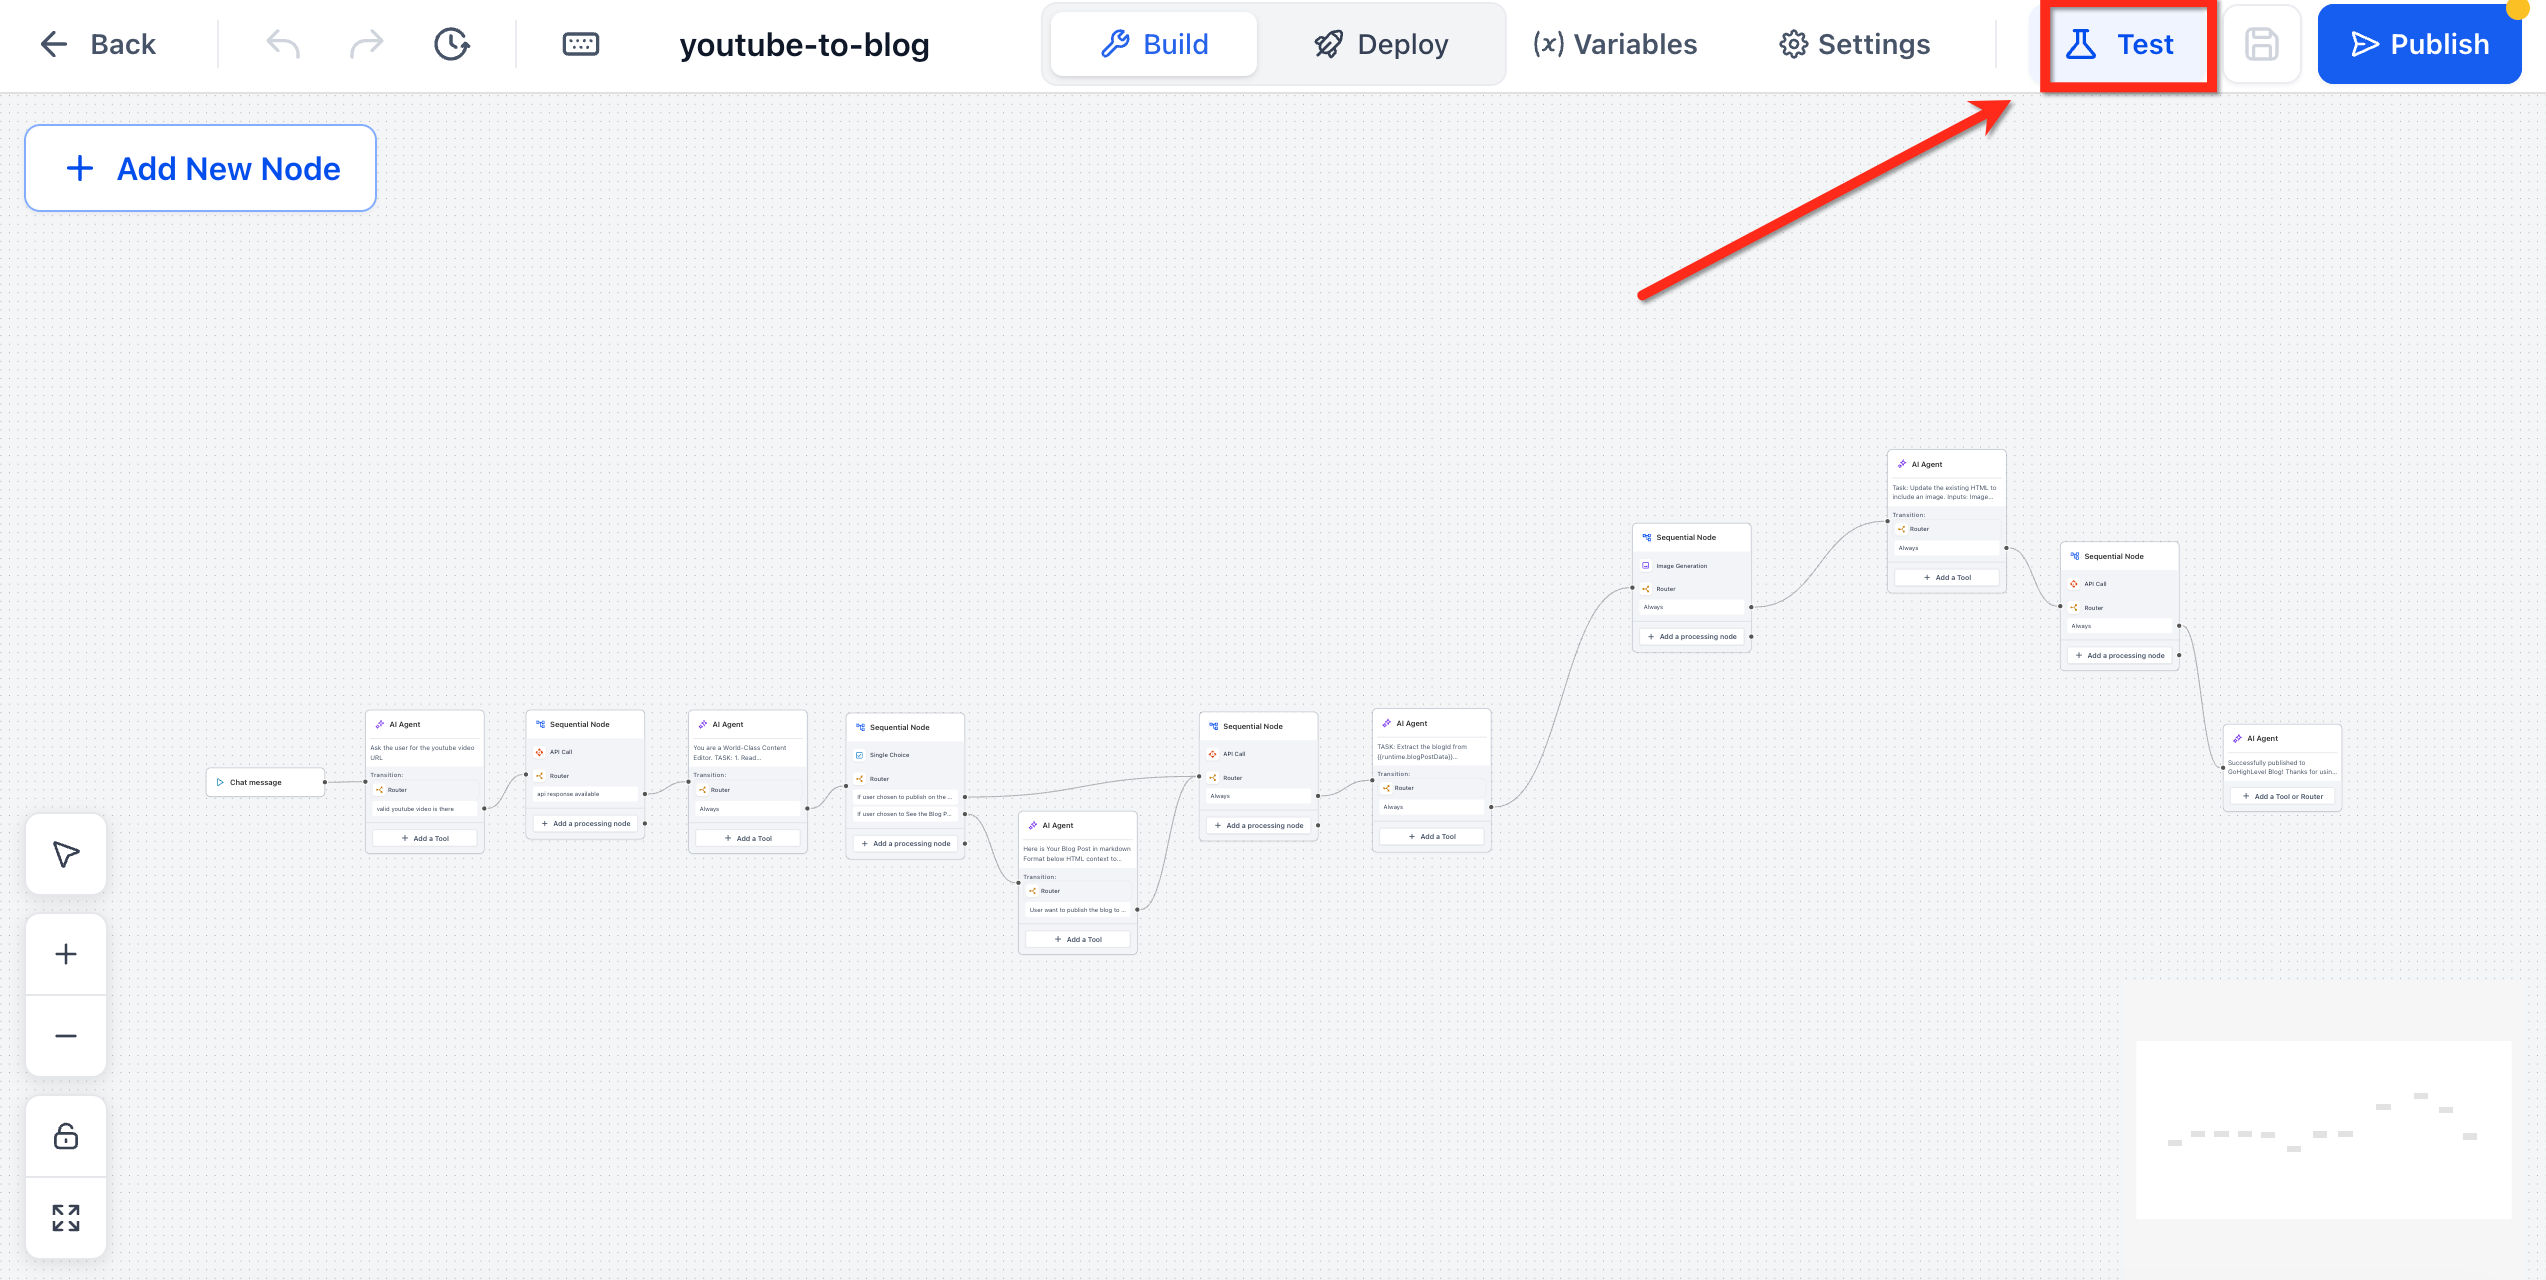
- Navigate to AI Agents > Agent Studio, open the target agent, and select the Test tab in the top right corner.
- Press Start to open the Chat Emulator; the Message Execution Timeline appears beside the chat window. Send a test message or trigger the agent via API.
- Look at the event cards in the Timeline to see node names, tool activity, token counts, execution time and any latency badges.
- Click a log entry to view detailed metrics such as model version, temperature and cost estimate.
- Select a log card to automatically highlight the corresponding node on the canvas for quick edits.
- Use the Reset button in the Emulator to clear the conversation and timeline, then run the test again to confirm changes.
- When the conversation behaves as expected, move the agent to Staging or Production.
07What it looks like in HighLevel
08Things to know before you rely on it
- The Timeline does not add extra token usage or cost; it records metadata already returned by the model.
- The Go to Node button appears only after the agent has been saved at least once.
- The feature is provided with the Unlimited AI Employee plan.
09If something goes wrong
- Missing Required Fields warning appears when clicking Test. Open the listed node, complete the required fields, and save the agent to clear the warning.
- Go to Node button is not visible. Ensure the agent has been saved at least once; the button is hidden on unsaved drafts.
10How it connects to the rest of HighLevel
- Create, test and publish flow agents in HighLevel Agent Studio Setup flow agents
- Set up and Use Managed Agents in Agent Studio Managed agents
- HighLevel pricing and plans Pricing details
Michael's take

Most people assume the Timeline is just a pretty log and overlook the clickable Transition labels. Those labels let you jump straight to the node that generated a response, speeding up debugging.
When you reset the Chat Emulator and run the flow again, you can see the updated logs and metrics, which helps confirm that your changes had the intended effect.