
01Who this is for
- Team members can view a breakdown of traffic sources for websites and funnels.
- Stakeholders can compare paid versus organic performance at a glance.
02Traffic source analytics, explained
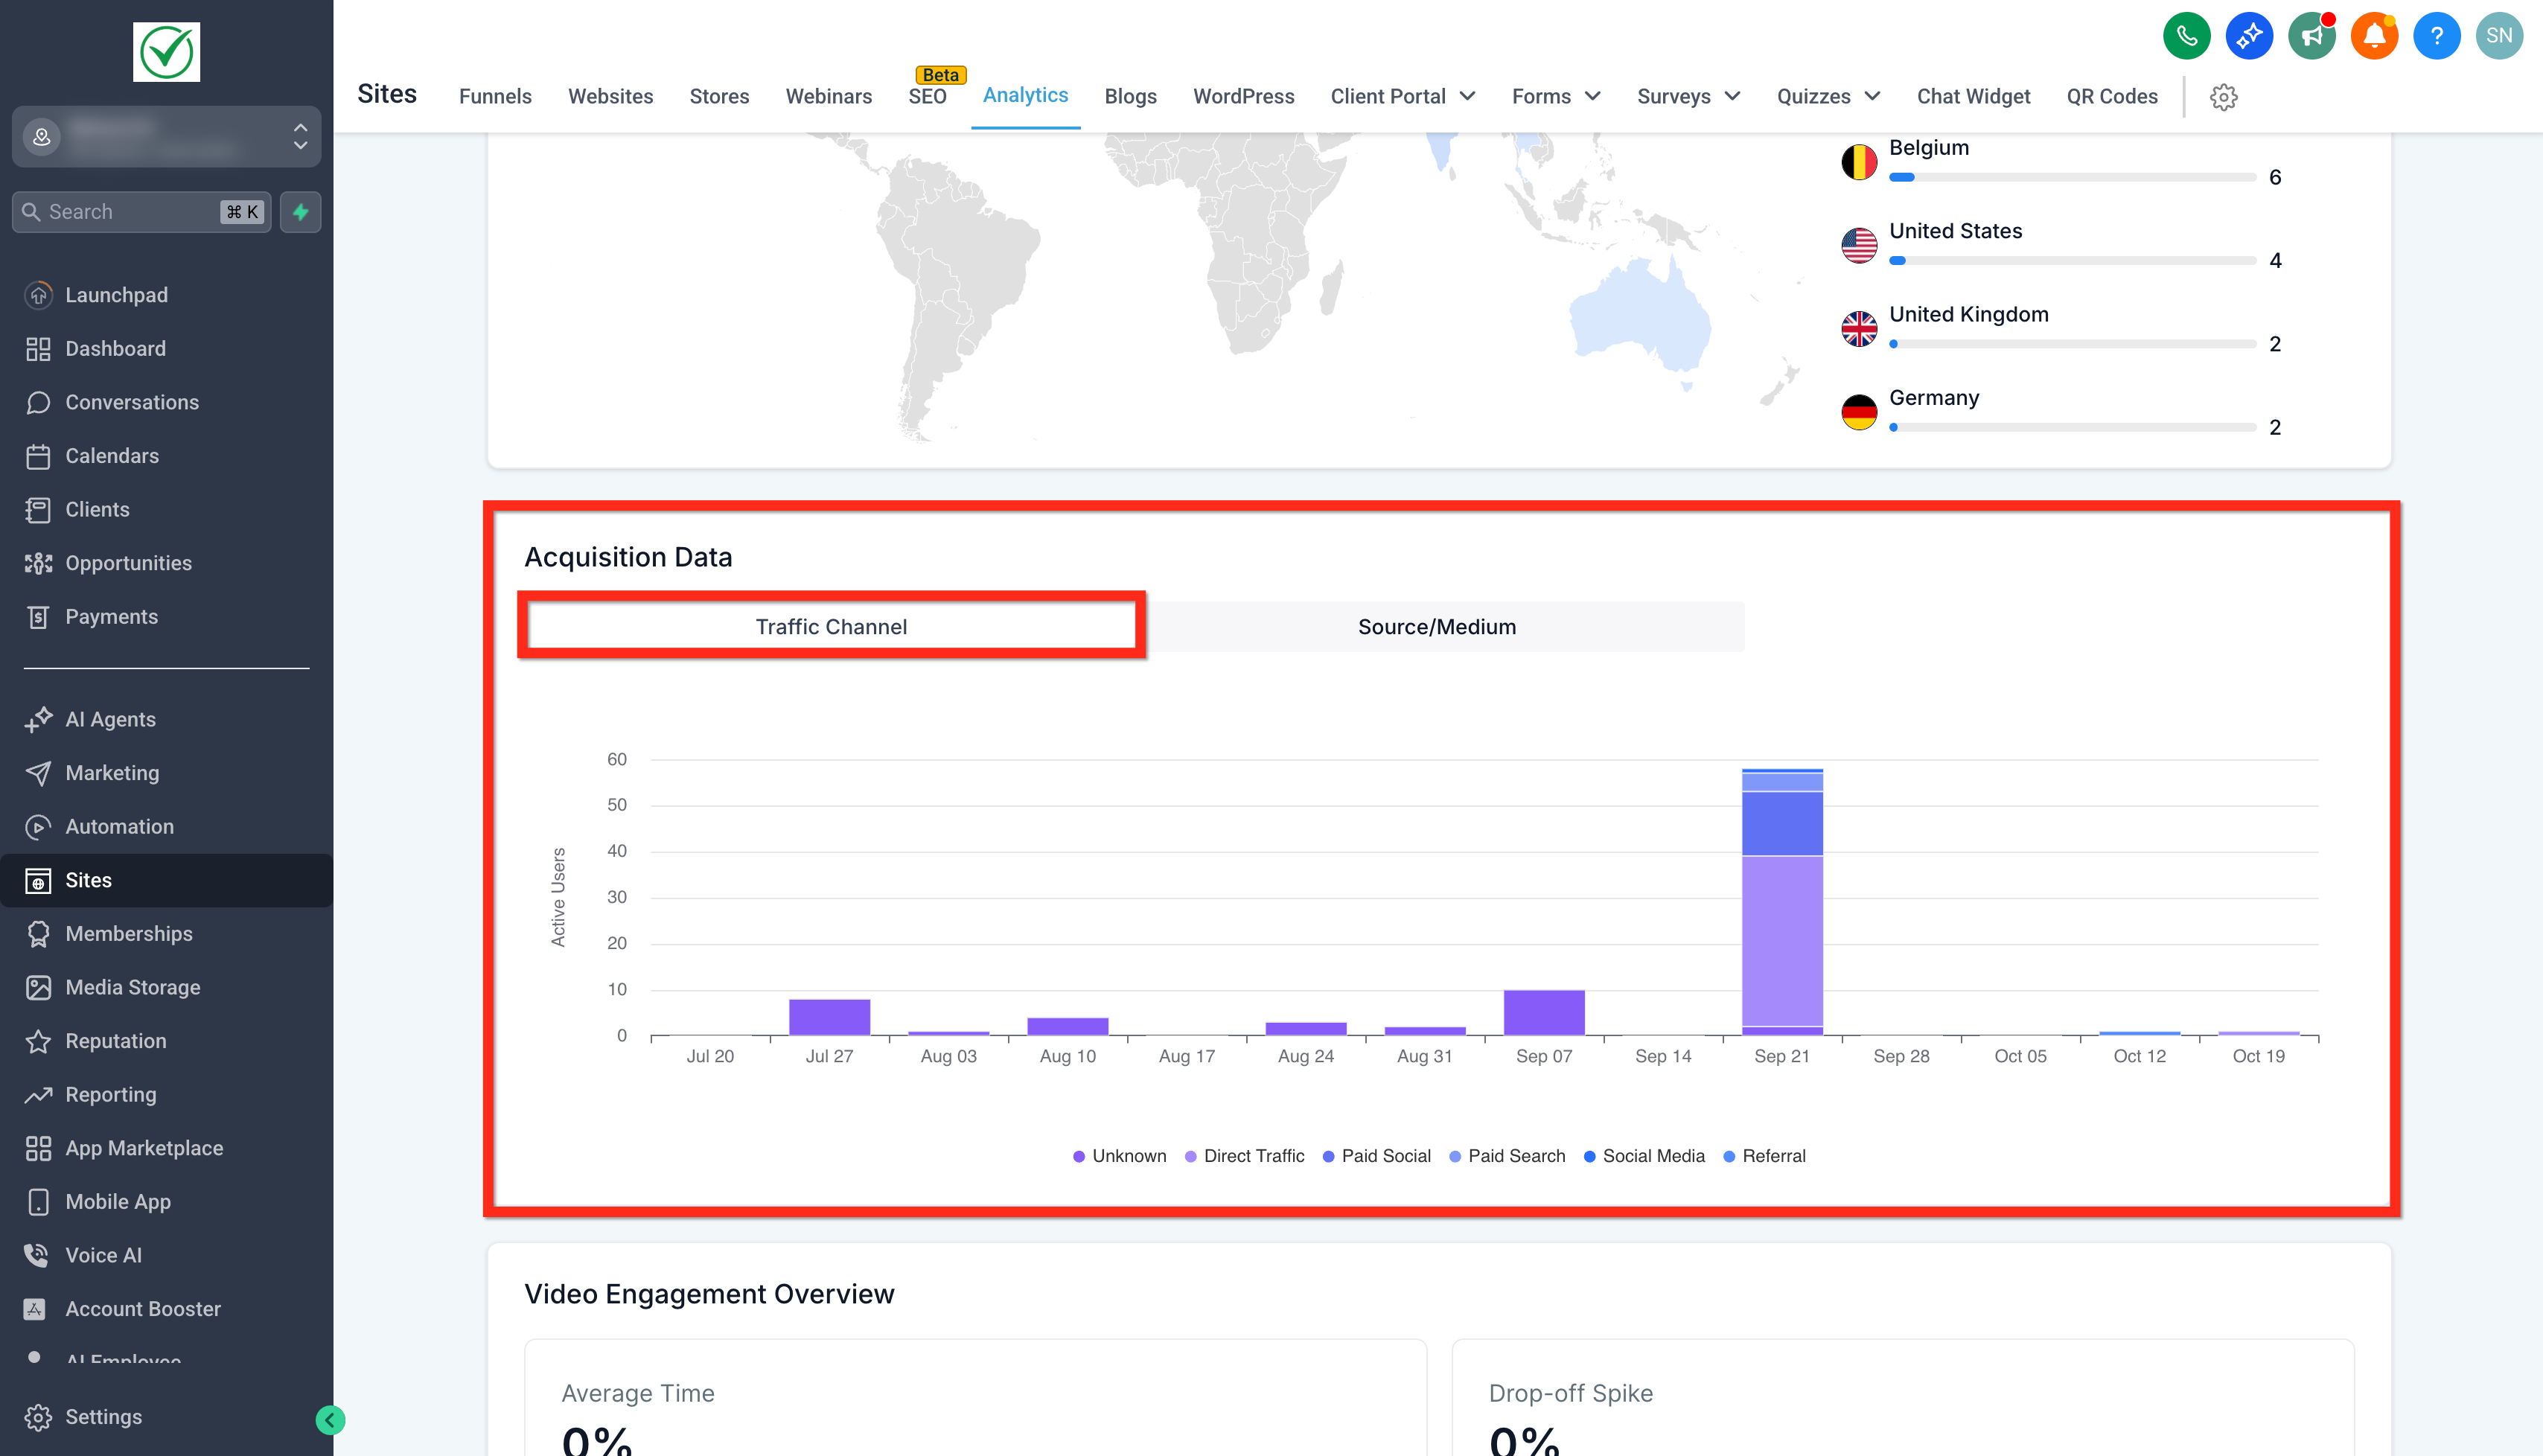
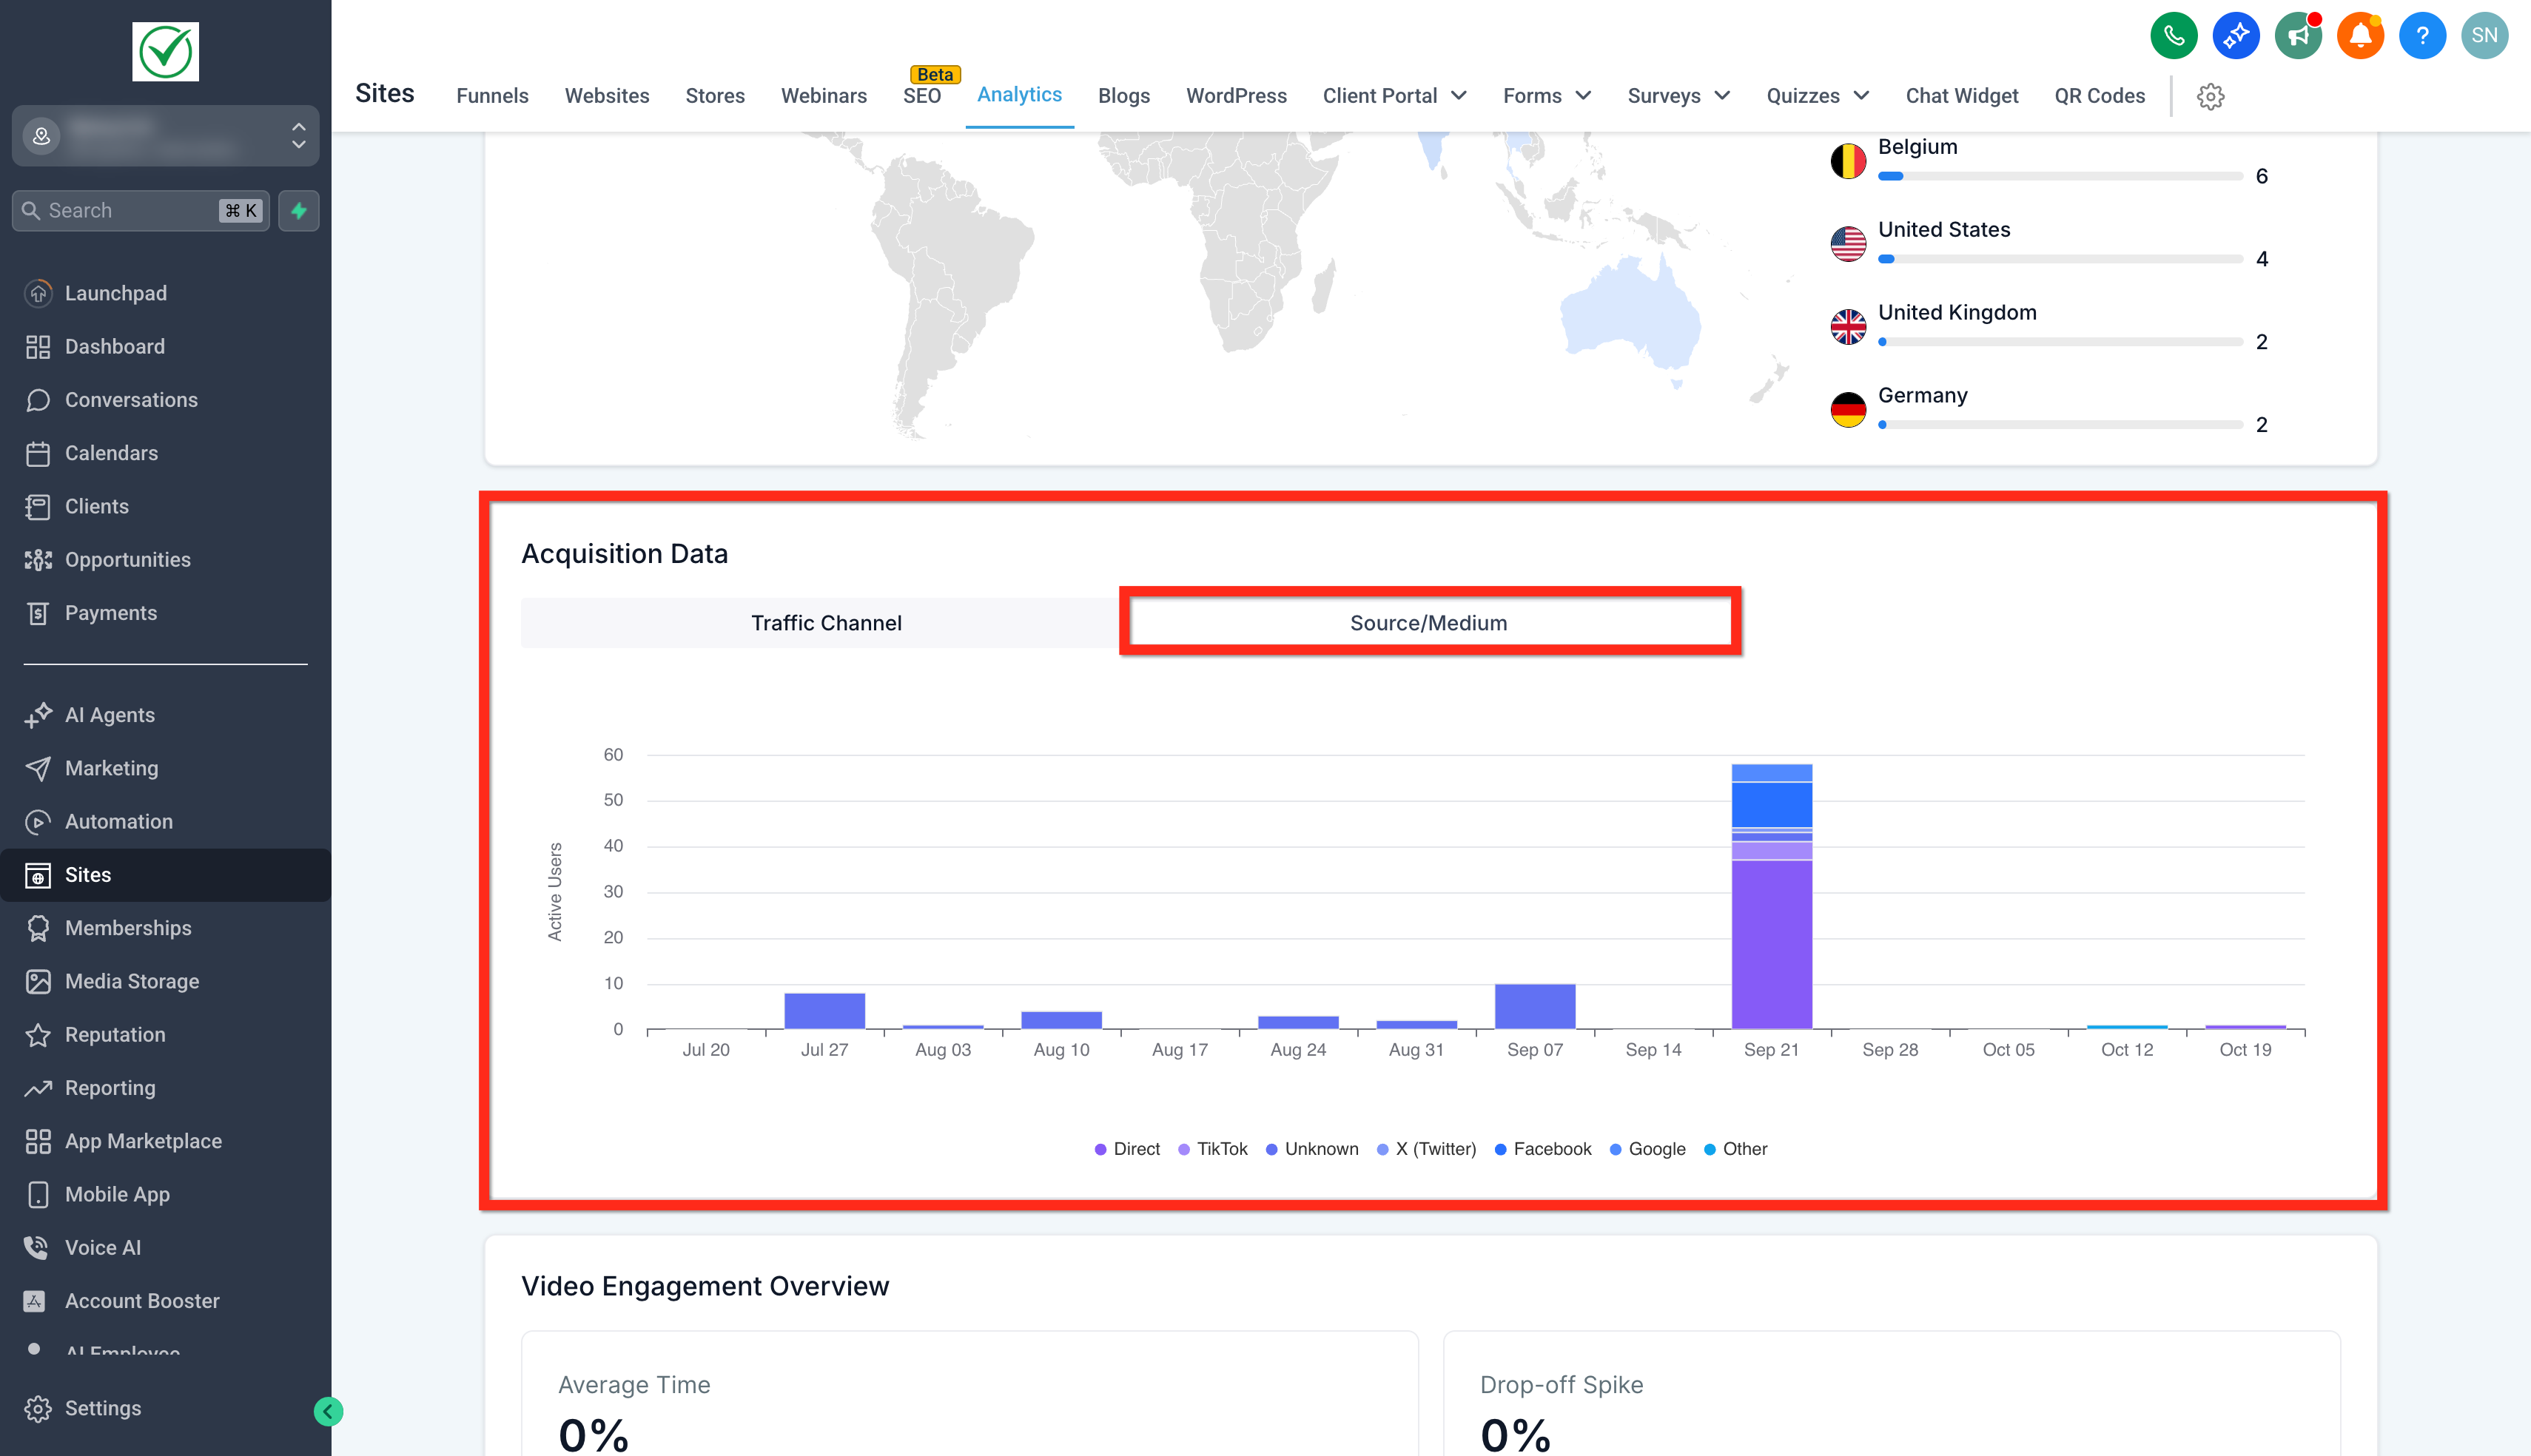
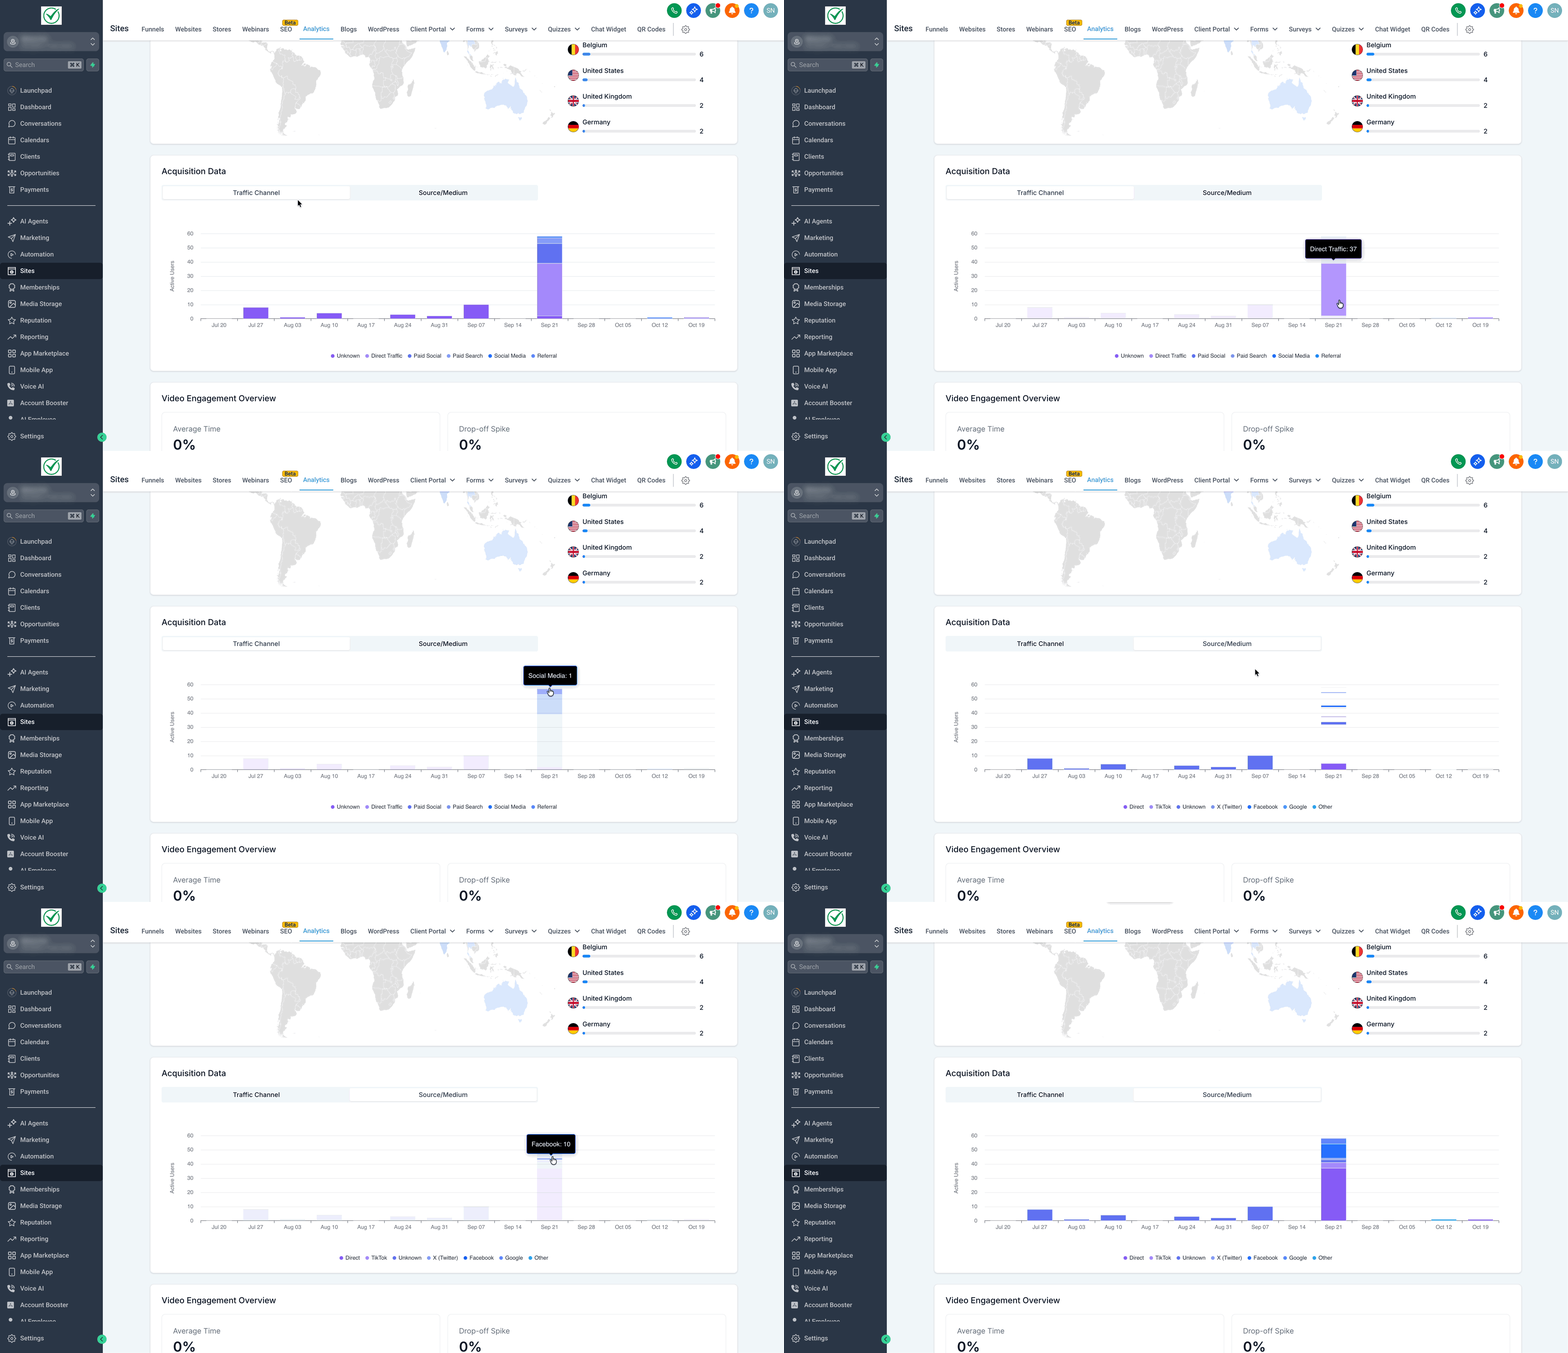
Traffic Source Analytics lives inside Sites > Analytics. The feature presents a stacked bar chart that tallies daily visits for the selected date range. Above the chart, tabs let you switch between a channel level view, Paid Search, Paid Social, Organic Search, Direct, Referral, Social, and Other, and a source/medium view that lists exact origins such as google or facebook.
The dashboard reads UTM parameters, click IDs and referrer data to assign each session to a channel. Sessions without usable data appear under Other (Unknown/Unmapped). Hovering over any bar displays the exact visit count for that day, enabling deeper investigation.
03How businesses use traffic source analytics
- Ecommerce store. The owner selects the desired date range, opens the Traffic Channel tab, and checks the proportion of Paid Search versus Direct traffic. By hovering over a date with a sudden dip, the owner can verify whether a promotion tag was missing.
- Local service provider. The provider switches to the Source/Medium tab to see which platforms, google, facebook, or direct, are driving leads. This helps confirm that the UTM tags on local Google Ads are being recorded.
- Online course creator. The creator uses the chart to compare Organic Search against Paid Social over the last month, then drills into a specific day to see if a webinar announcement generated the expected traffic.
04The numbers and rules that matter
- Channels shown: Paid Search, Paid Social, Organic Search, Direct, Referral, Social, Other (Unknown/Unmapped).
05Before you start
- Ensure UTM parameters, click IDs and referrer data are correctly implemented on your campaigns for accurate attribution.
06How to set up and use traffic source analytics in HighLevel
Use traffic source analytics in Sites
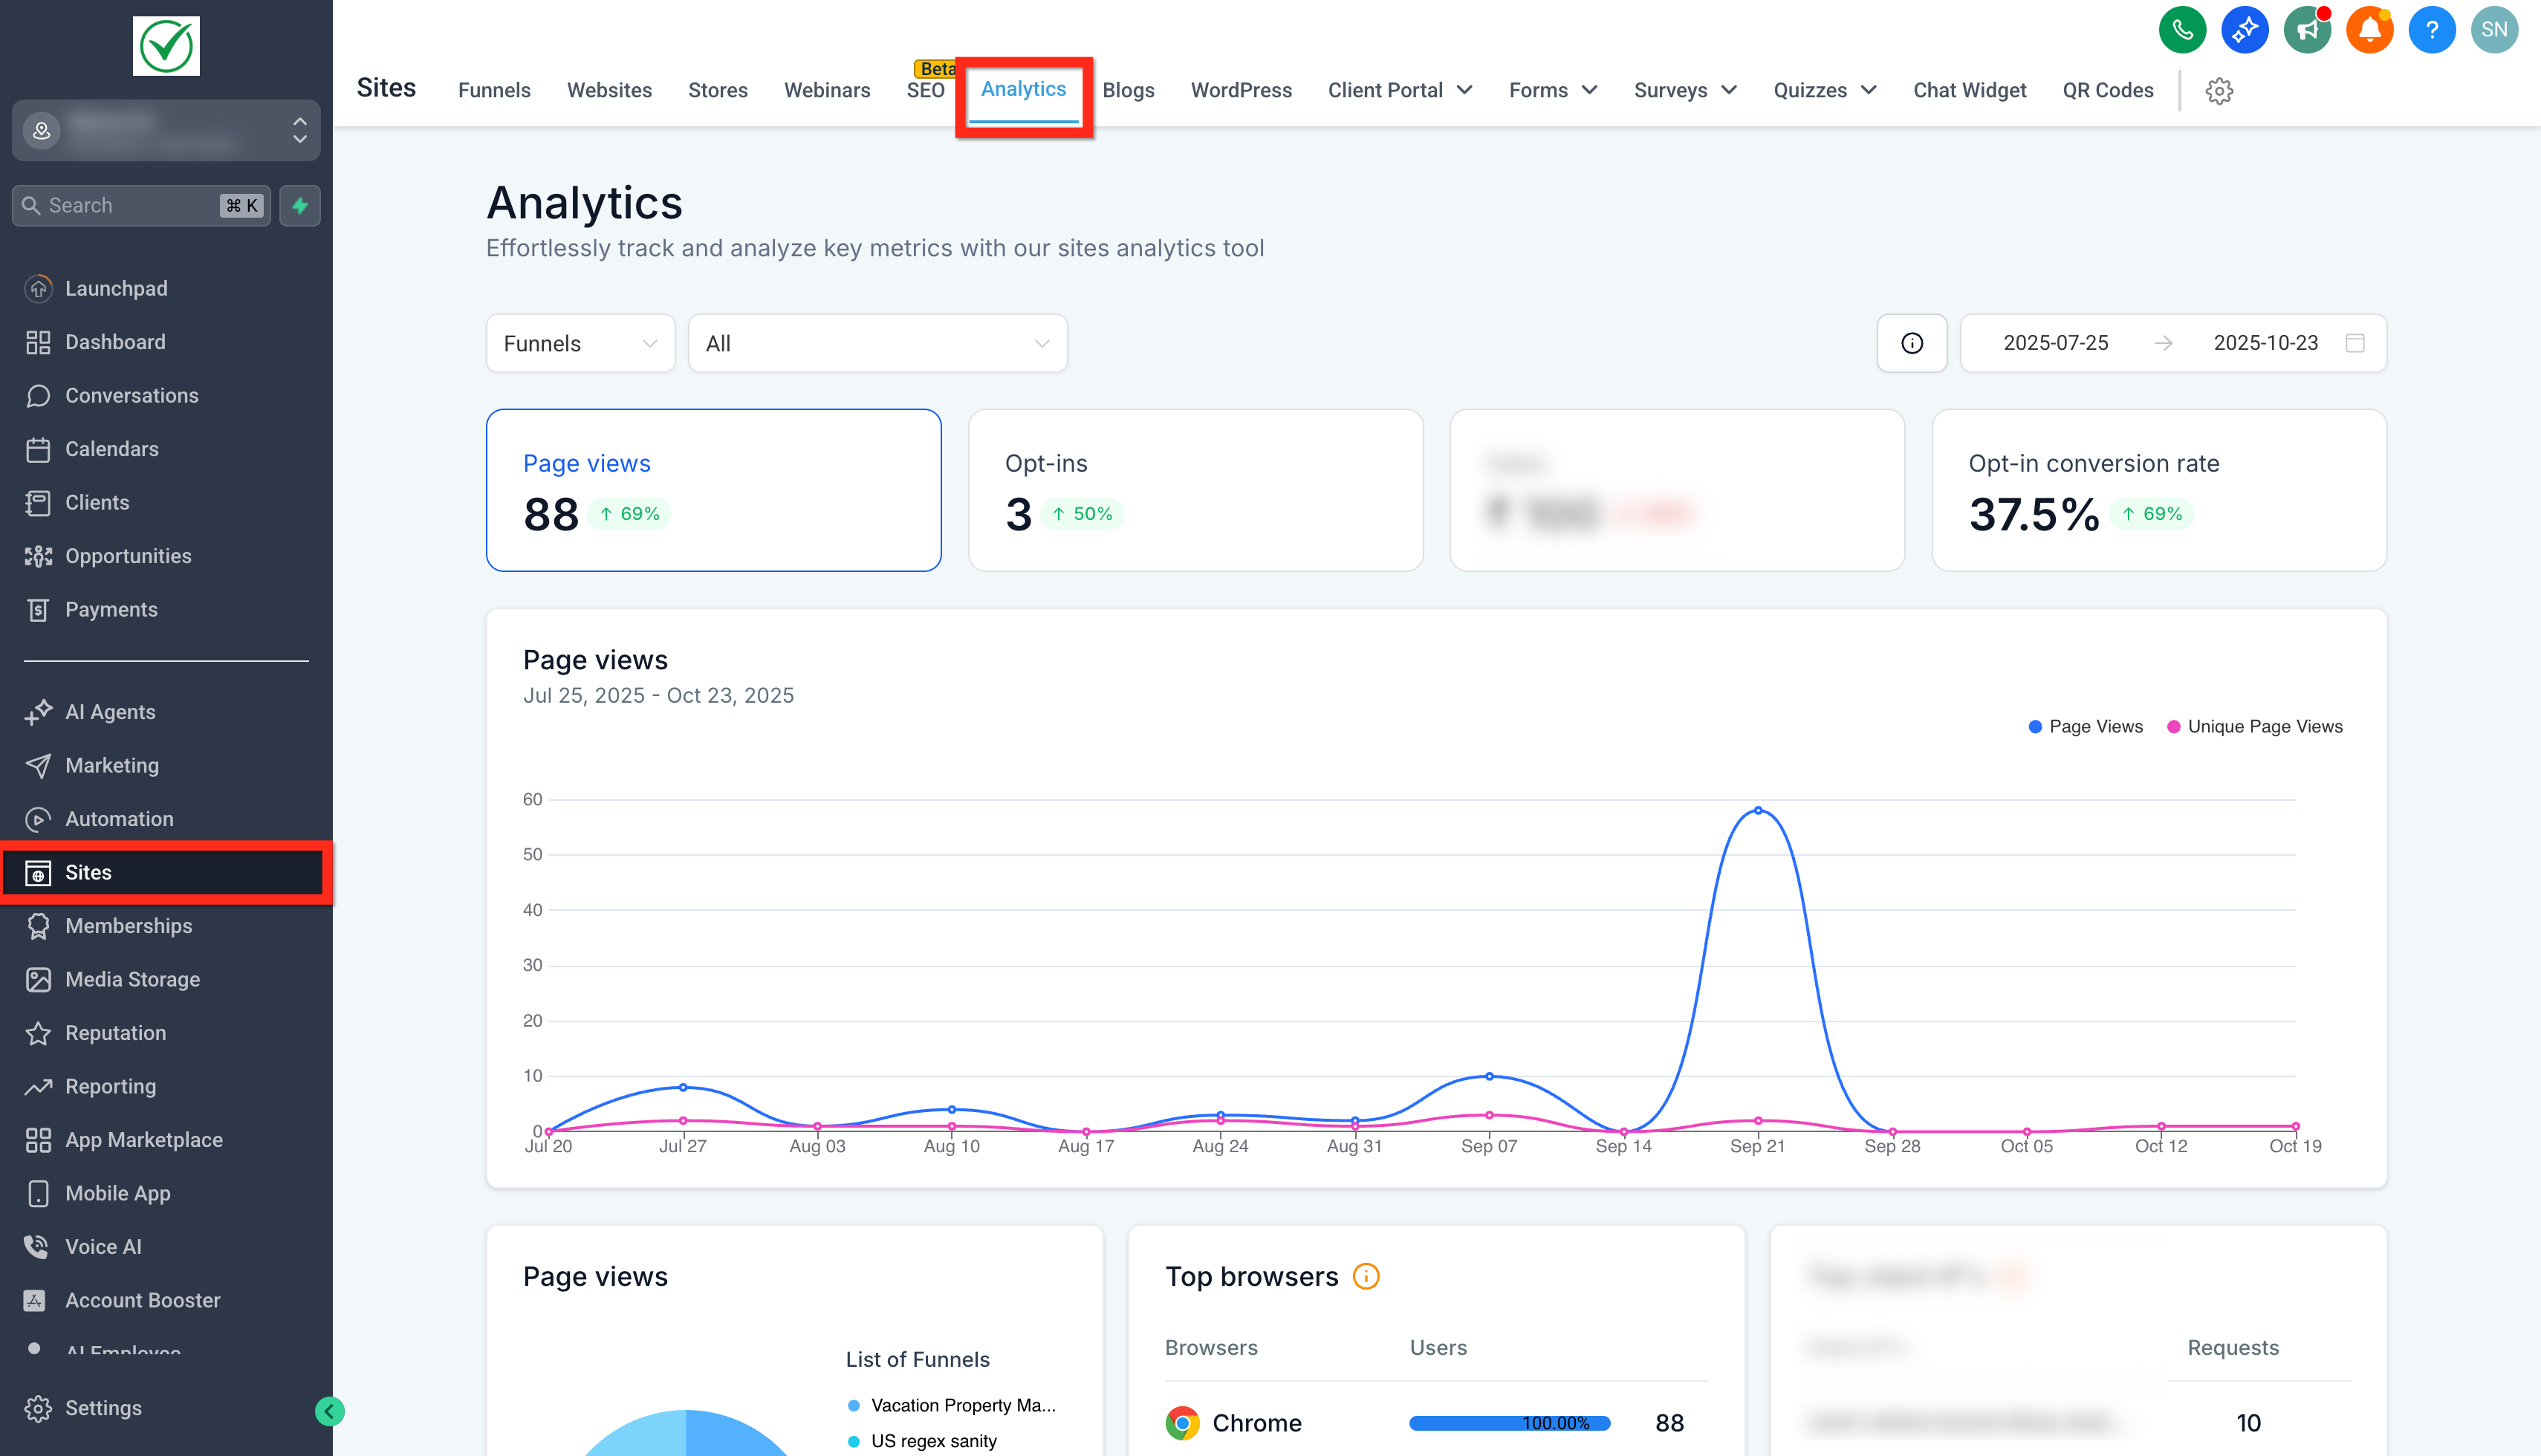
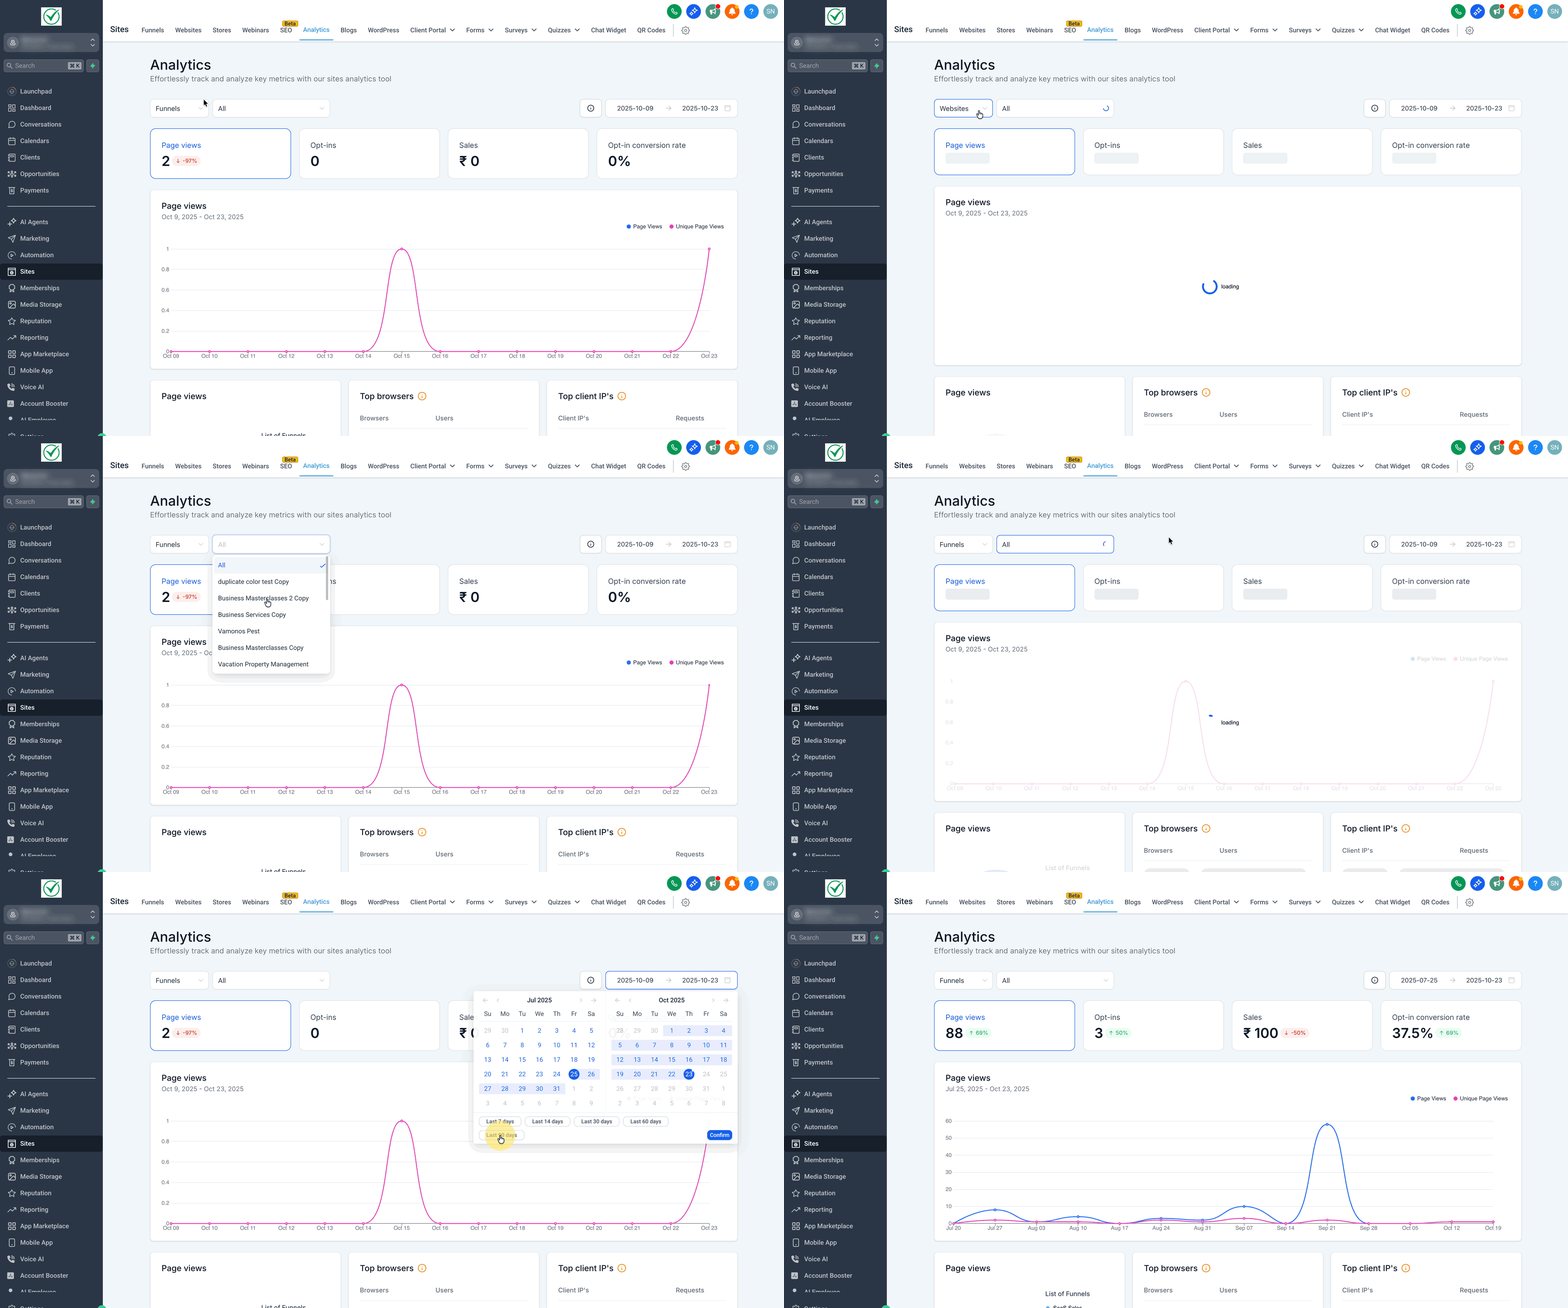
- Navigate to Sites > Analytics.
- Select Funnels or Websites and set the desired date range.
- Scroll to the Acquisition Data area and click the Traffic Channel tab.
- Click the Source/Medium tab to view detailed origins.
- Hover over any day bar in the stacked chart to see the exact visit count.
07What it looks like in HighLevel
08Settings that matter
- Date Range. Controls which days are included in the traffic charts and totals.
- Traffic Channel tab. Shows traffic aggregated by high level channels such as Paid Search, Direct, or Referral.
- Source/Medium tab. Provides a granular breakdown of traffic by specific source and medium values.
09How it connects to the rest of HighLevel
- HighLevel pie chart visualizations in funnel and website analytics pie chart visualizations
- HighLevel geographic analytics for countries, states and cities geographic analytics
- Analytics for external tracking in HighLevel external tracking analytics
Michael's take

Traffic source analytics is useful if you need to see where your site visits are coming from.
Teams that only rely on broad performance numbers and have no need to verify UTM tagging should skip it.