
01Who this is for
- Founders who monitor funnel performance can right away see which pages generate the most traffic and sales.
- Marketing managers can compare multiple websites to decide where to focus promotion efforts.
- Conversion specialists can isolate under performing steps within a funnel to target improvements.
02Pie chart visualizations, explained
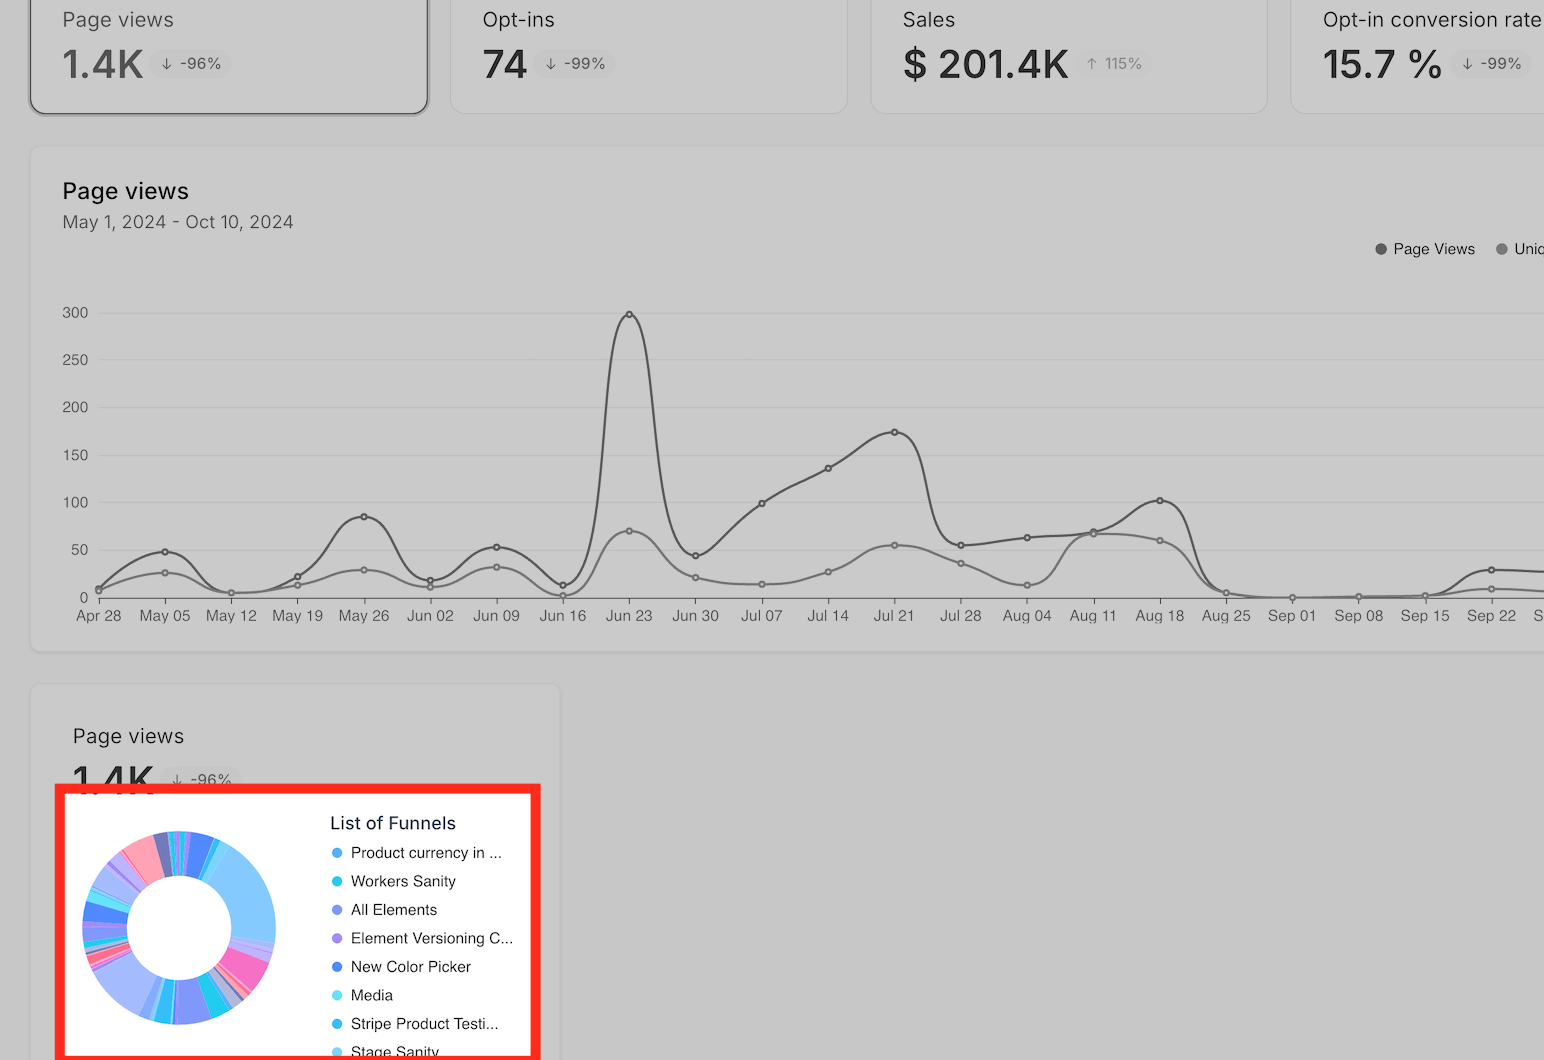
The pie chart visualization appears in the Sites > Analytics section. It displays a circular chart that splits total page views and total sales among selected funnels, websites, or steps. The chart automatically redraws when you apply filters, giving a quick snapshot of distribution.
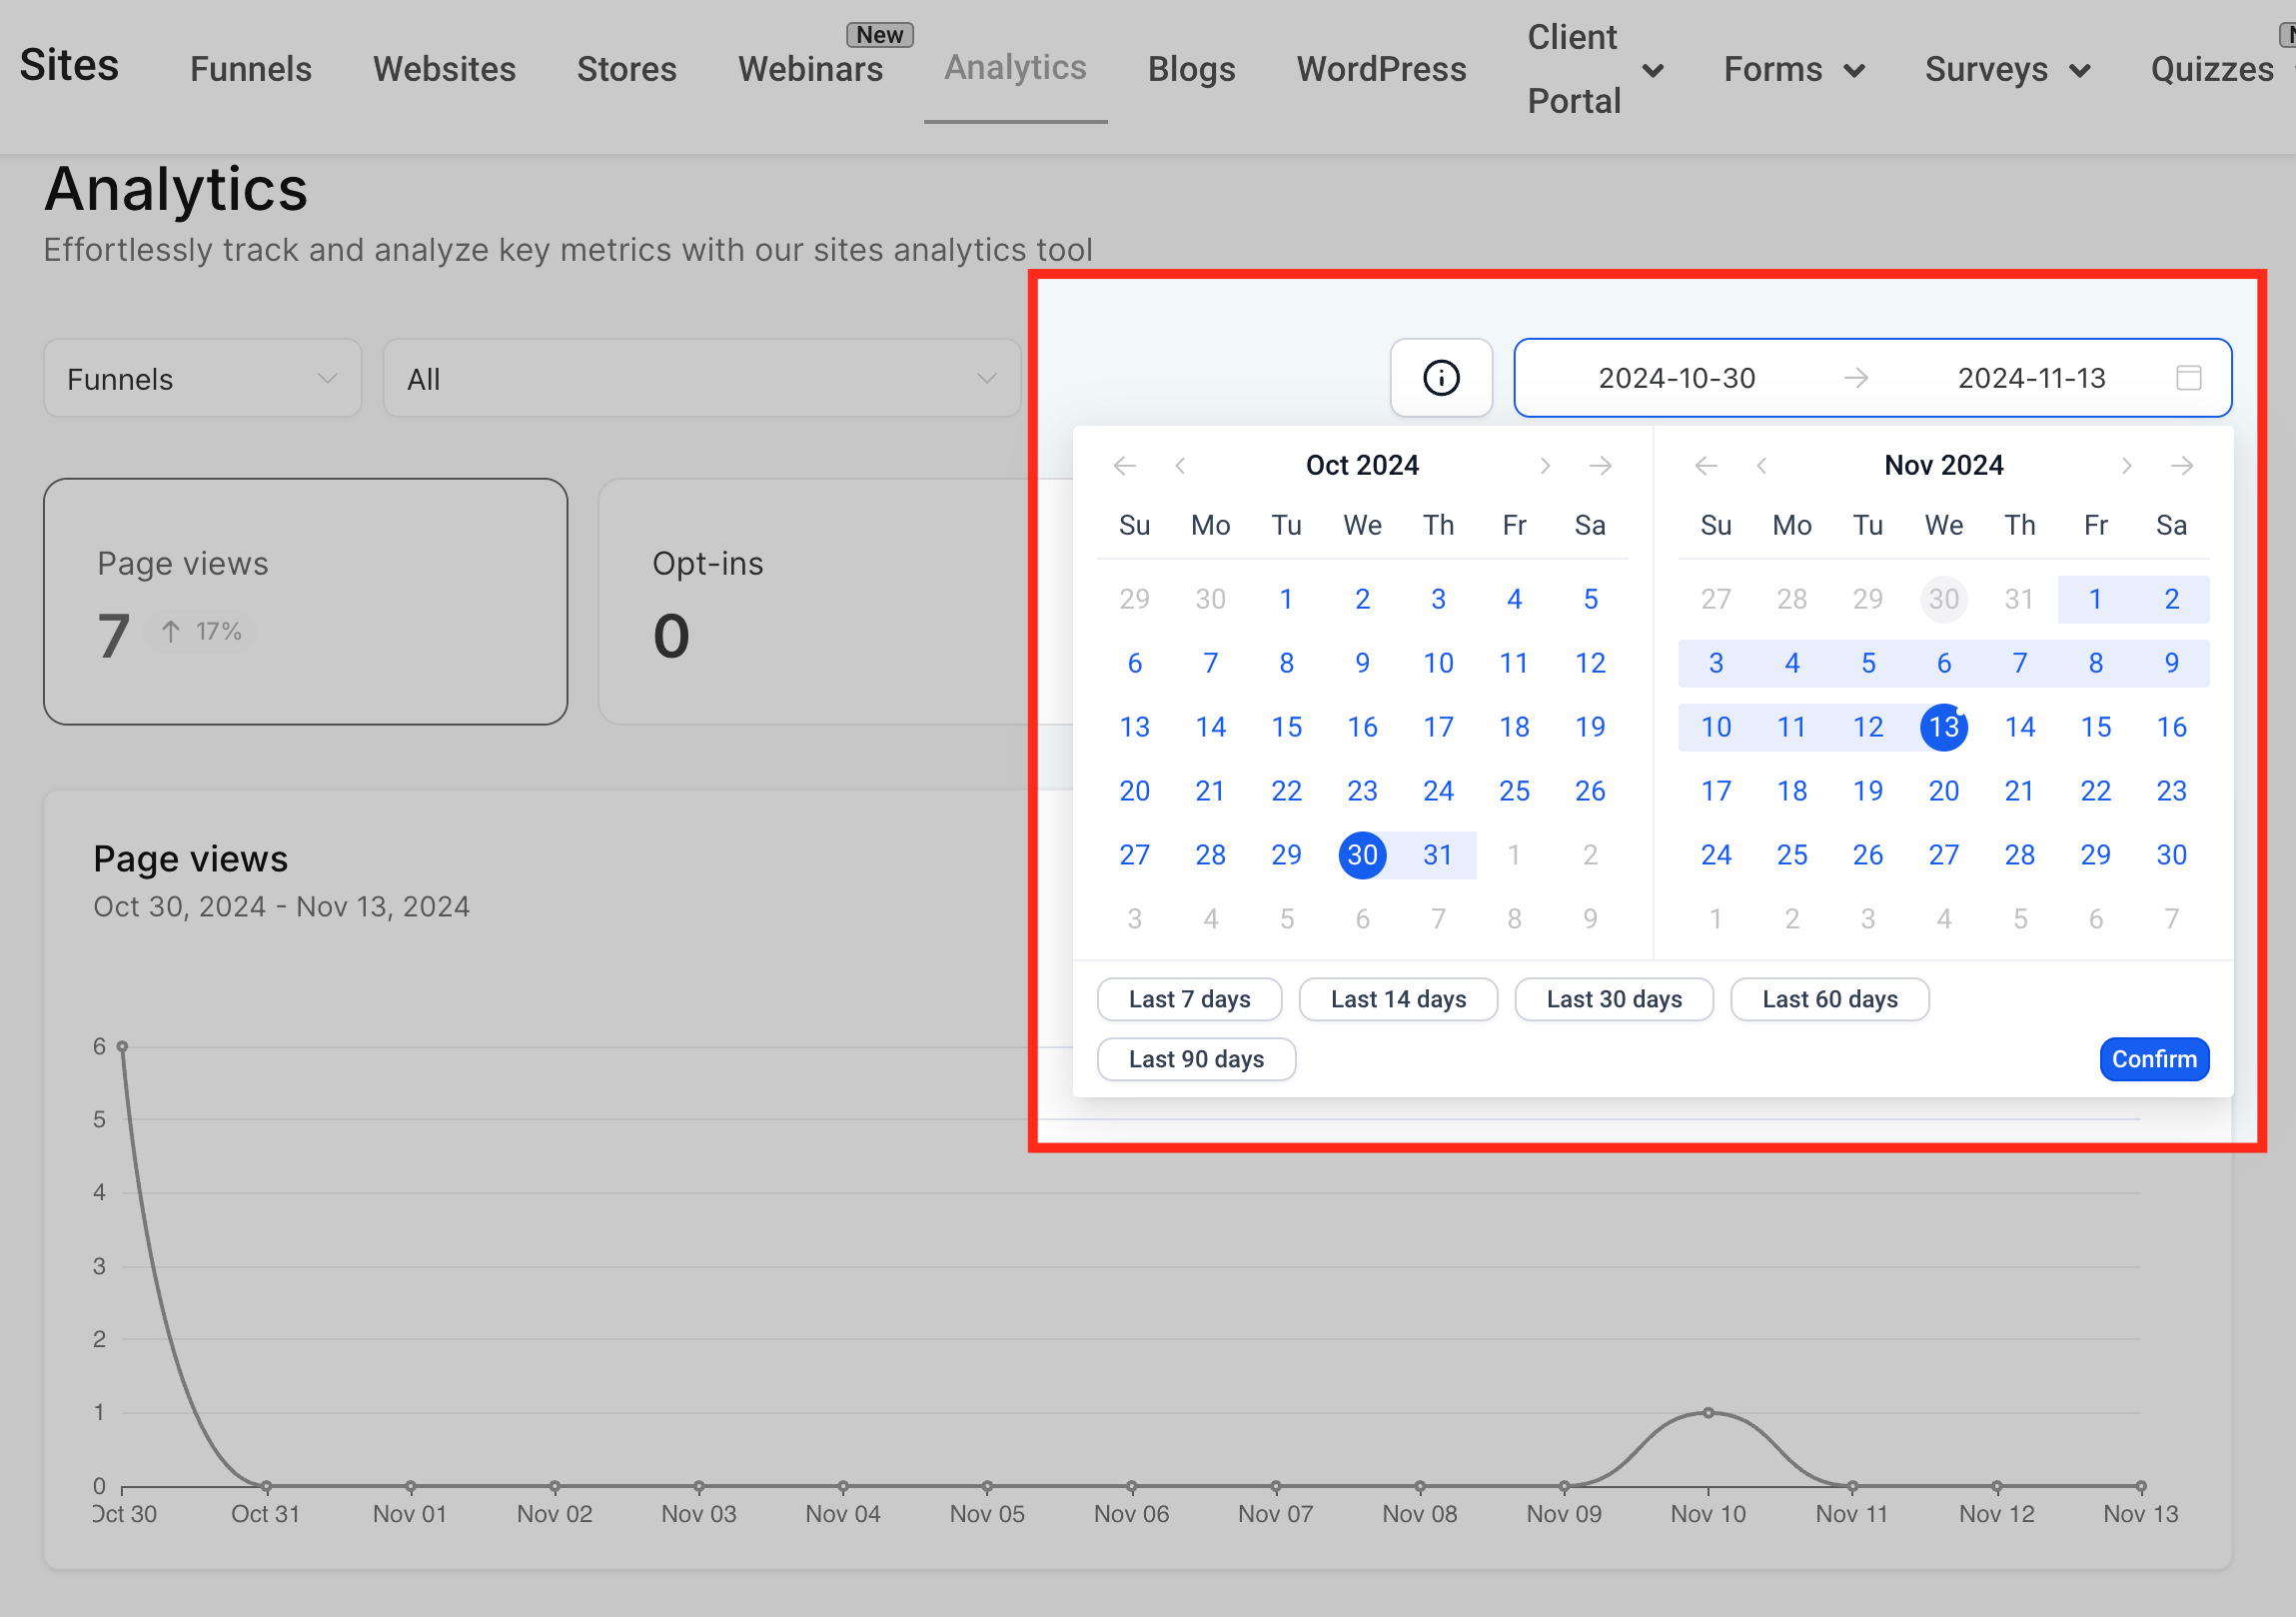
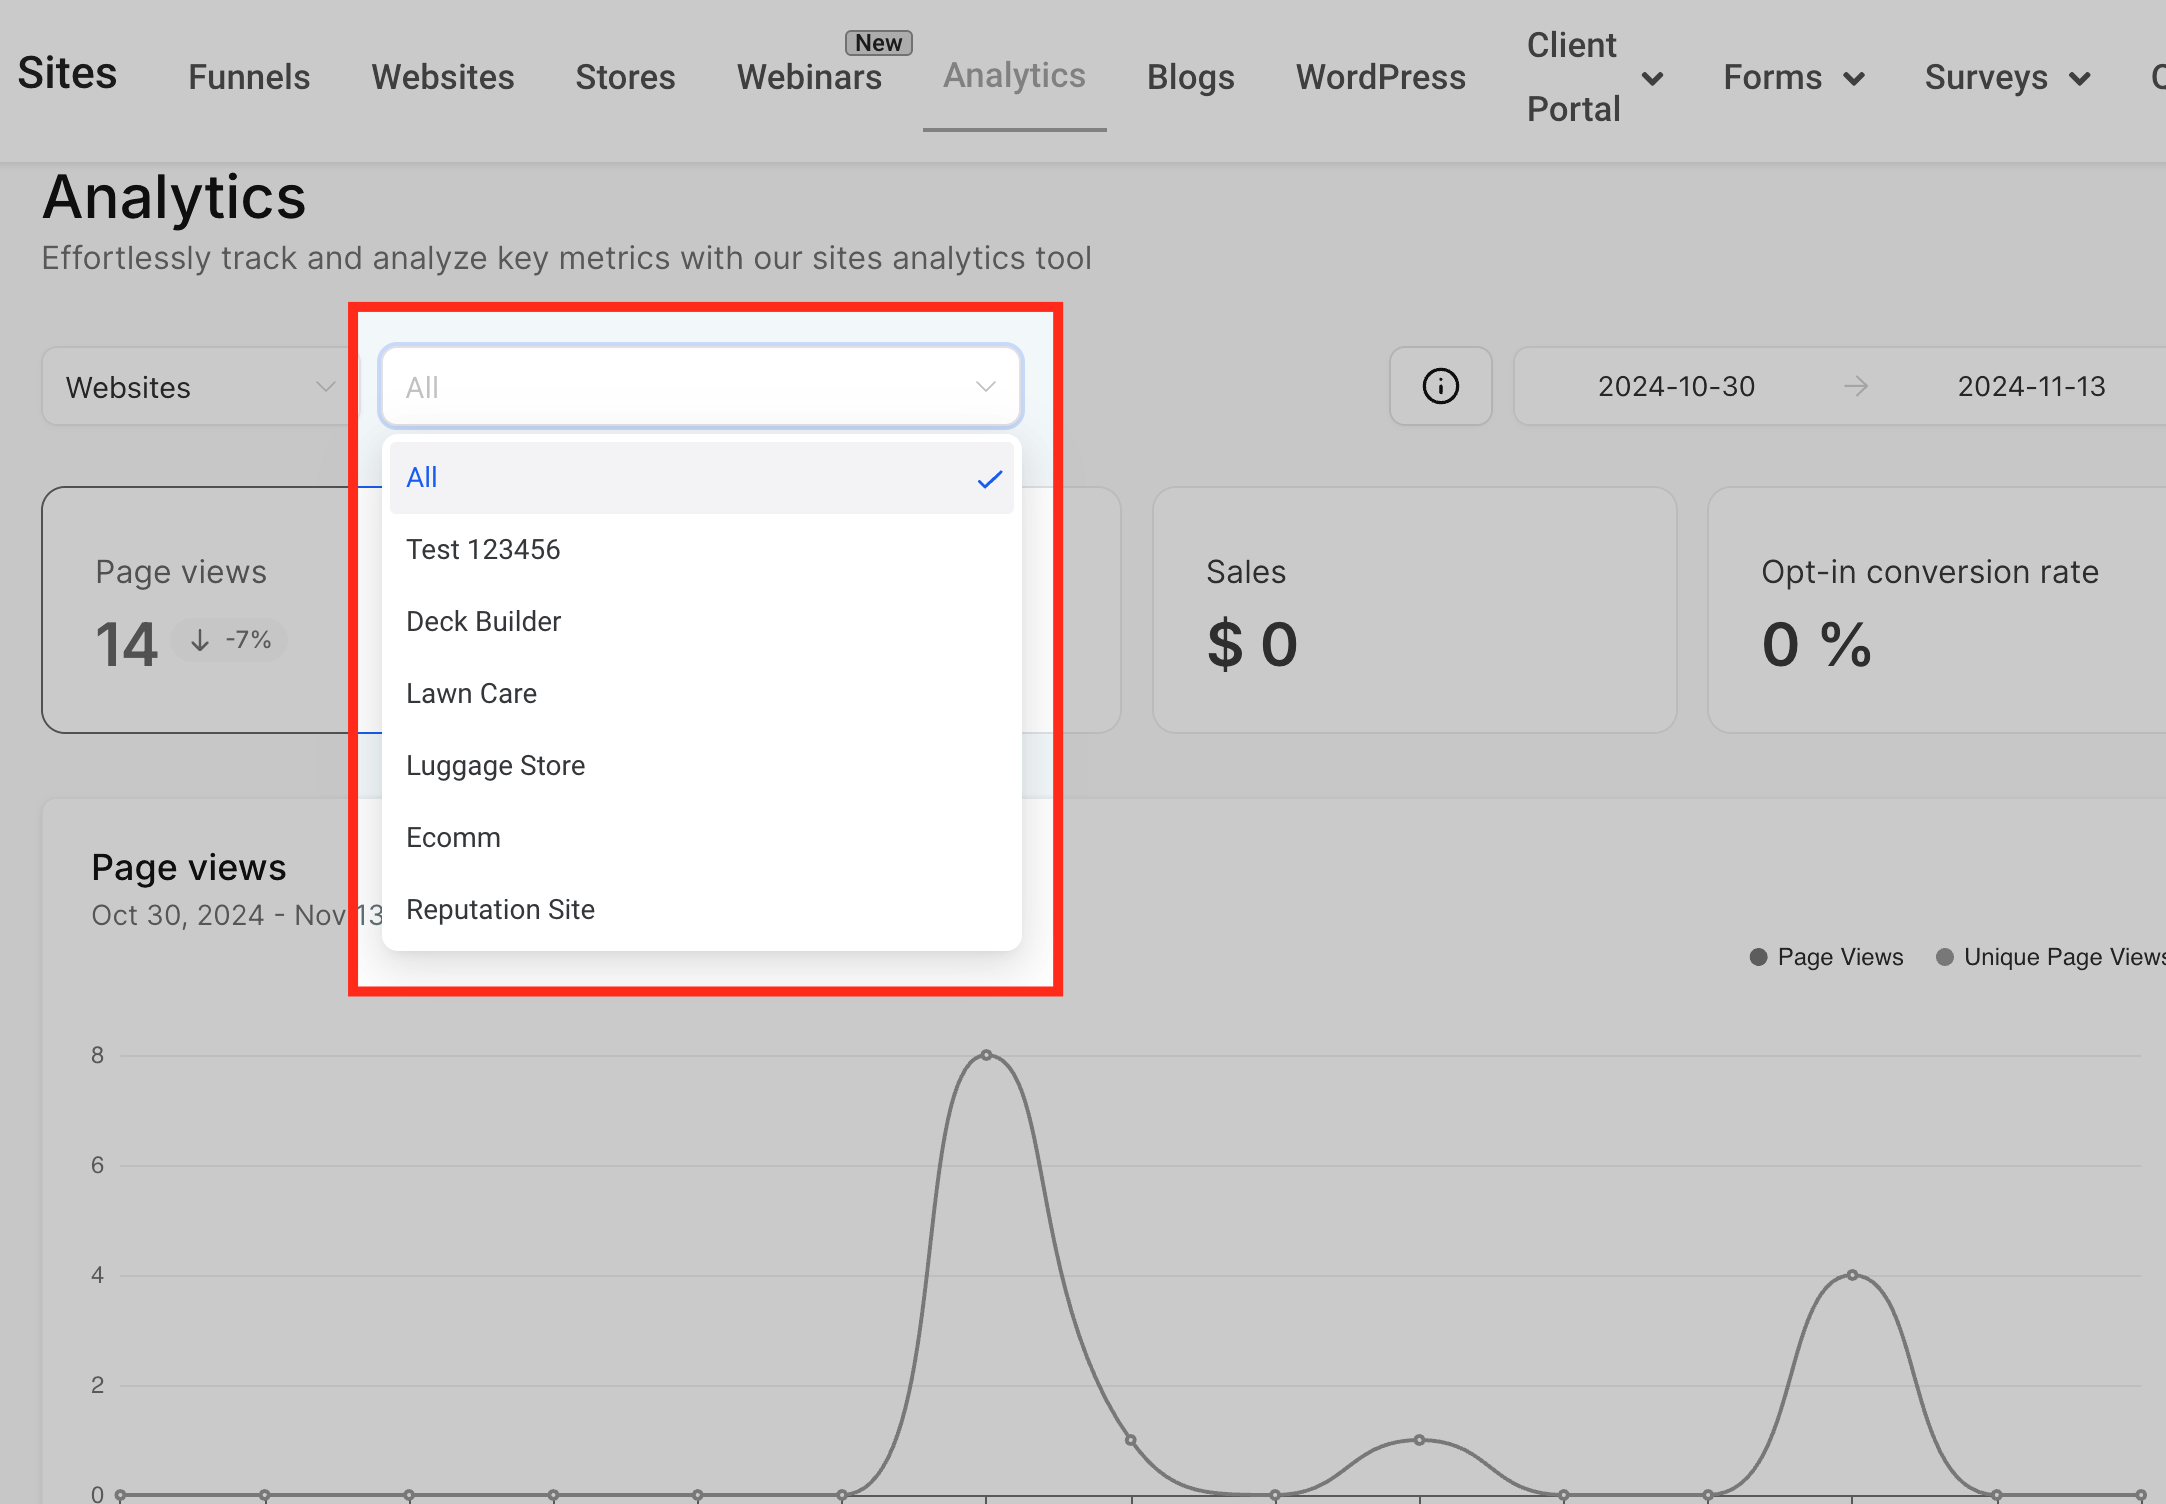
Filters let you refine the data. Choose the Type filter to view data for either funnels or websites. Set a custom date range to limit the time period. Use the Individual filter to focus on a single funnel or website. These options work together so the pie chart reflects exactly the subset you need.
The feature lives alongside the line graph in both the Page View and Sales areas of the analytics dashboard. It provides a visual complement to the numeric tables, helping you spot trends without scrolling through lists.
03How businesses use pie chart visualizations
- Ecommerce store. The owner selects "Website" in the Type filter, chooses the past month as the date range, and narrows to the checkout funnel. The pie chart then shows which checkout steps receive the most views and generate the most sales, guiding layout tweaks.
- Online course platform. The marketing team picks "Funnel" as the Type, selects a specific enrollment funnel, and applies a custom date range. The chart reveals which landing pages drive the majority of enrollments, informing ad spend allocation.
- Local service business. The manager filters by "Website", sets the date range to the last quarter, and selects the homepage step. The pie chart displays the proportion of page views versus sales for that step, helping assess the homepage's effectiveness.
04How to set up and use pie chart visualizations in HighLevel
Use pie chart visualization
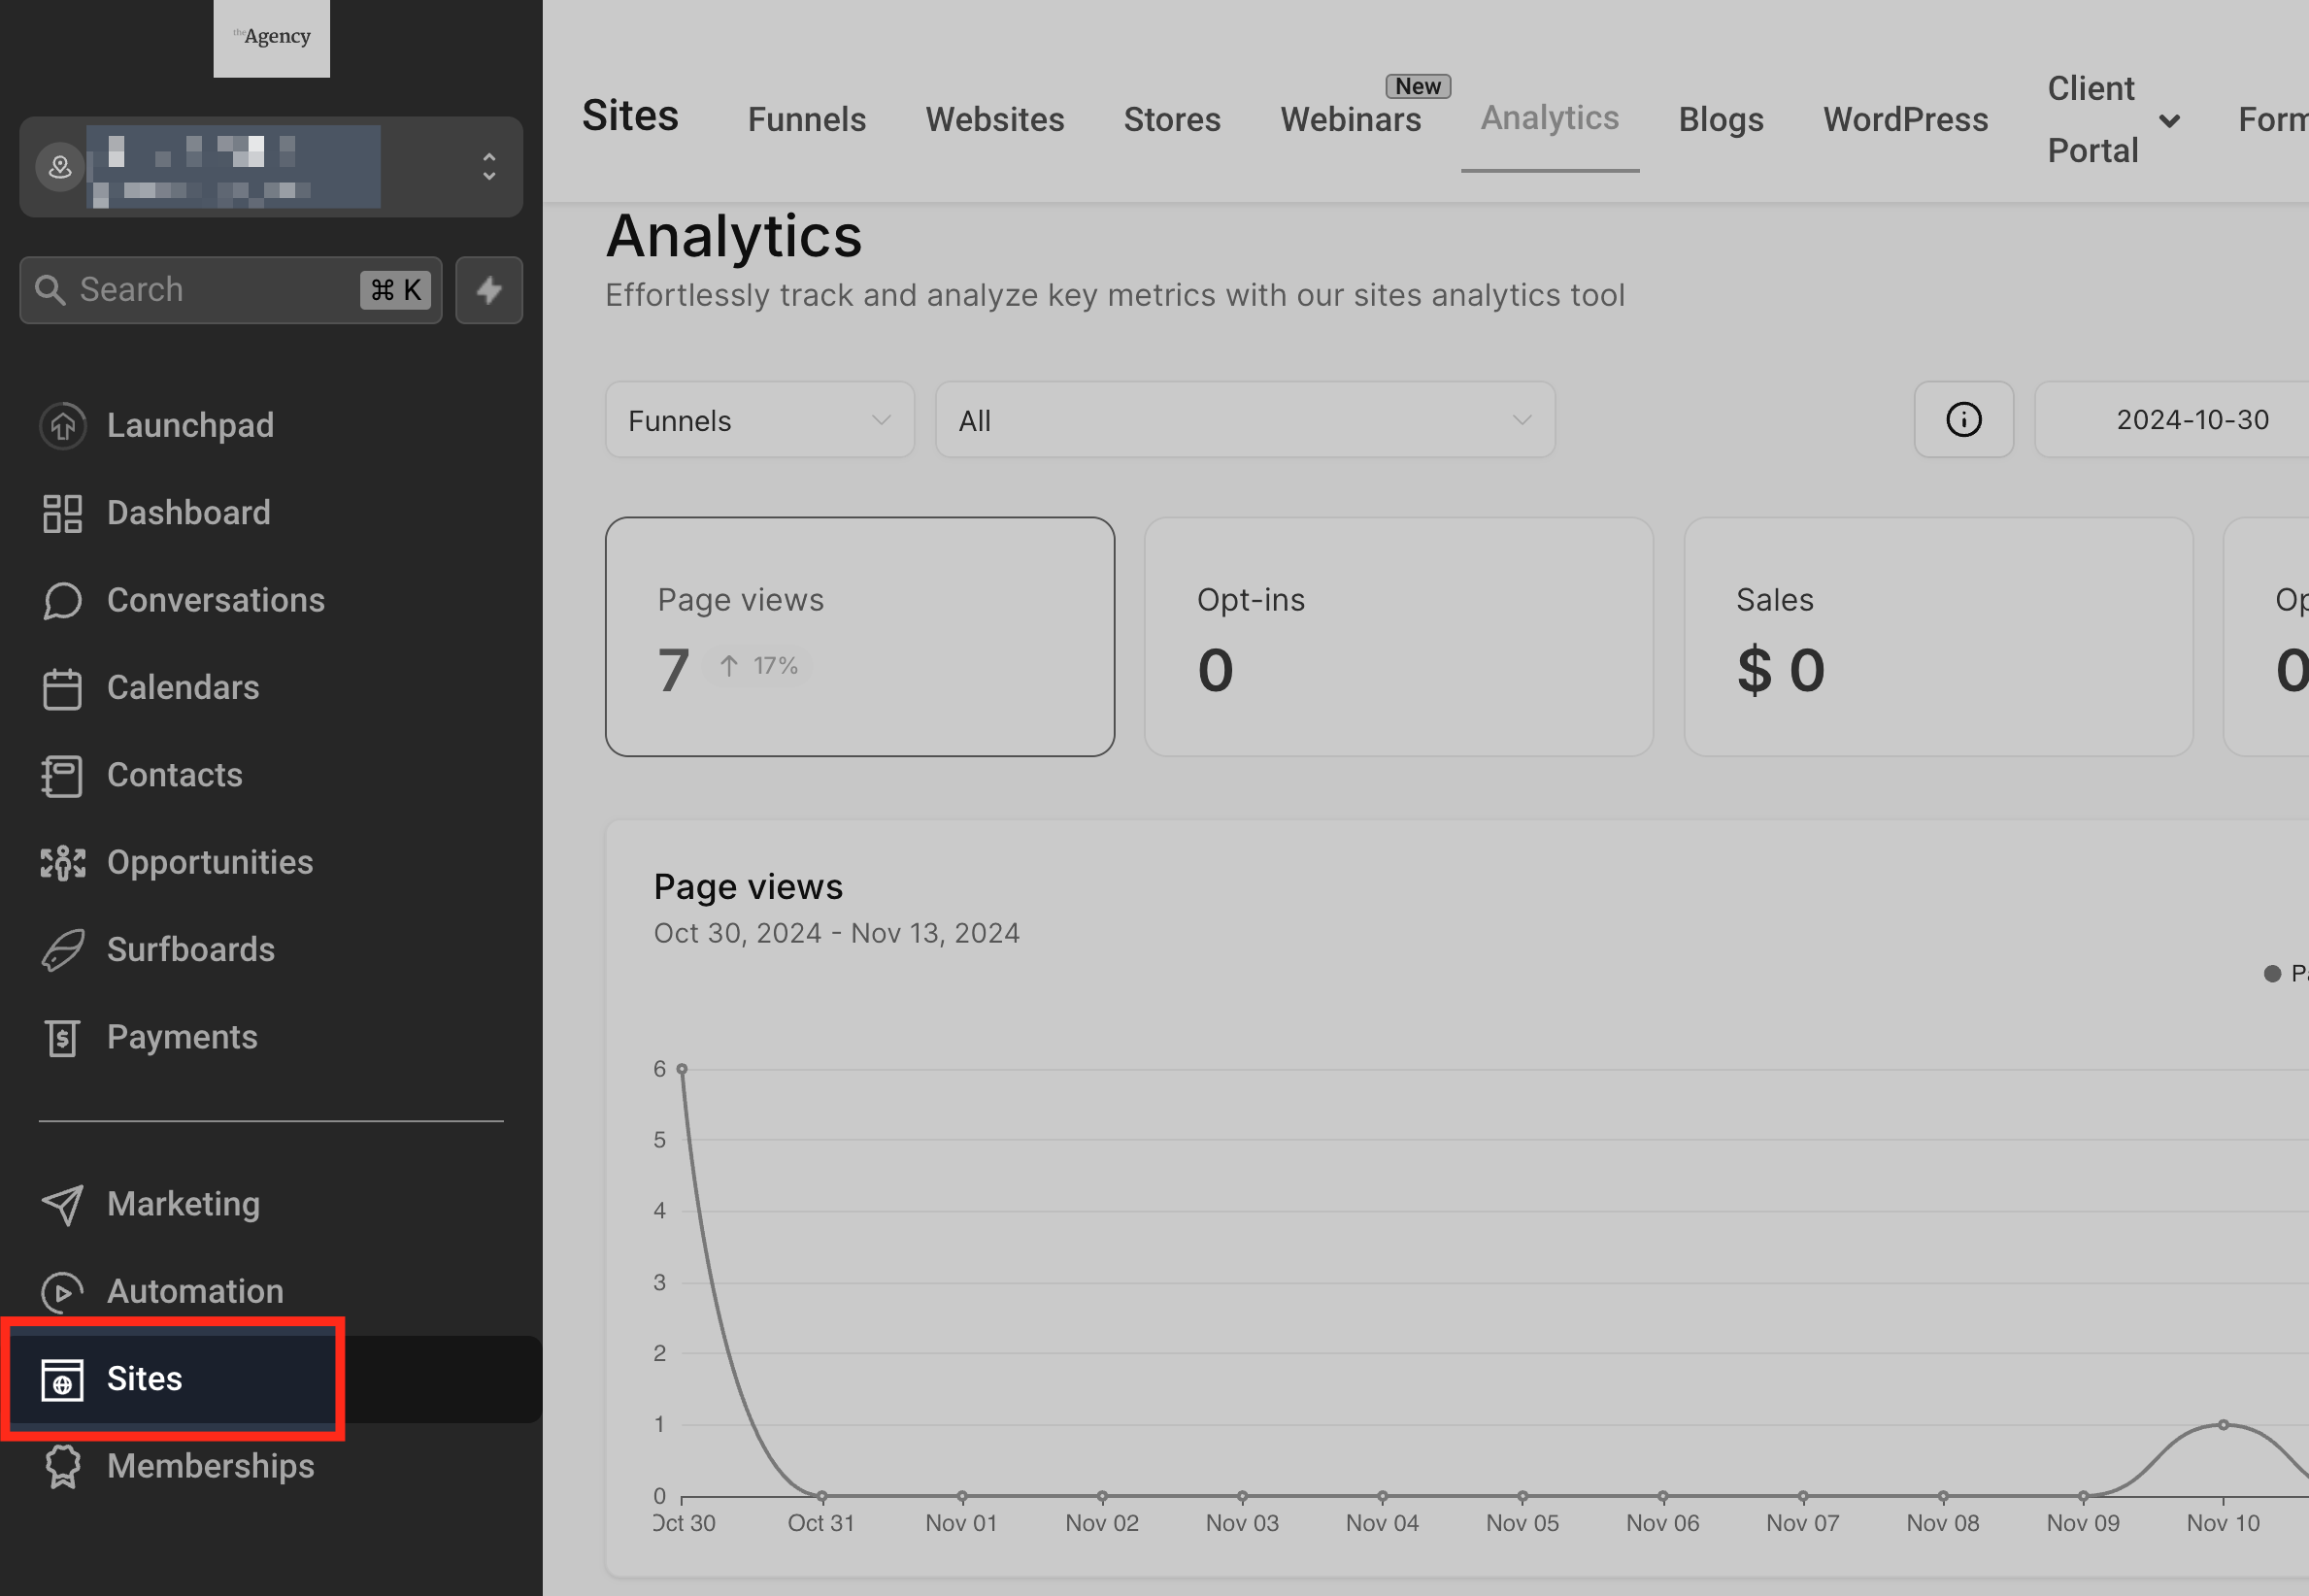
- Open the subaccount and click Sites in the left sidebar.
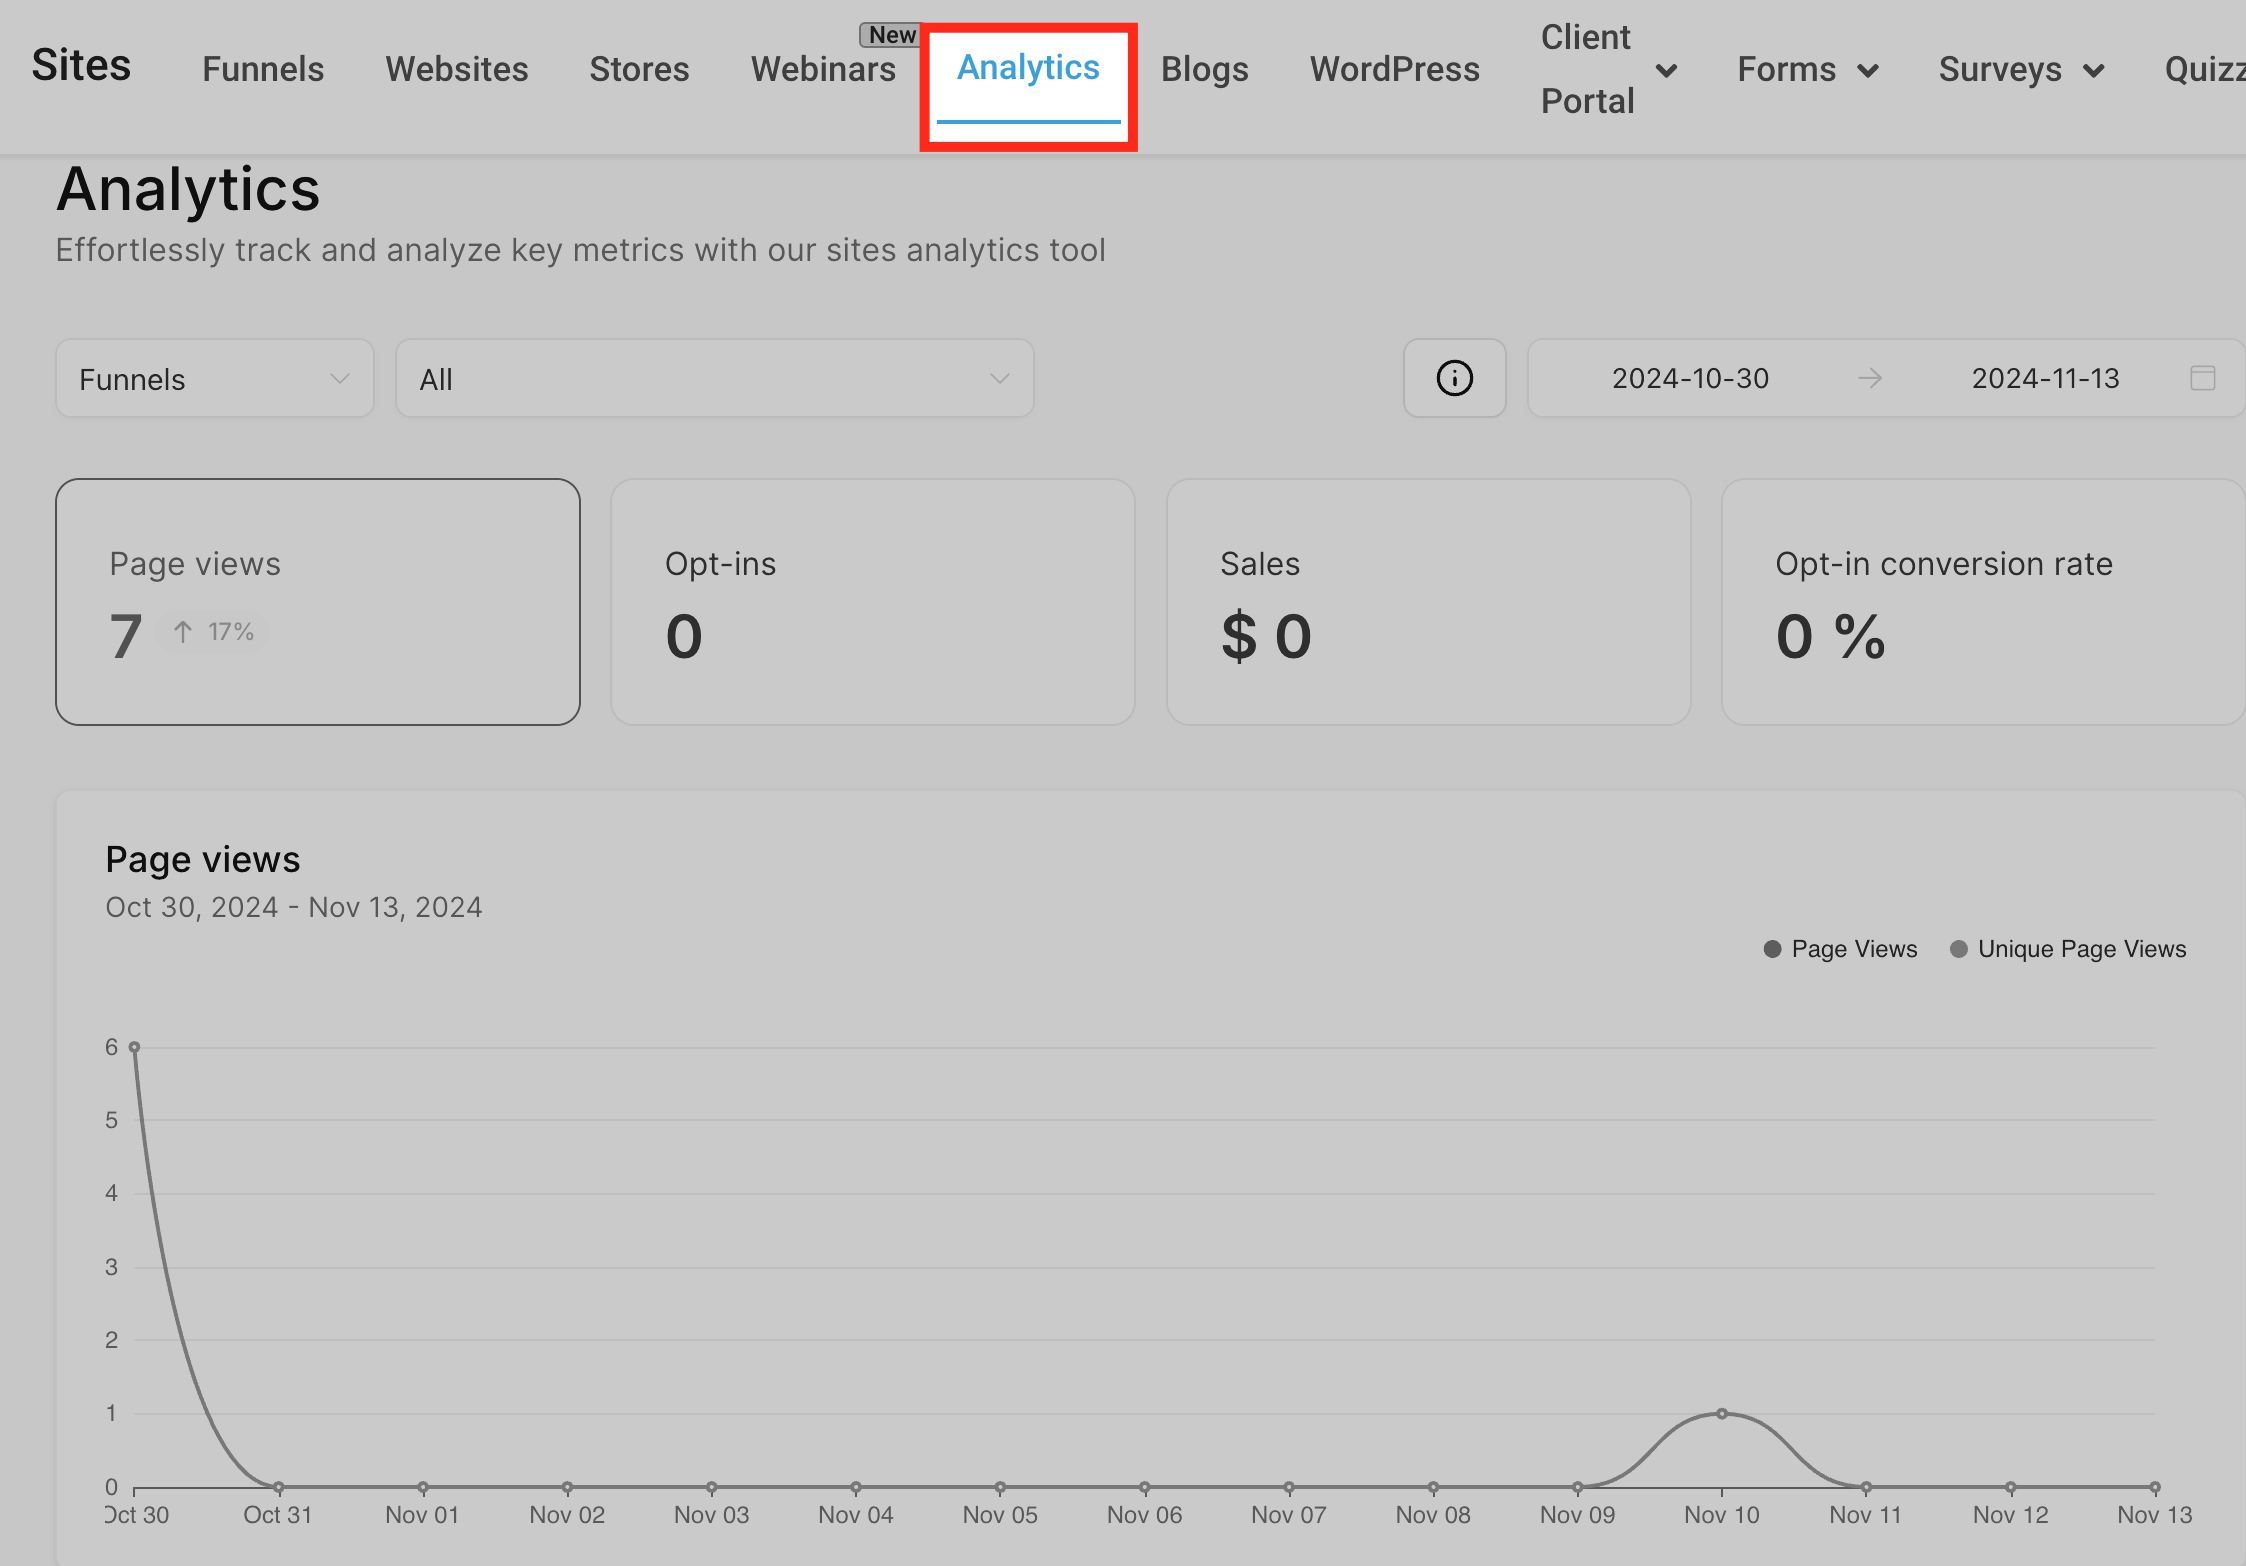
- In the Sites view, select the Analytics tab.
- Find the pie chart card located under the line graph in the Page View section.
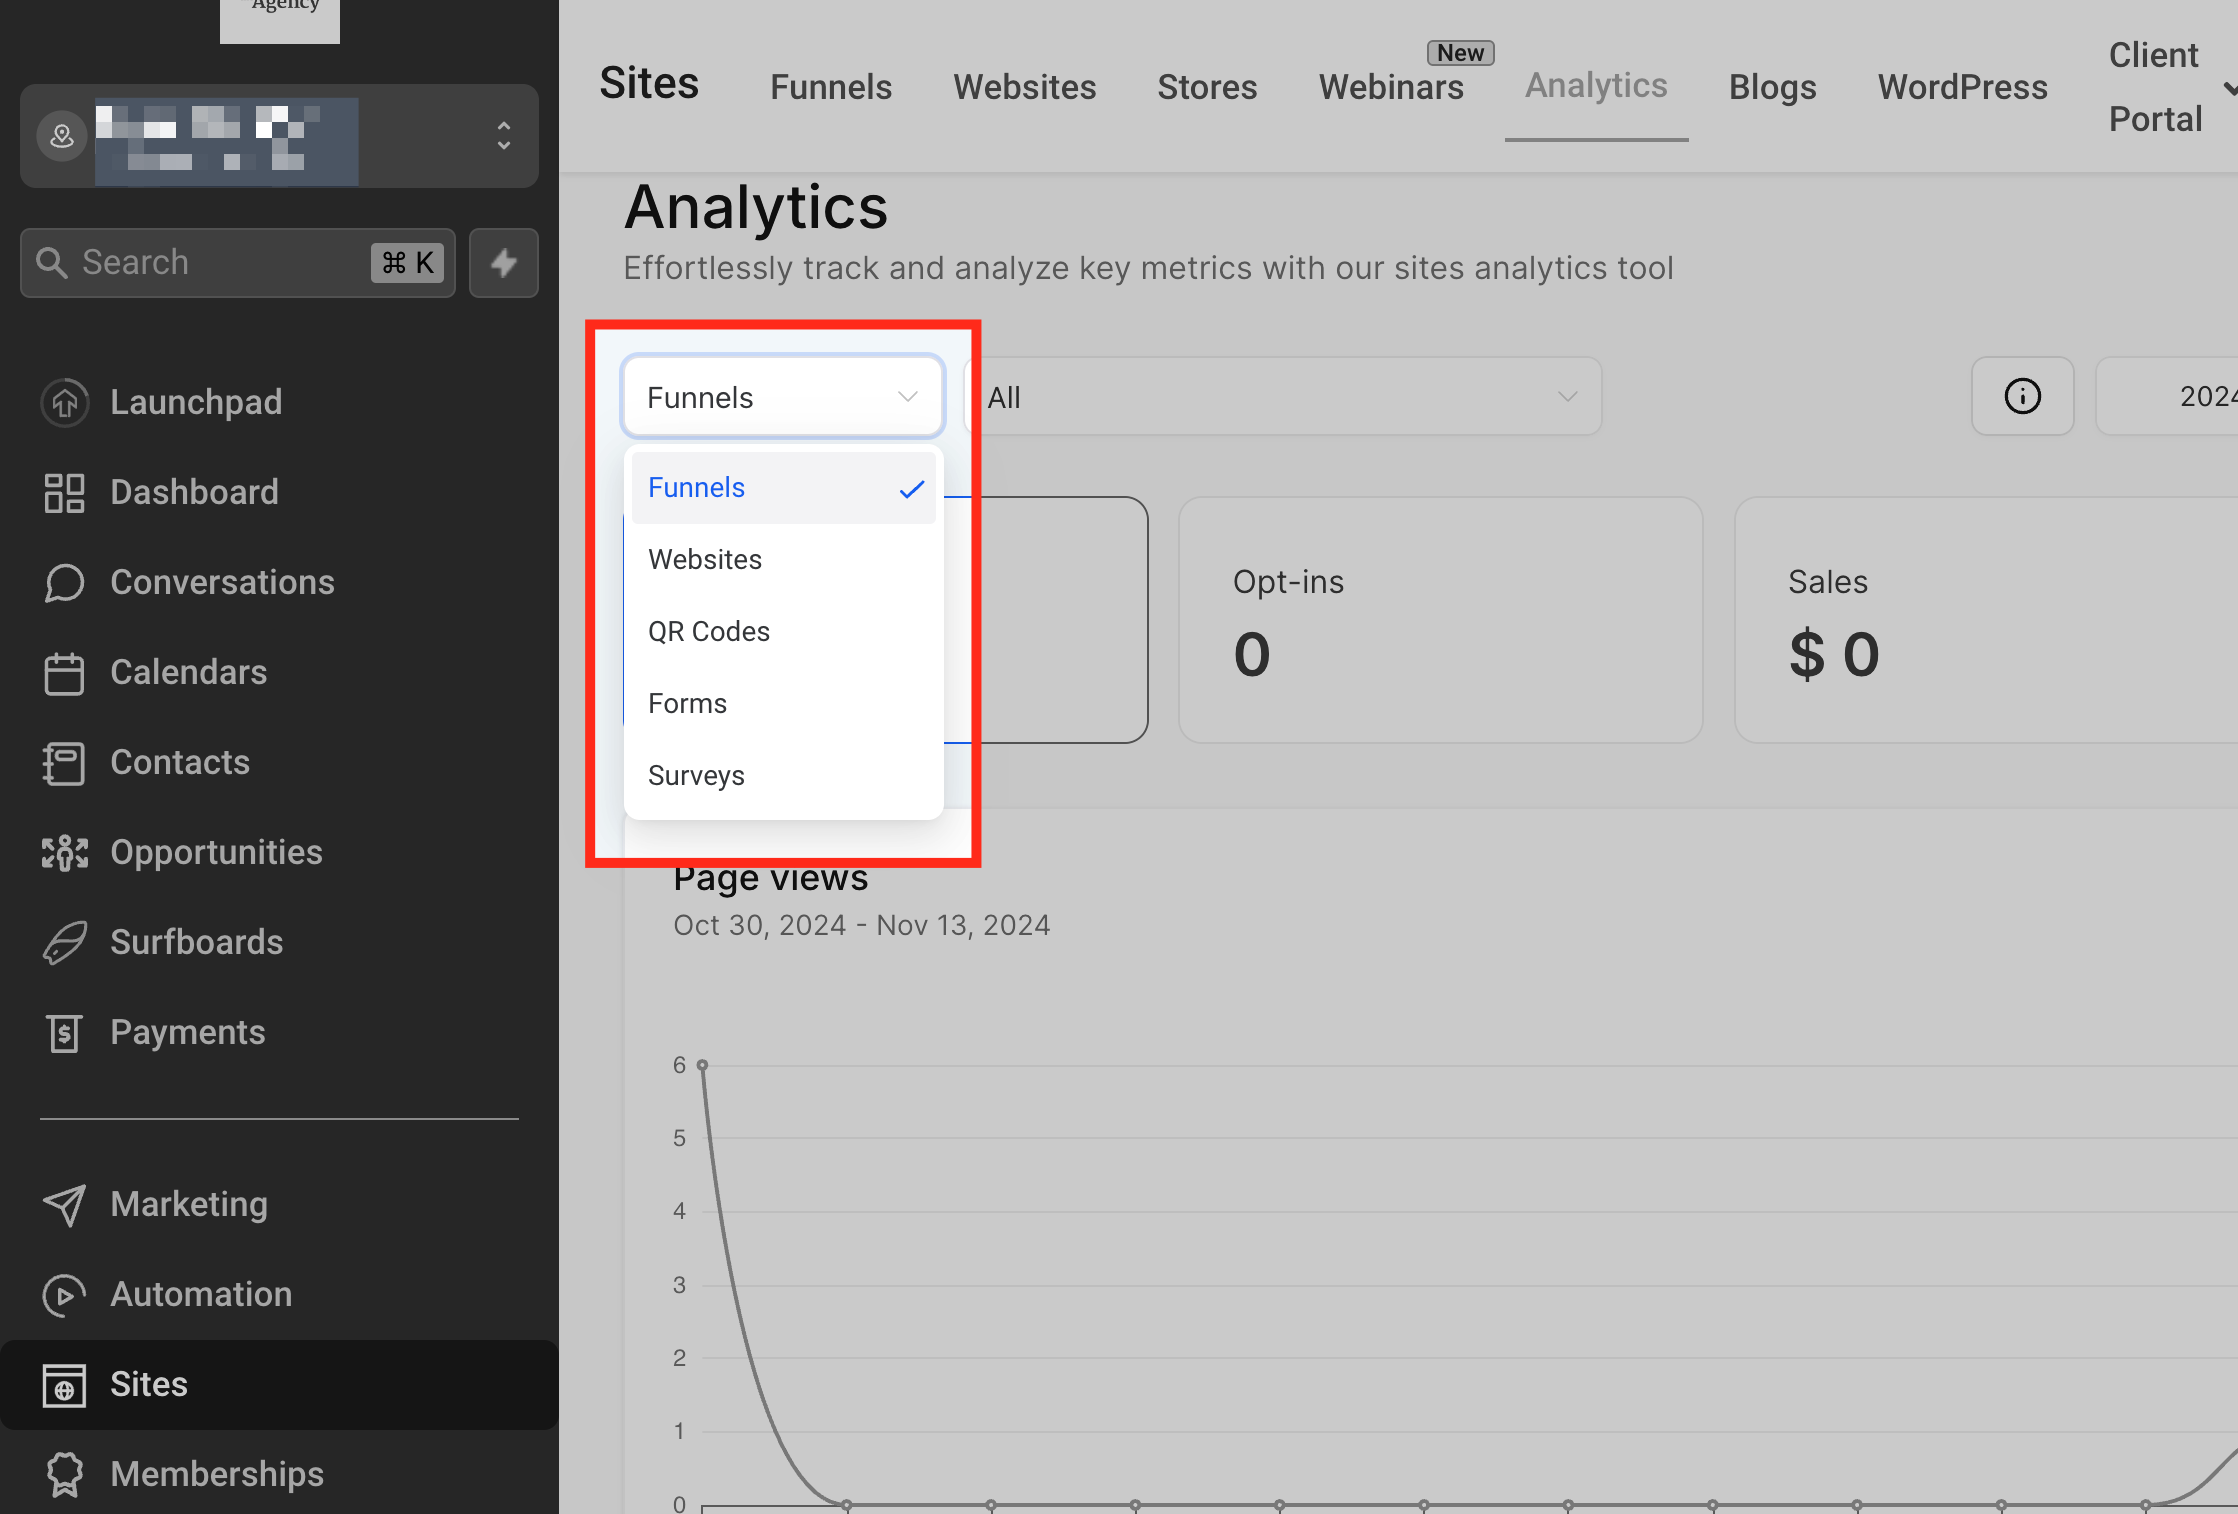
- Click the Type dropdown and choose Funnel or Website.
- Choose the desired date range from the Date Range selector.
- Pick a specific funnel or website from the Individual filter to narrow the view.
05What it looks like in HighLevel
06Settings that matter
- Type. Controls whether the chart shows data for funnels or for websites.
- Date Range. Limits the chart data to the selected start and end dates.
- Individual Funnel or Website. Filters the chart to a single funnel or a single website for detailed insight.
07How it connects to the rest of HighLevel
- Explore traffic source analytics for additional context Traffic source analytics
- See geographic breakdowns of funnel visitors Geographic analytics
- Use advanced filters to further refine site data Advanced filters
Michael's take

Wondering if a visual breakdown of your funnel data is worth the effort? The pie chart provides a visual view of where traffic and revenue are coming from, so you can spot hot spots without digging through rows of numbers.