
01Who this is for
- Founders of SaaS startups who need to see which onboarding pages keep users engaged.
- Digital marketers managing multiple webinars and want quick insight into audience attention.
- Ecommerce owners looking to spot pages where visitors leave quickly to improve conversion.
02Average Time in Site Analytics, explained
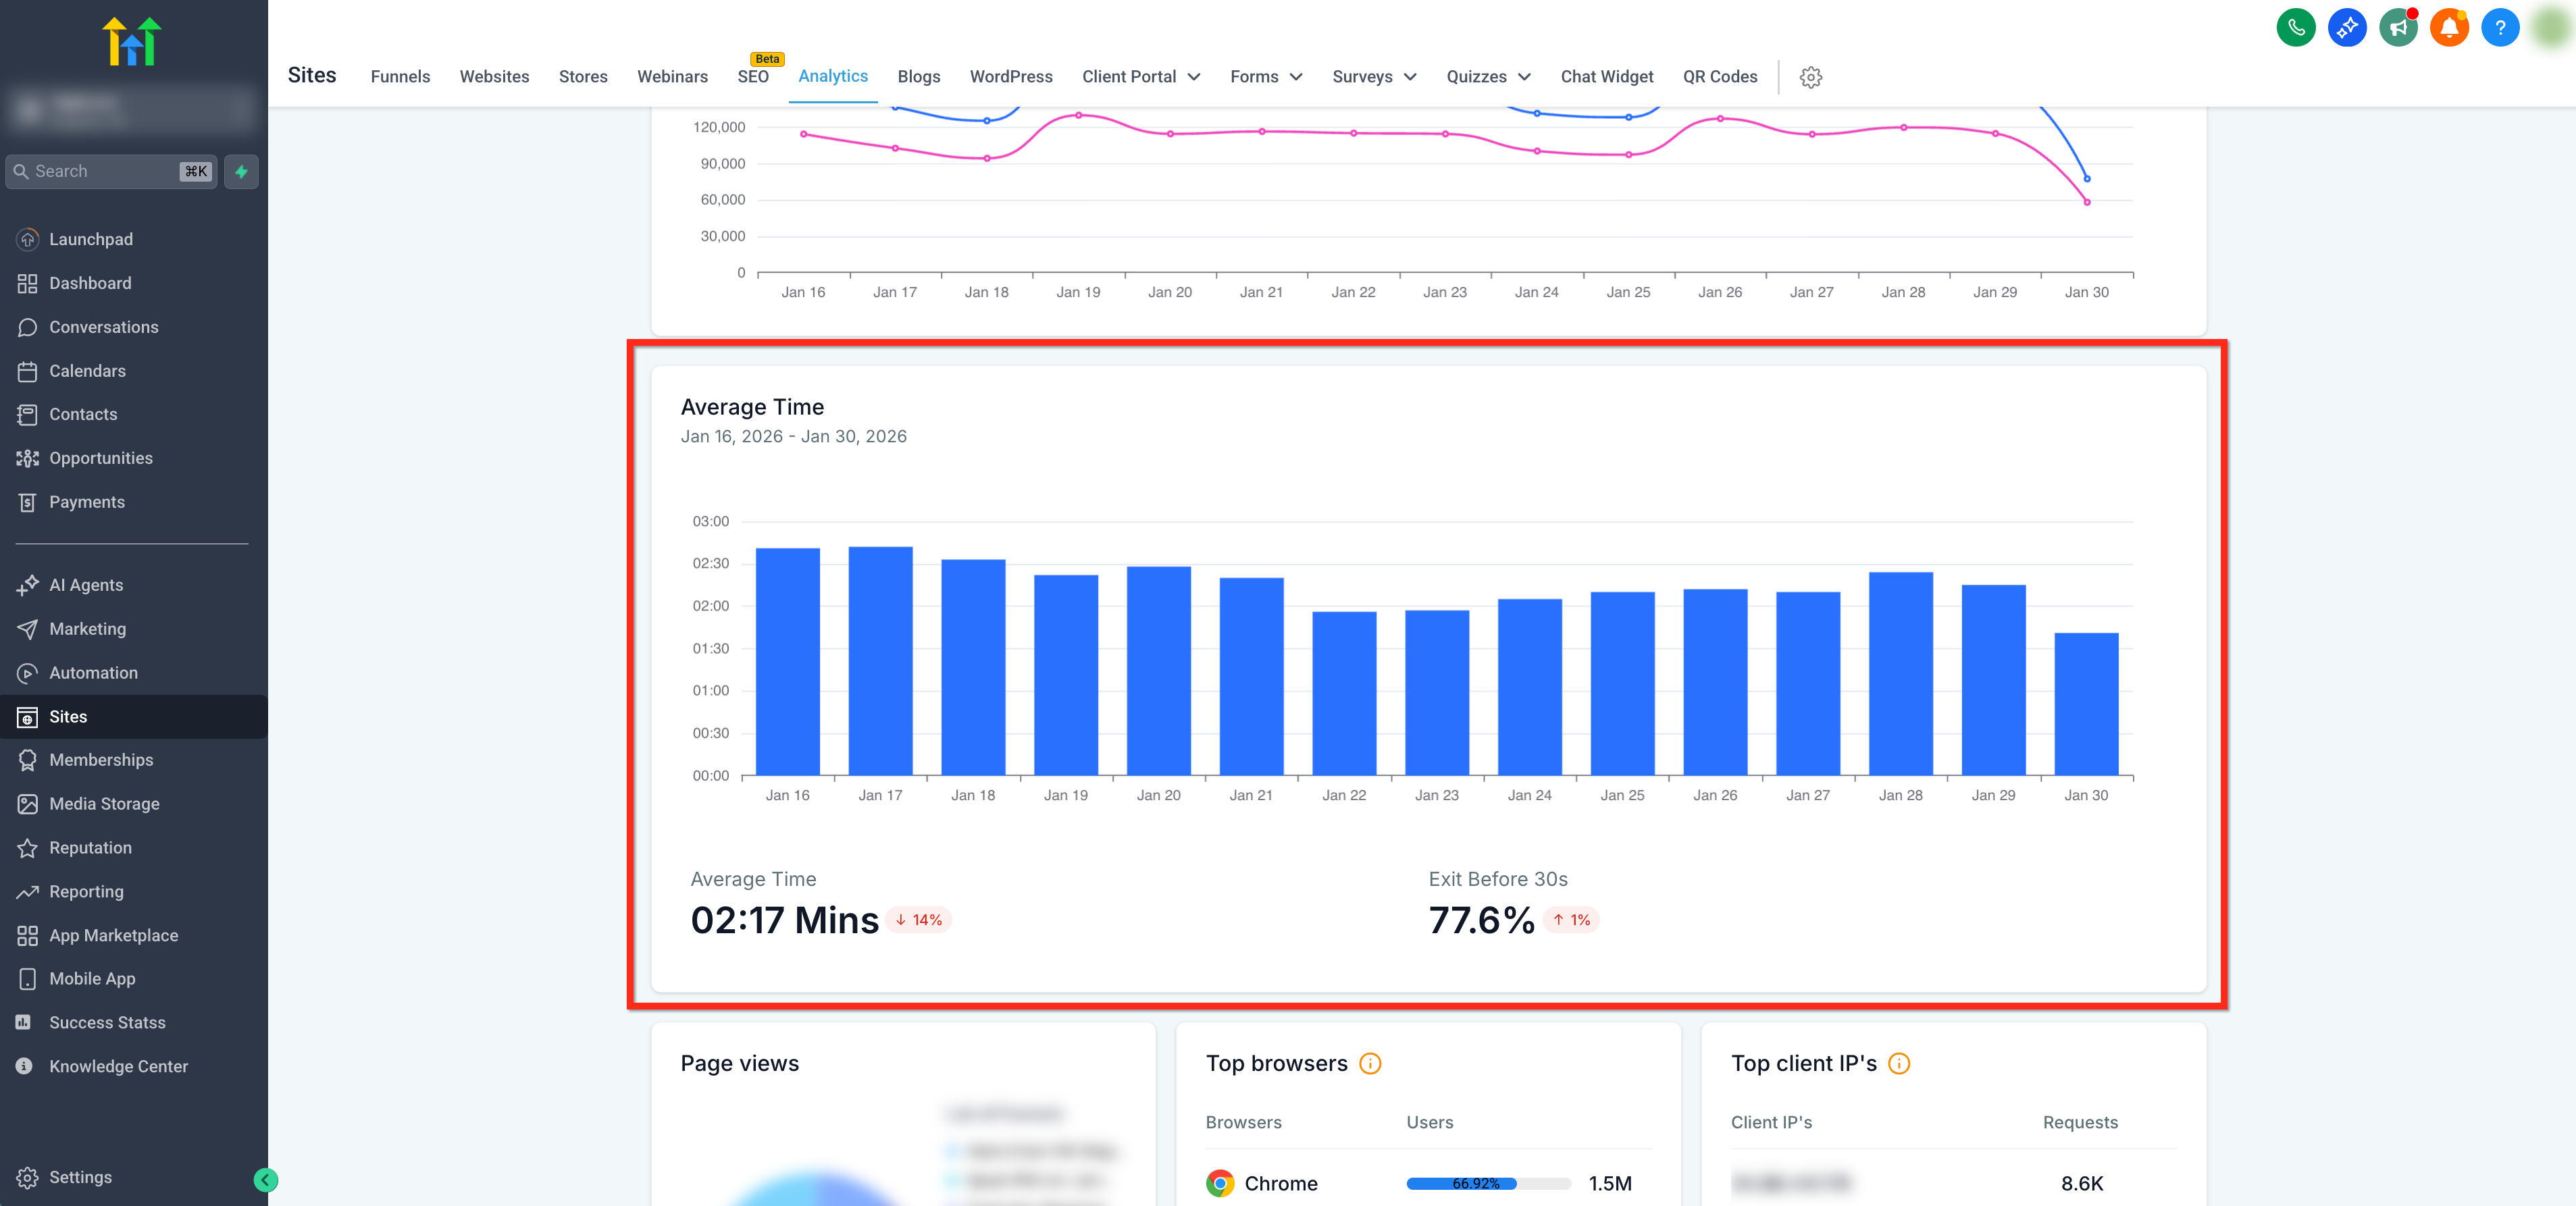
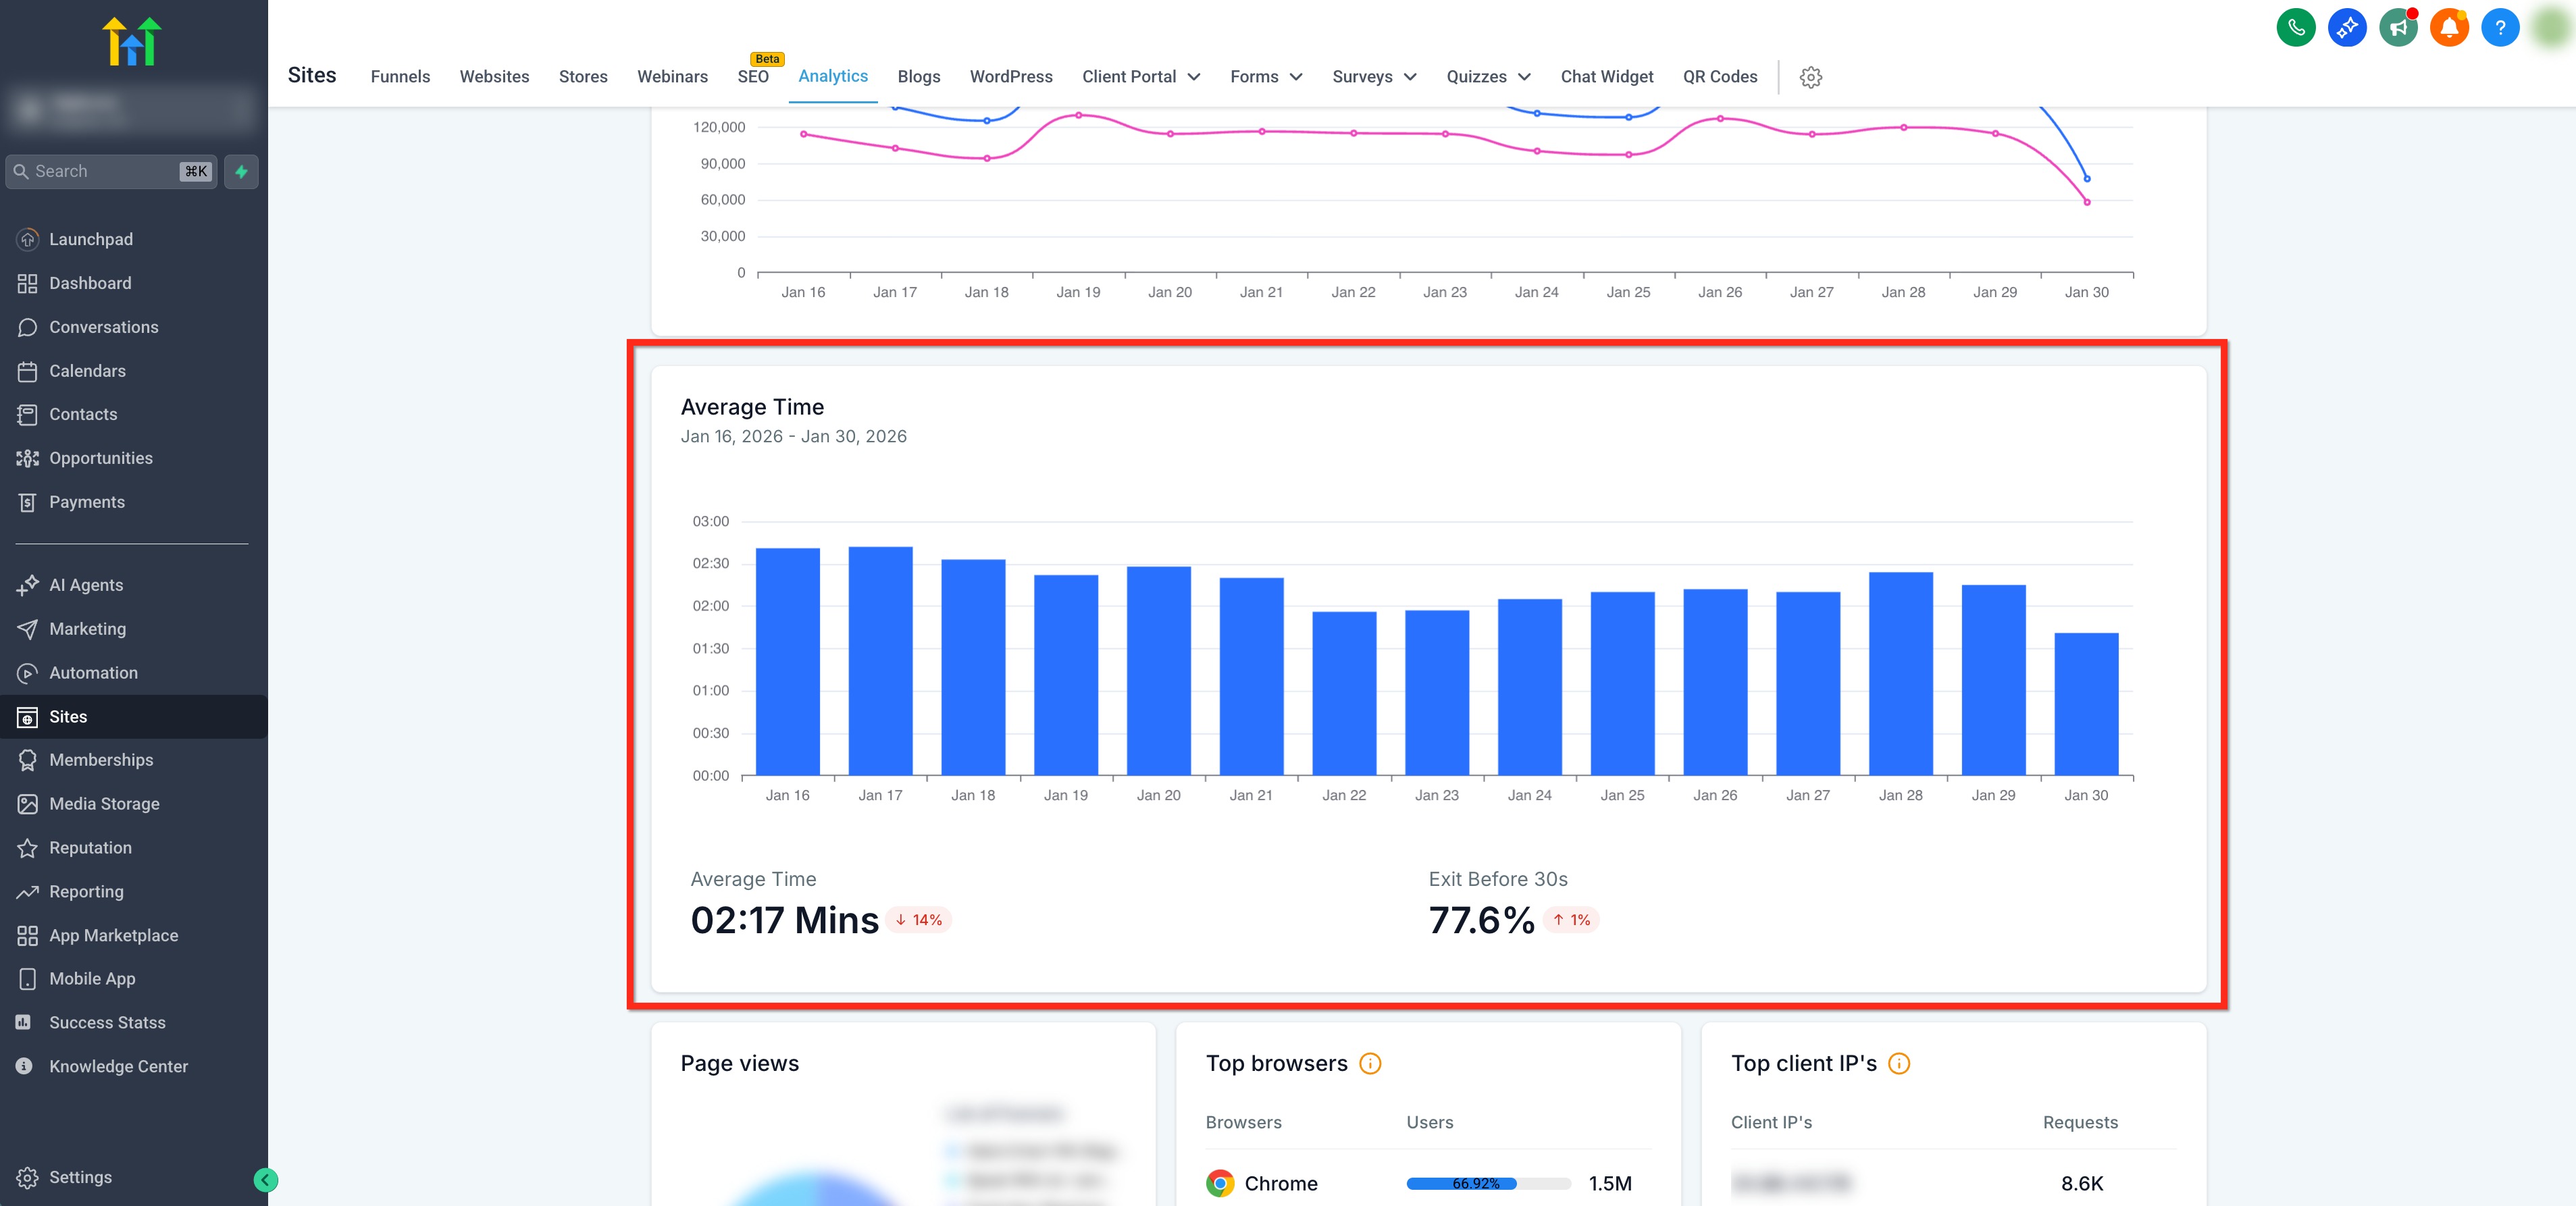
The feature adds a dedicated view to the Sites > Analytics section where the platform calculates the average active time per visit for the chosen date range. It also shows the percentage of visits that exit before 30 seconds, giving a quick sense of bounce behavior.
The metric counts each visit independently and removes ultra short sessions under two seconds to avoid noise. Inactive time on idle tabs is capped so it does not inflate the average duration.
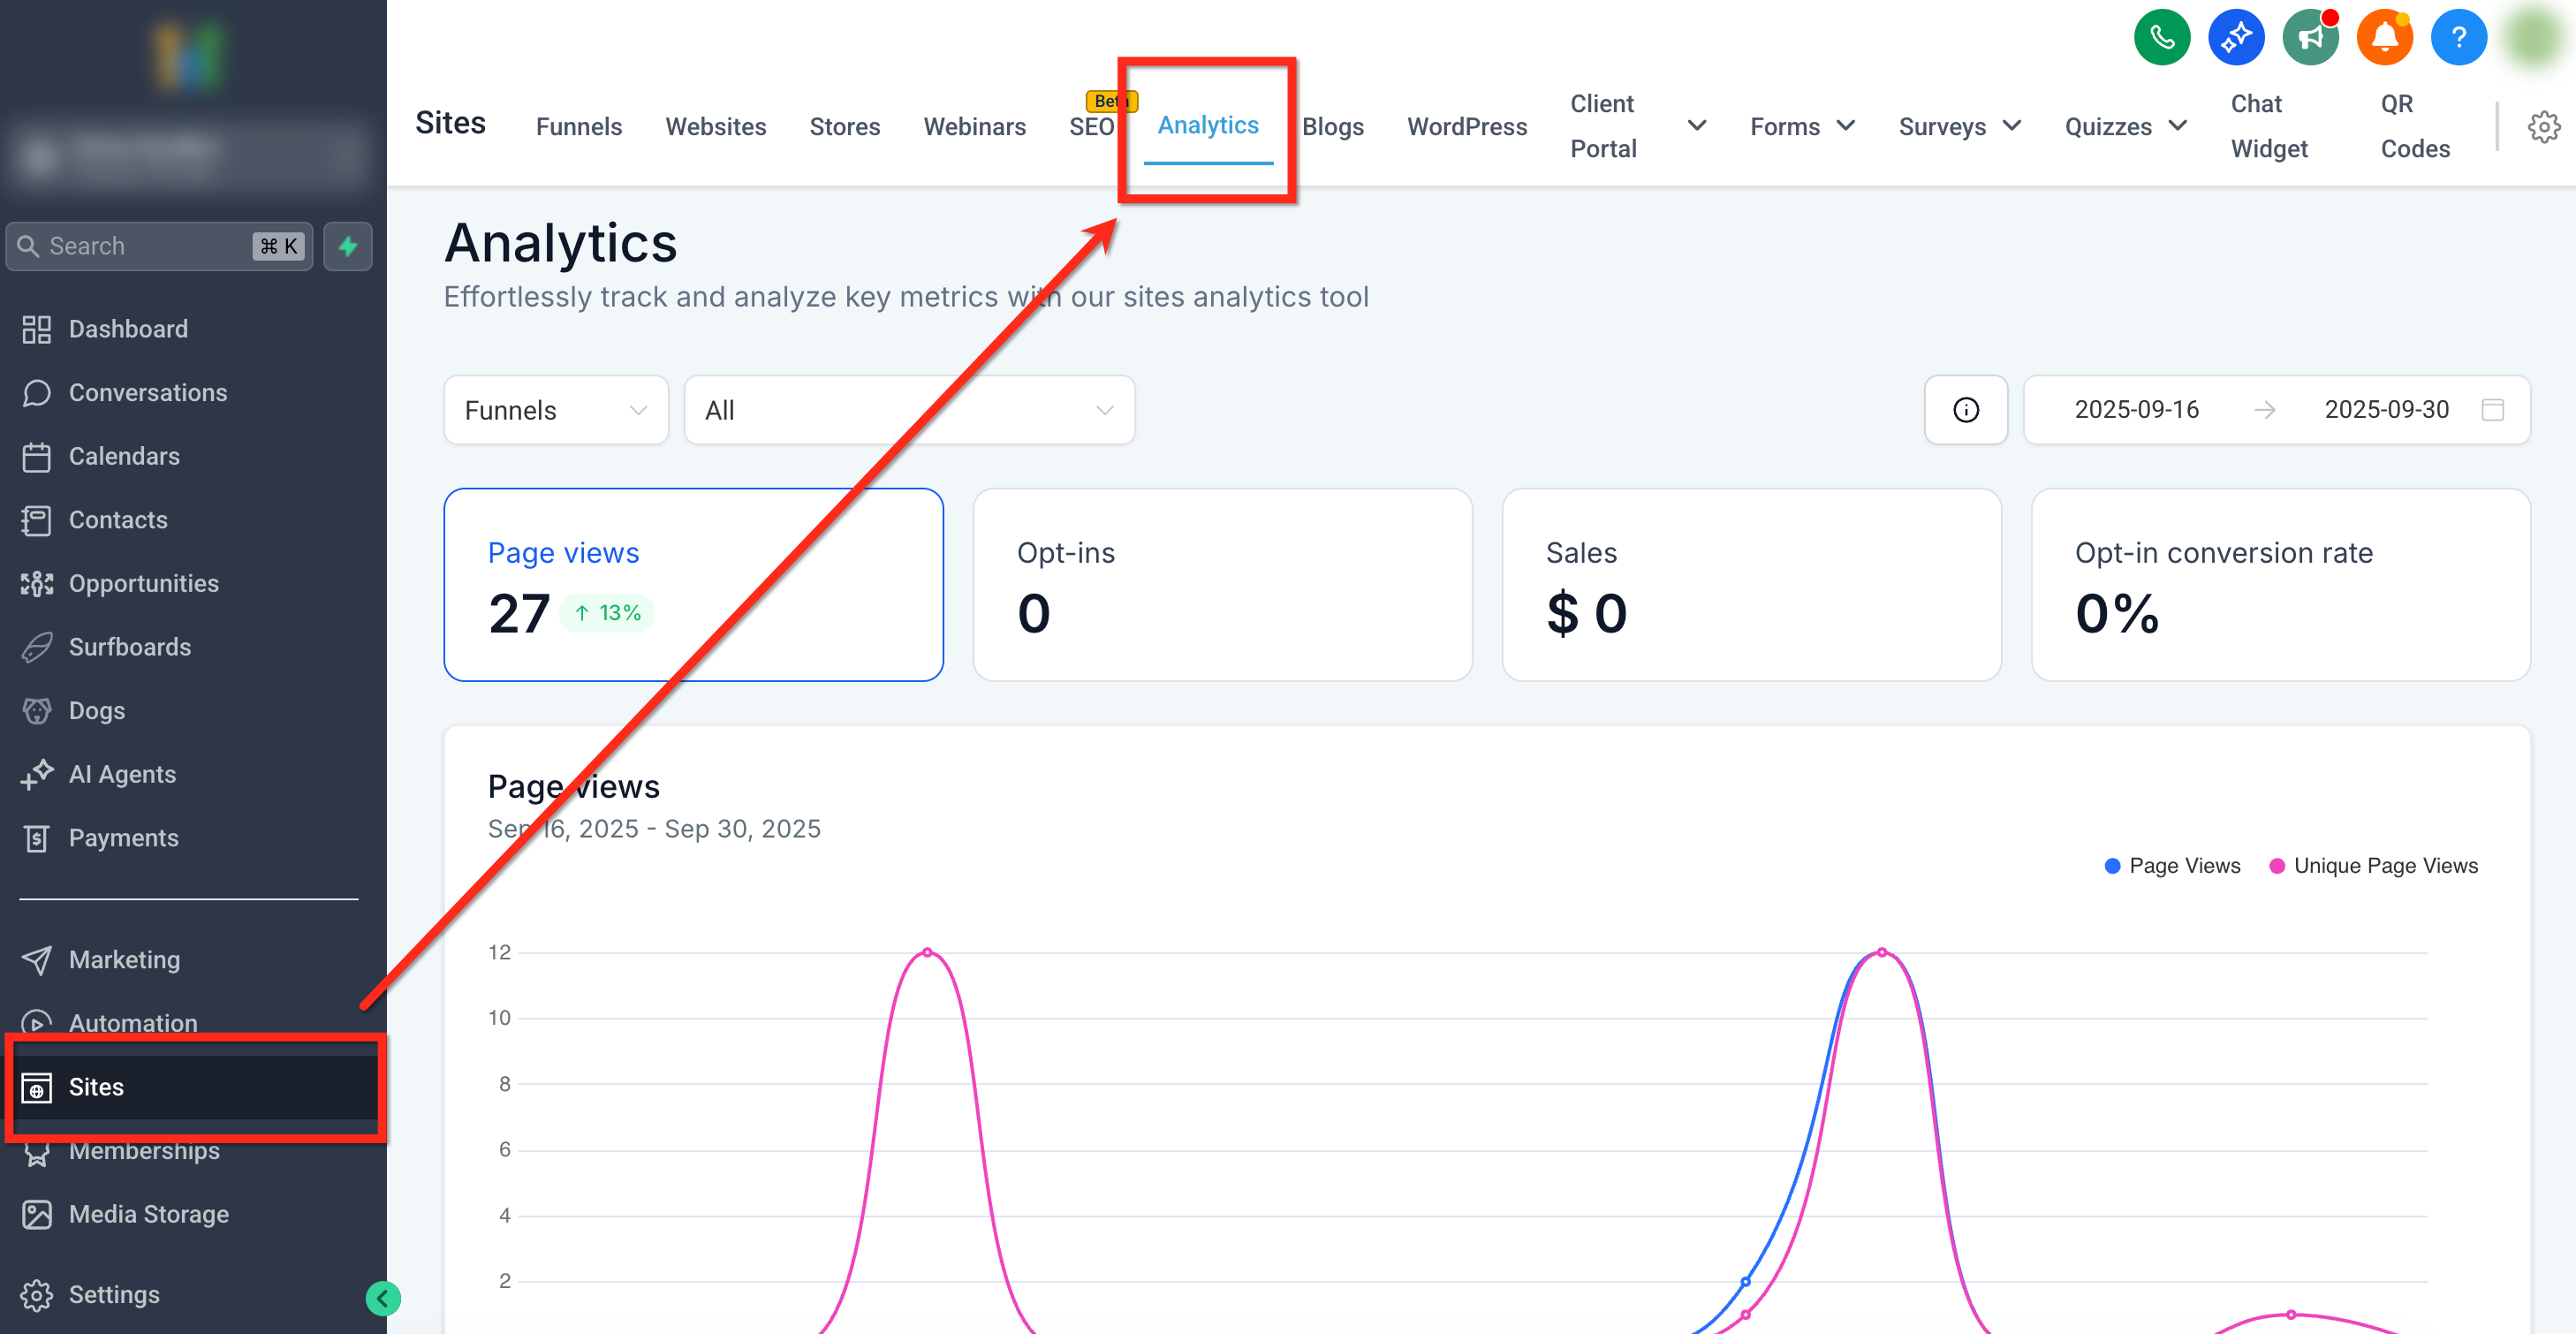
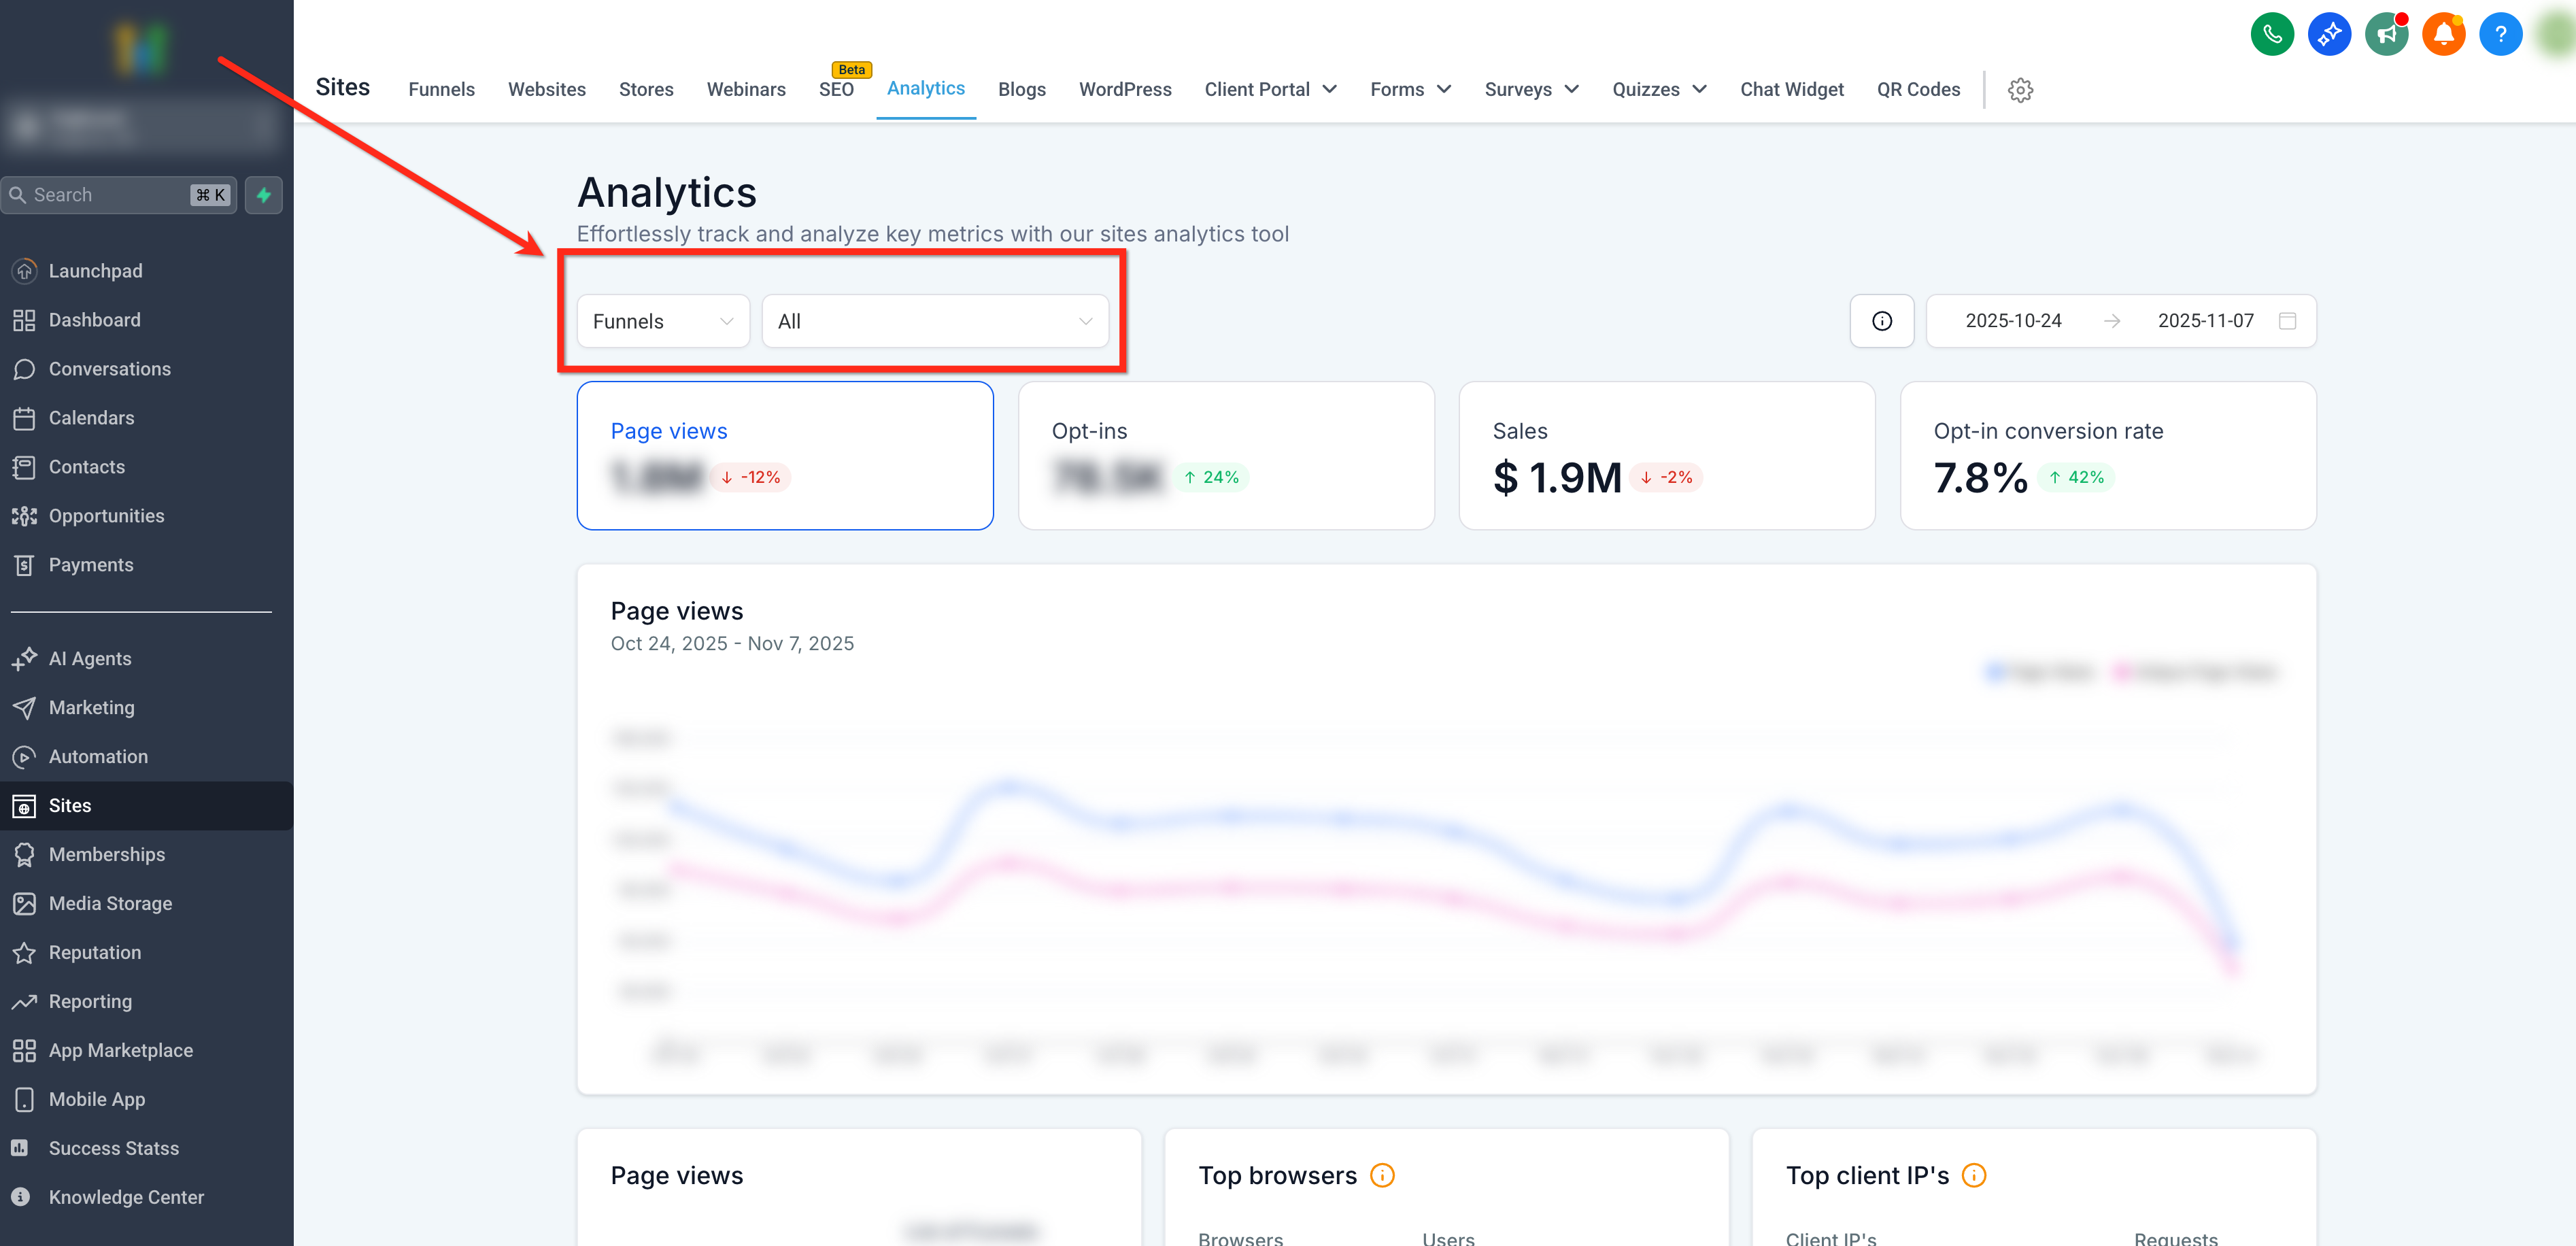
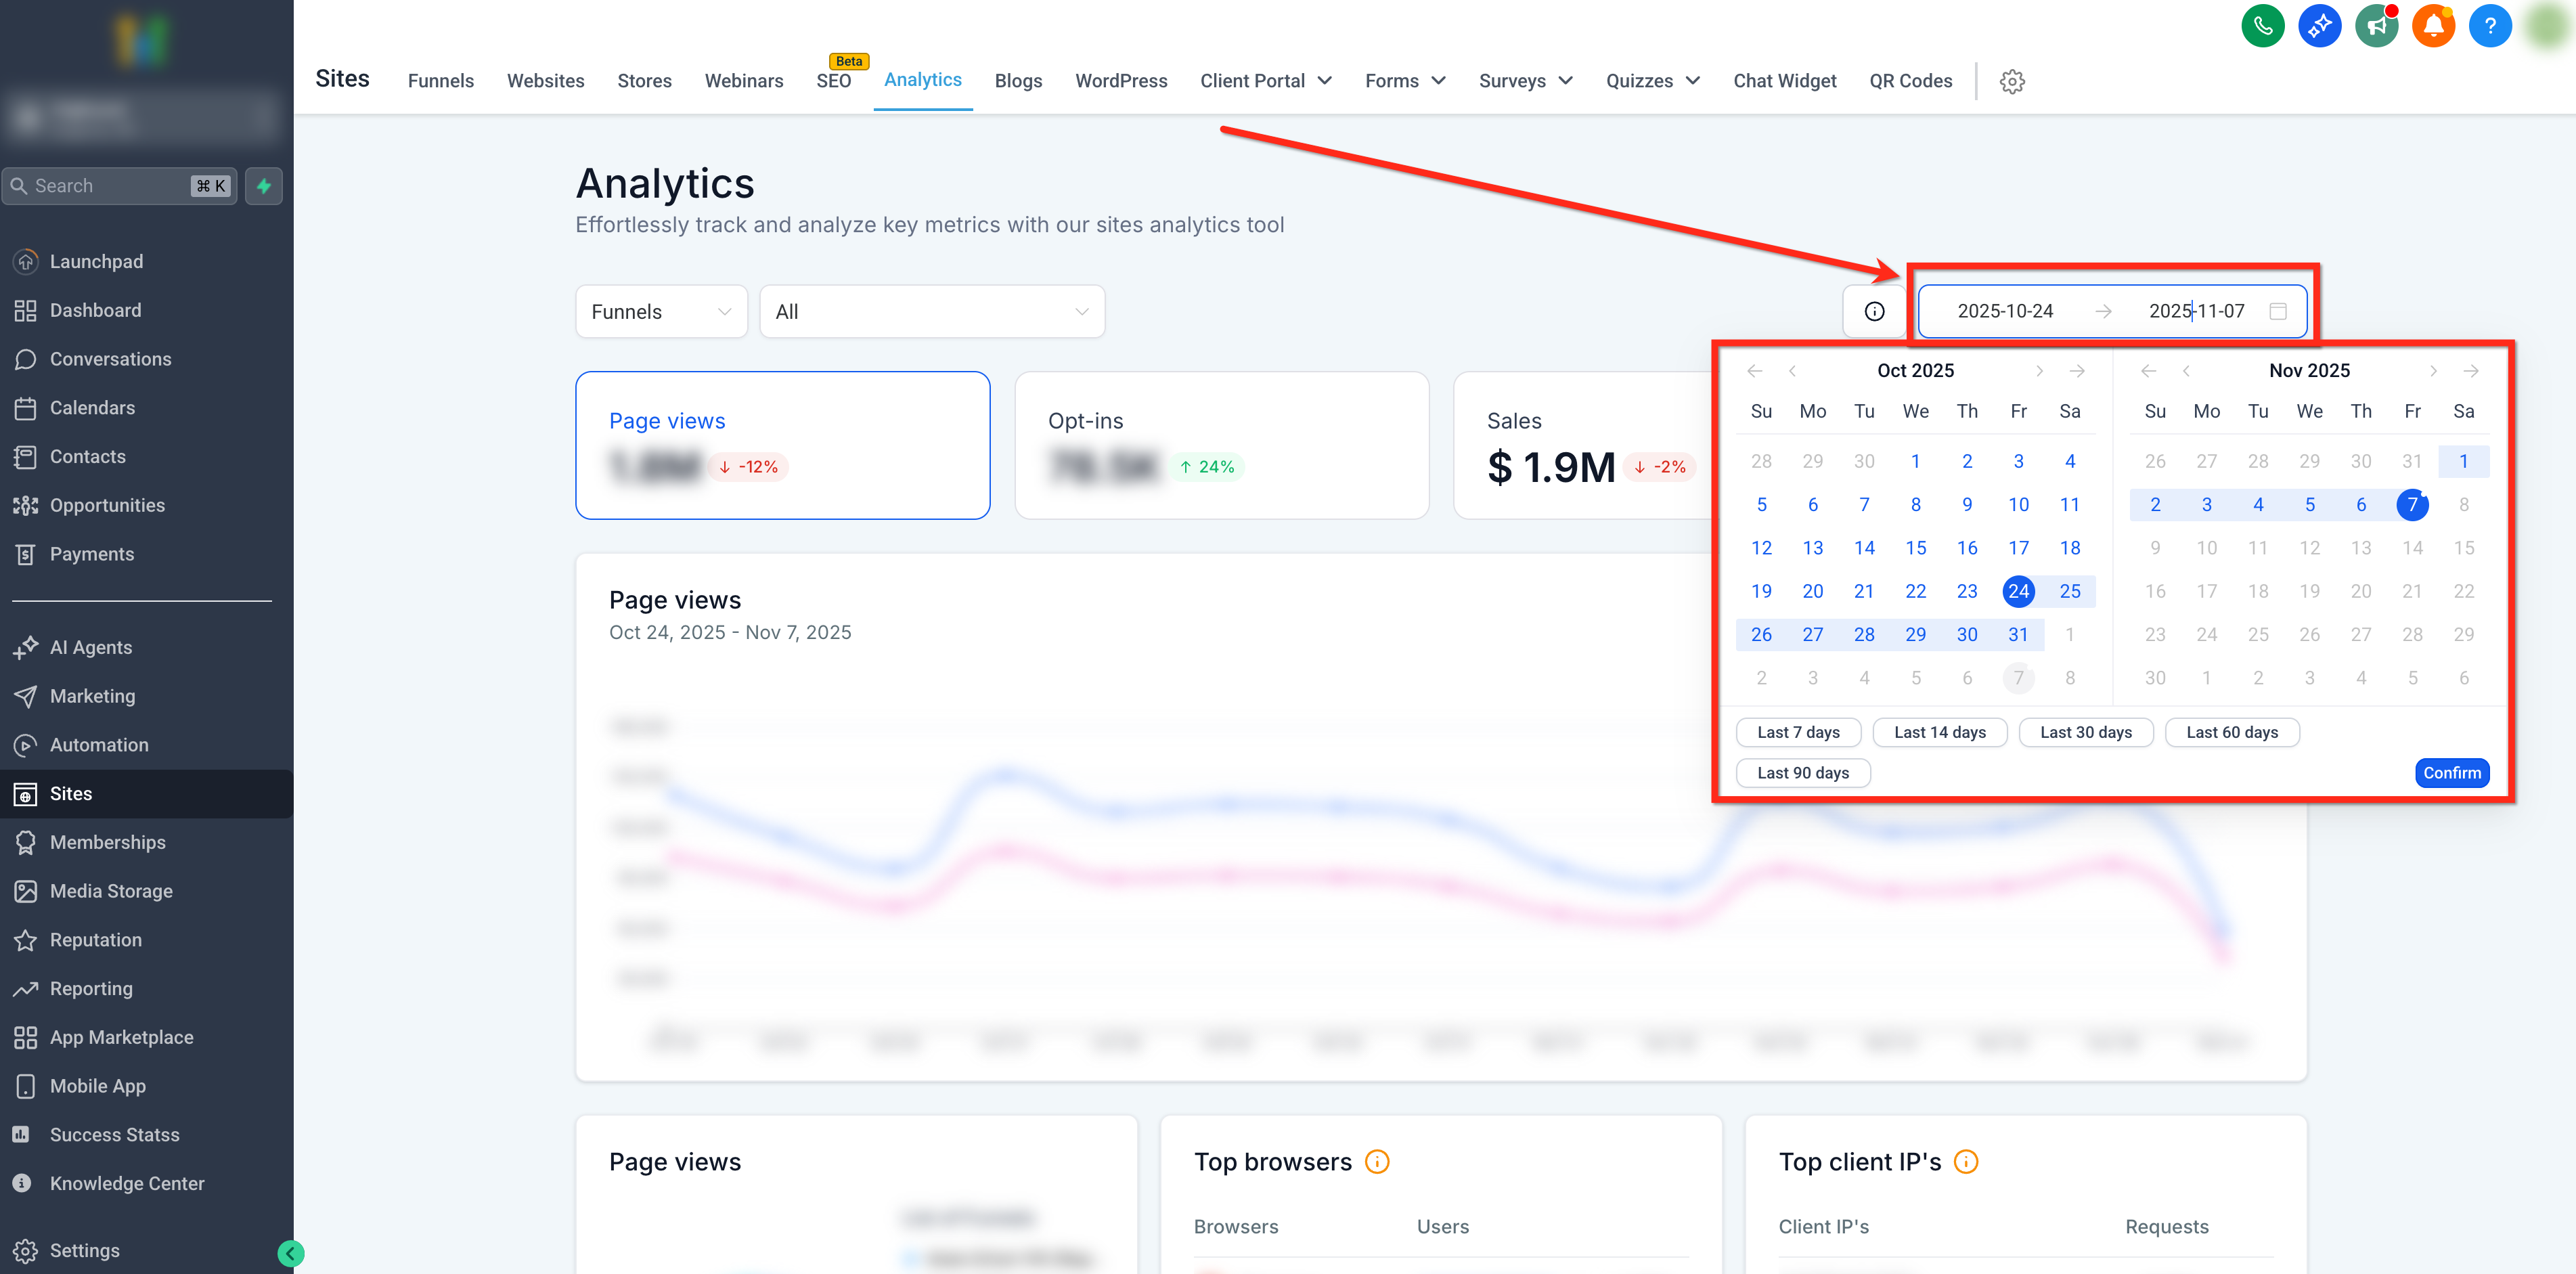
You reach the report by opening the Sites area, selecting Analytics, picking Funnels, Websites or Webinars from a dropdown, setting the desired period, and scrolling to the Average Time card where the numbers appear.
03How businesses use Average Time in Site Analytics
- Ecommerce store. A store owner opens the Average Time card to see how long shoppers stay on product pages. By checking the exit before 30 seconds percentage, they identify pages that may need faster loading or clearer messaging.
- Online course platform. The platform manager filters the report to a specific webinar and reviews the average session length. Short visits highlight content that may not meet learner expectations, prompting adjustments.
- SaaS landing page. A SaaS Founder selects the landing page funnel in the dropdown and looks at the average time visitors spend before signing up. High exit before 30 seconds suggests the headline or copy could be misaligned.
04The numbers and rules that matter
- Average Time. Mean active time per visit across selected date range and sites.
- Exit Before 30s. Share of page visits that ended within first 30 seconds.
- Ultra short visits (<2 seconds) are excluded to reduce noise.
- Supported site types, Funnels, Websites, Webinars.
05How to set up and use Average Time in Site Analytics in HighLevel
Access average time in Site Analytics
- From the left navigation, open Sites and click the Analytics tab on the top ribbon.
- Select Funnels, Websites or Webinars from the top left dropdown and optionally choose a specific site.
- Choose the desired date range using the selector at the top right.
- Scroll down to the Average Time card to view the session duration and exit before 30 seconds percentage; hover any column for period detail.
06What it looks like in HighLevel
07Things to know before you rely on it
- Visits shorter than two seconds are not counted in the average calculation.
- Idle time on inactive tabs is capped to keep the average session duration accurate.
- The metric is only available for funnels, websites and webinars.
08How it connects to the rest of HighLevel
- Use advanced filters to narrow Average Time data. Advanced Filters
- Compare engagement across regions with geographic analytics. Geographic Analytics
- Explore traffic source breakdown alongside Average Time. Traffic Source Analytics
Michael's take

I find it helpful to look at both the Average Time and the Exit Before 30 Seconds metrics together.