
01Who this is for
- Marketing managers can identify the regions driving the most visits and adjust ad spend accordingly.
- Agency owners can show clients visual location data to justify targeting decisions.
- Ecommerce Founders can see where international shoppers are concentrated for shipping and localization planning.
02Geographic site analytics, explained
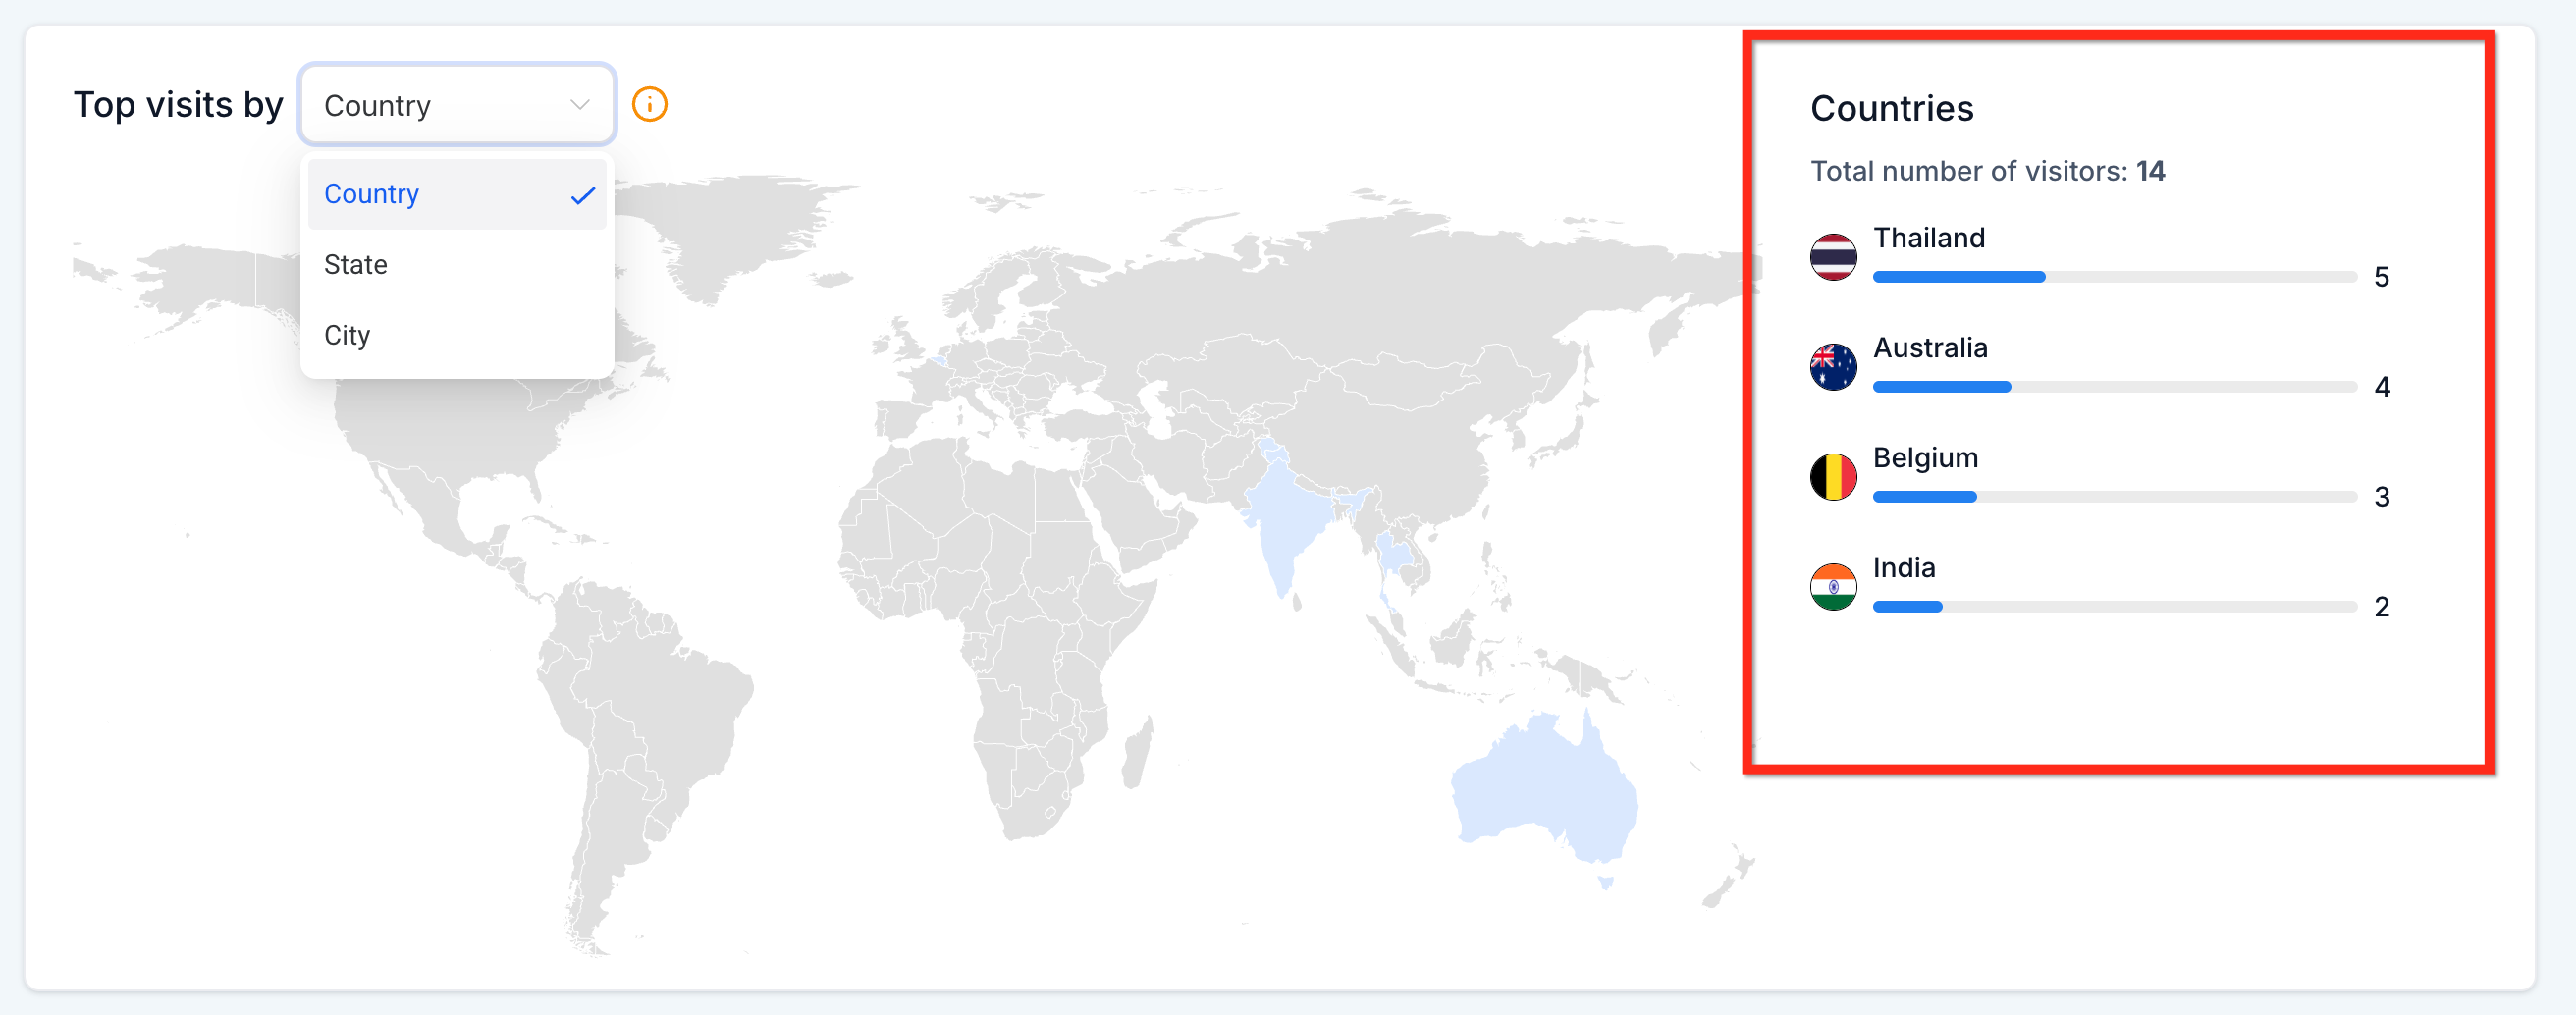
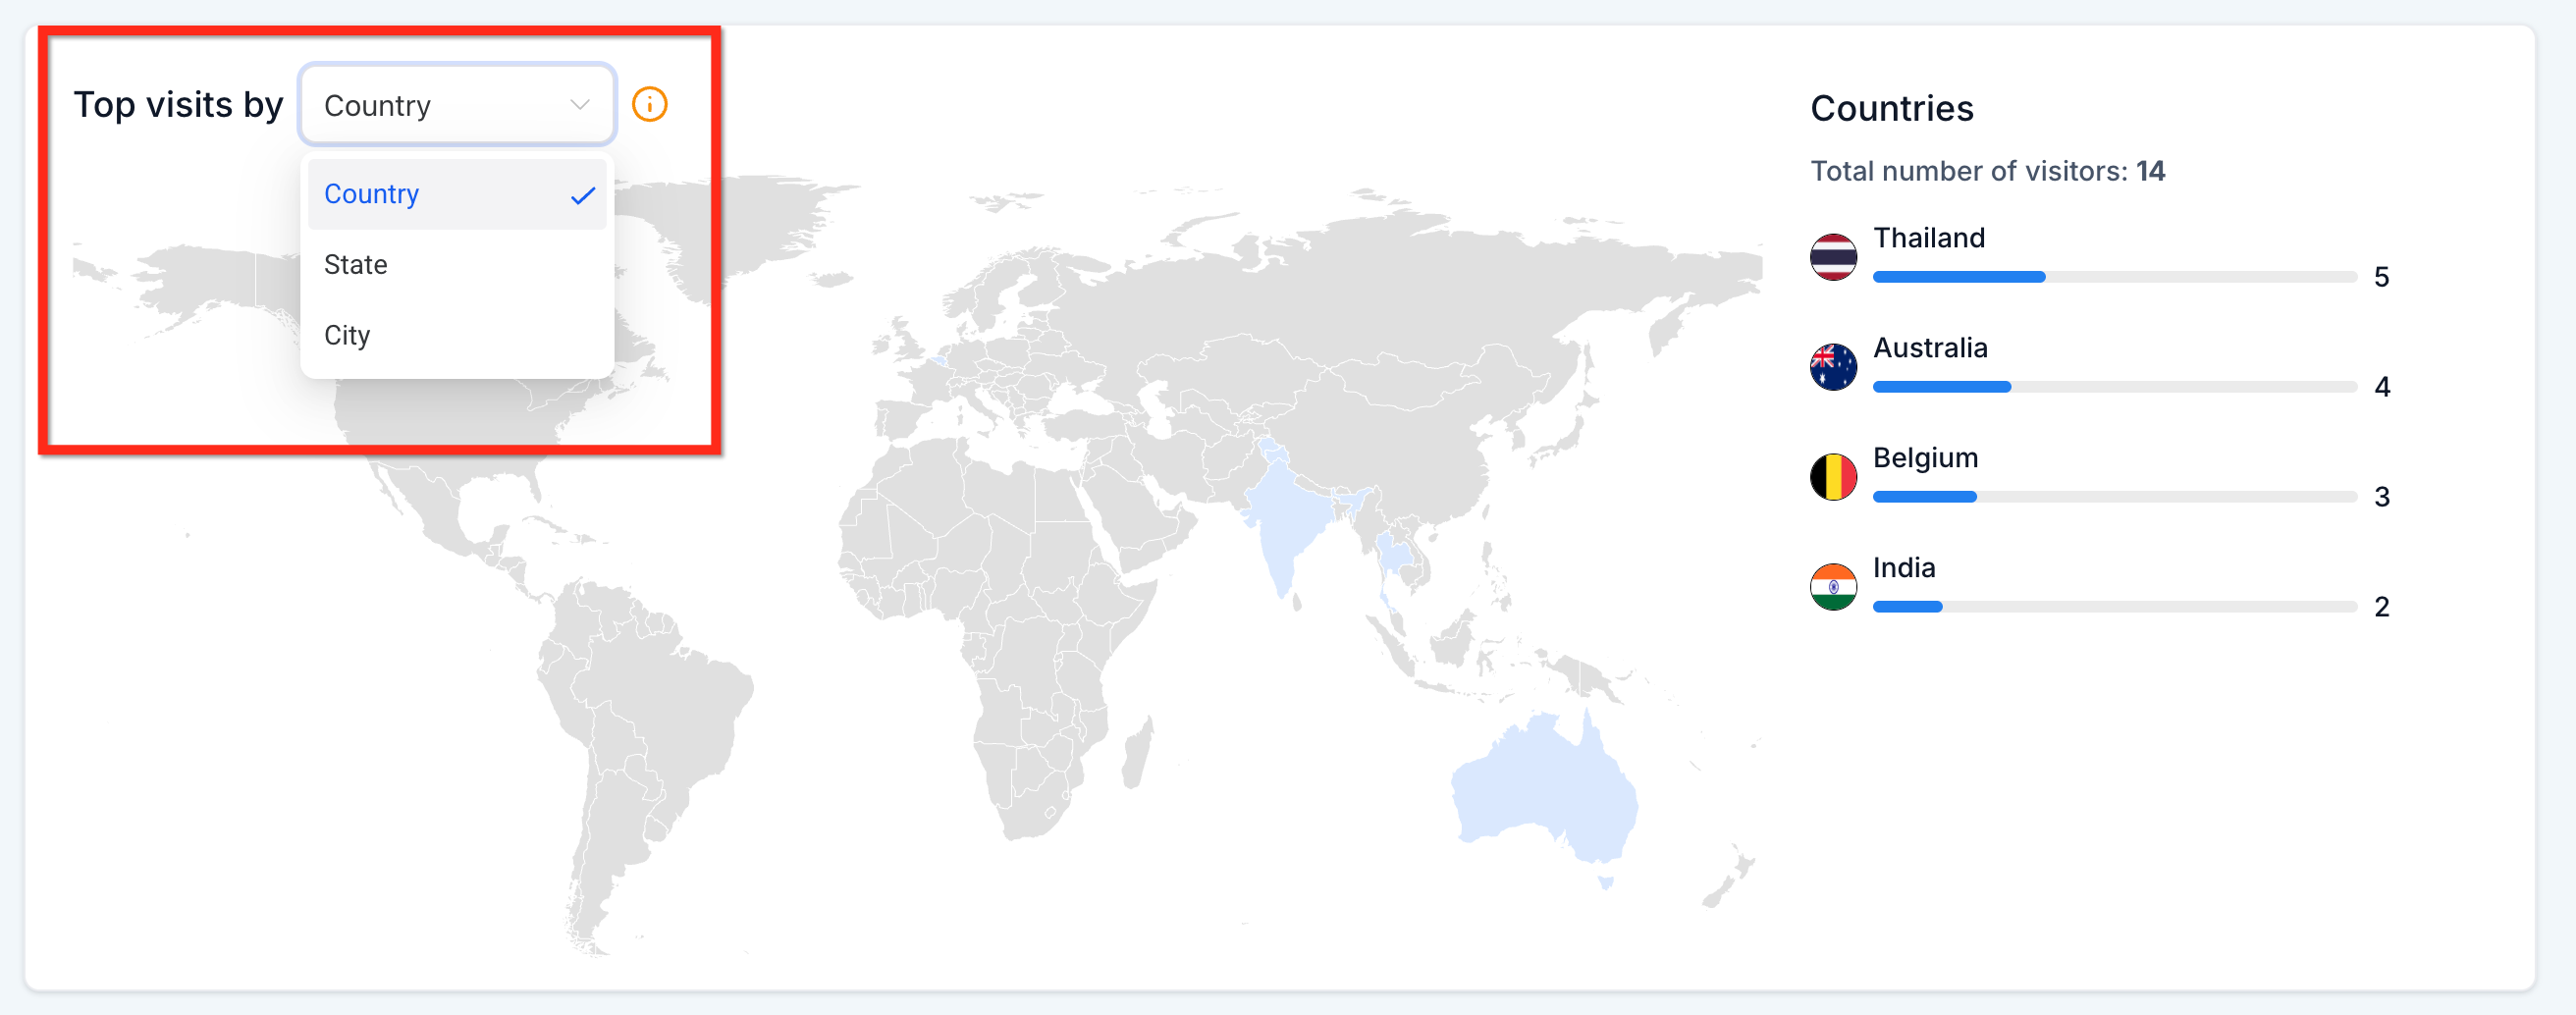
The feature lives inside the Sites Analytics section of the platform. It presents a heat map that deepens in color as visitor counts rise, and a side panel that ranks the top ten locations for the selected level. A single dropdown lets you switch between country, state and city views.
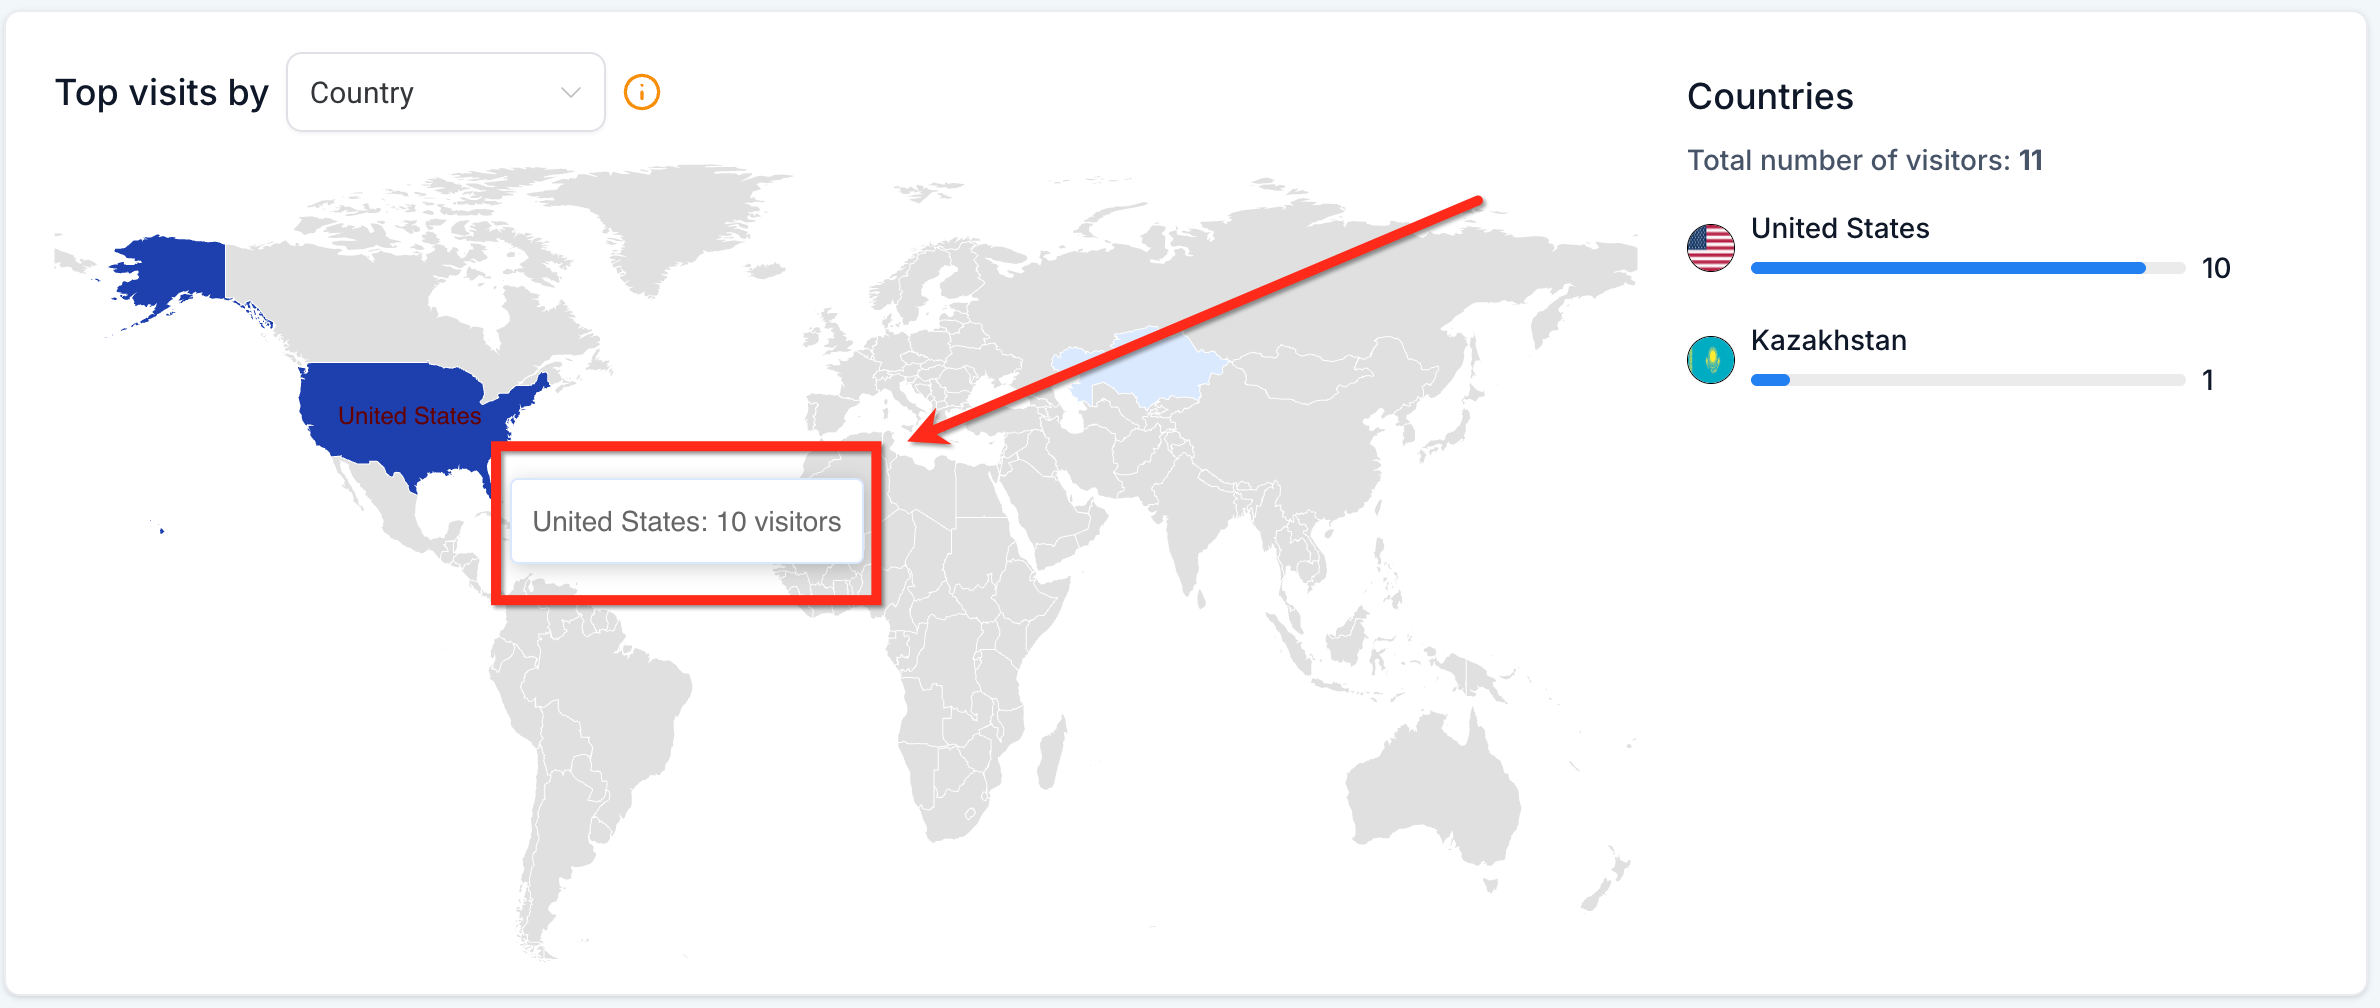
When you move the cursor over a shaded area, a tooltip right away shows the exact visitor number for that region. The total visits for the chosen level appear above the map and refresh automatically as you drill down. The ranked list updates in real time, so you can compare locations at a glance.
The geographic view works for both funnels and websites. It does not require extra clicks to load new data; the map and list refresh automatically whenever you change the dropdown or date range.
03How businesses use geographic site analytics
- Travel agency. The agency opens the Sites Analytics dashboard, selects the city level, and hovers over the map to see which destinations receive the most web traffic. It then records the top cities to prioritize local advertising in HighLevel.
- SaaS startup. The startup sets a custom date range, selects the country view, and reviews the ranked list to identify emerging international markets. The insight guides the creation of region specific landing pages directly in HighLevel.
- Local service business. The business switches to the state view, notes the highest traffic cities in the side panel, and narrows its email campaign targeting within HighLevel to those zip code clusters.
04The numbers and rules that matter
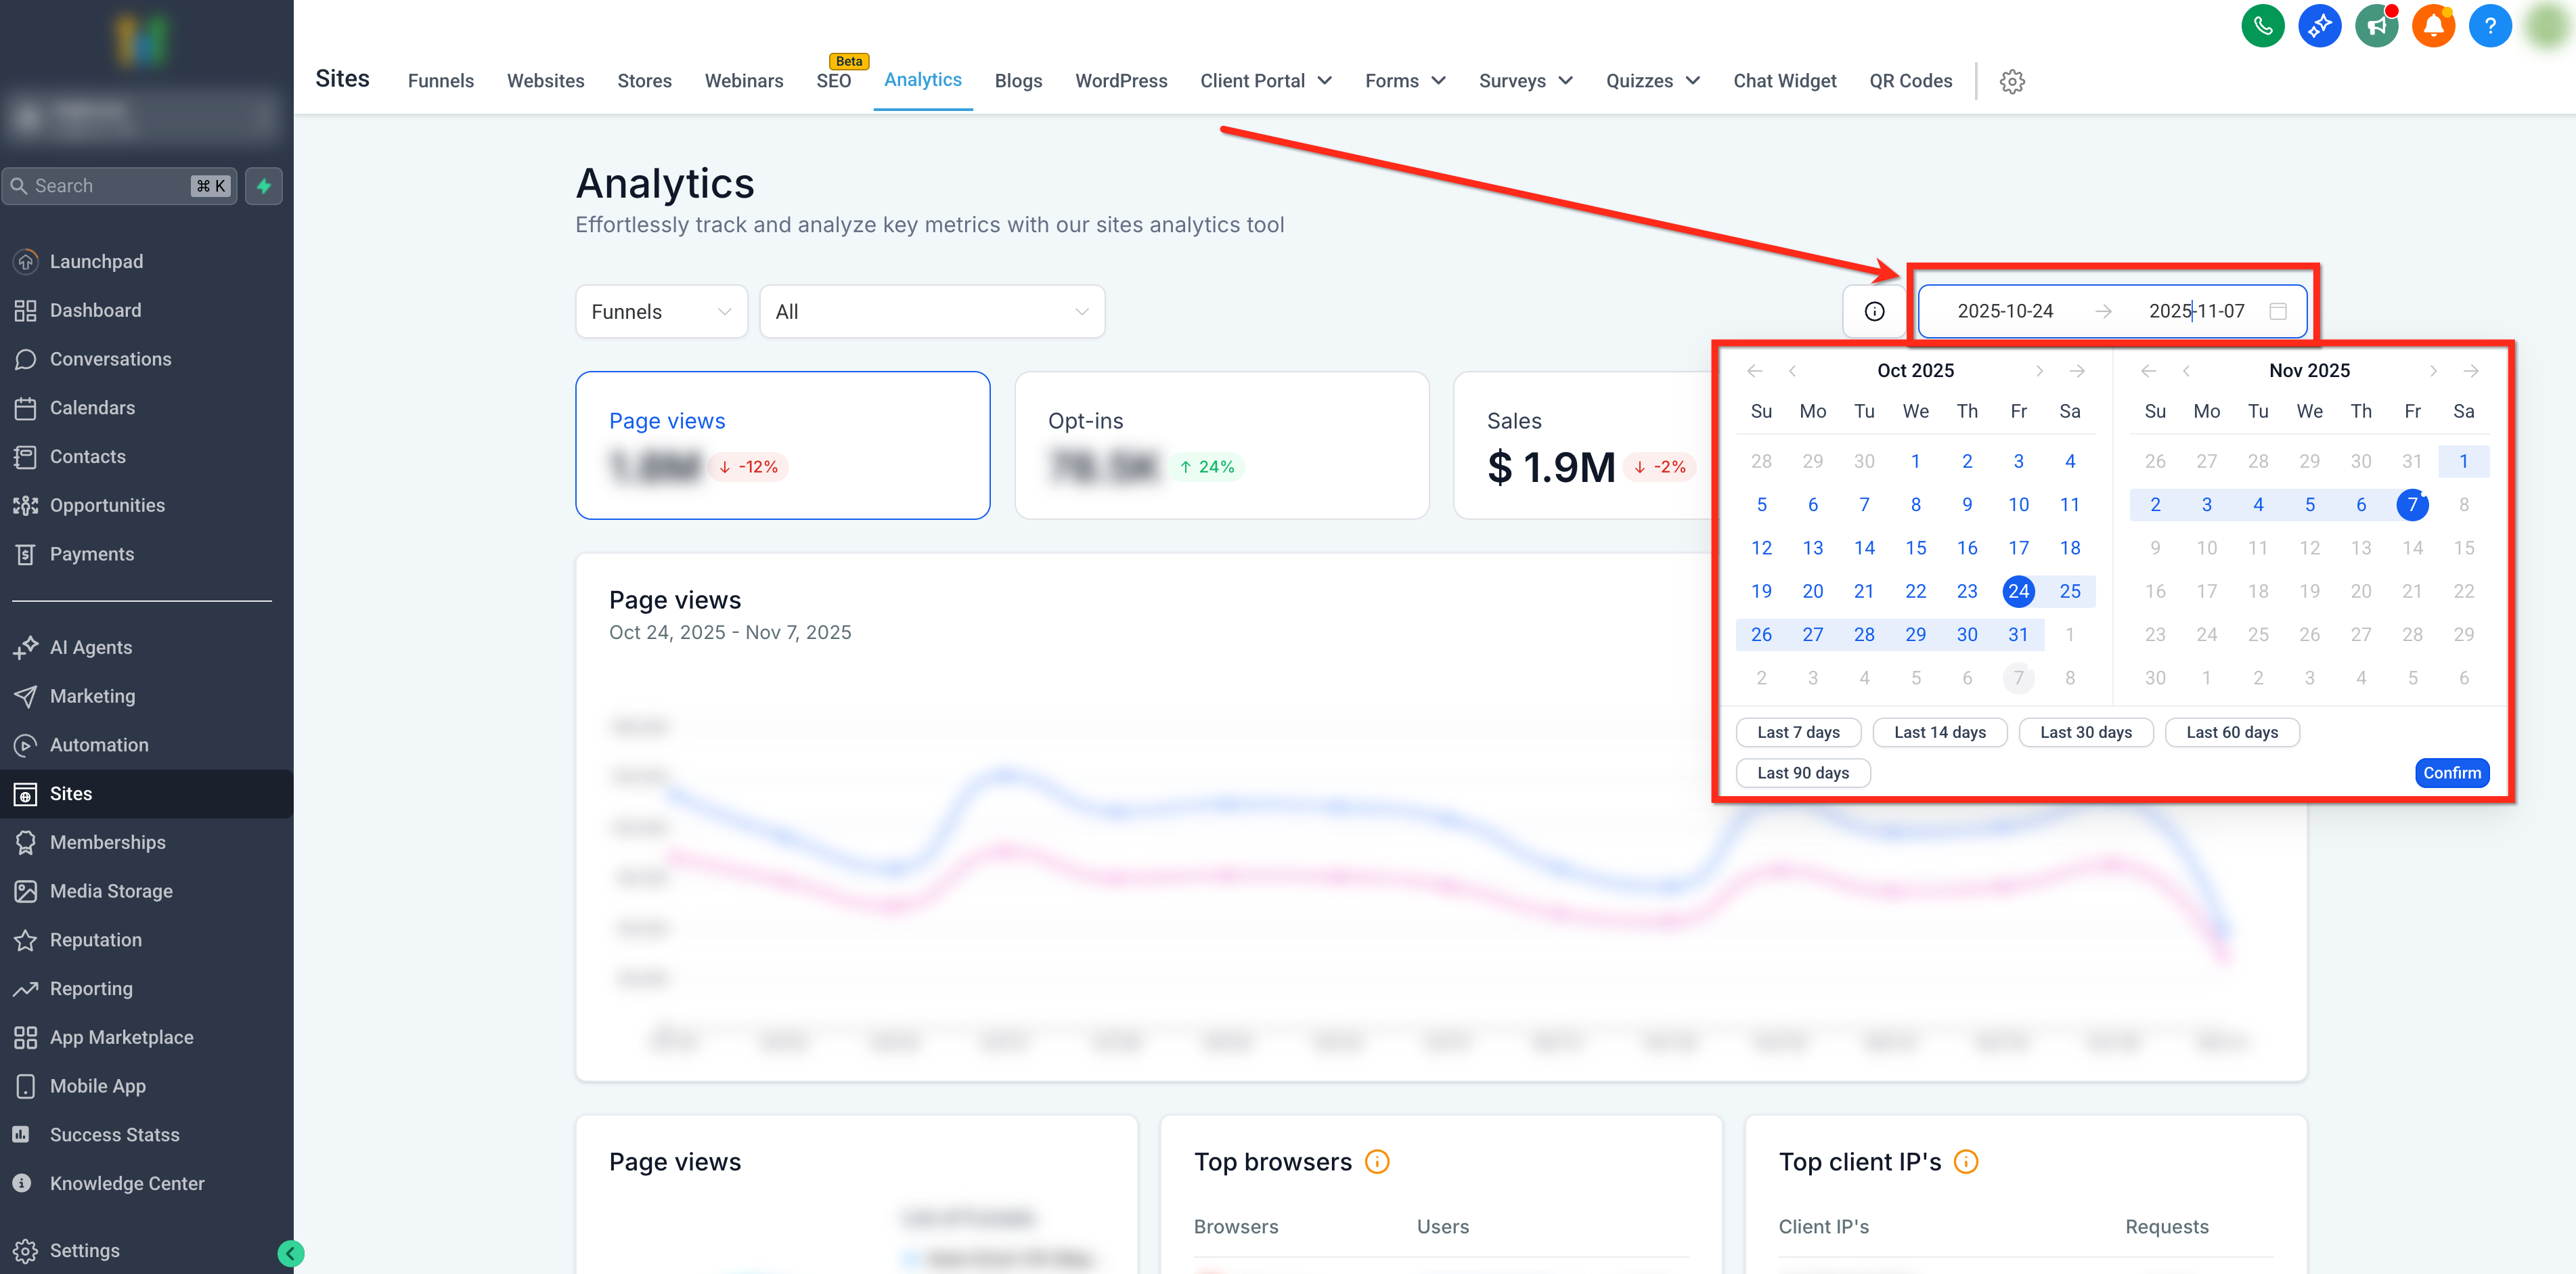
- Date filter options: Last 7 days, Last 14 days, Last 30 days, Last 60 days, Last 90 days, Custom date range.
05Before you start
- Tracking scripts must be correctly installed on the site or funnel.
- The site must have enough traffic for the heat map to display data.
06How to set up and use geographic site analytics in HighLevel
Access geographic analytics for sites and funnels
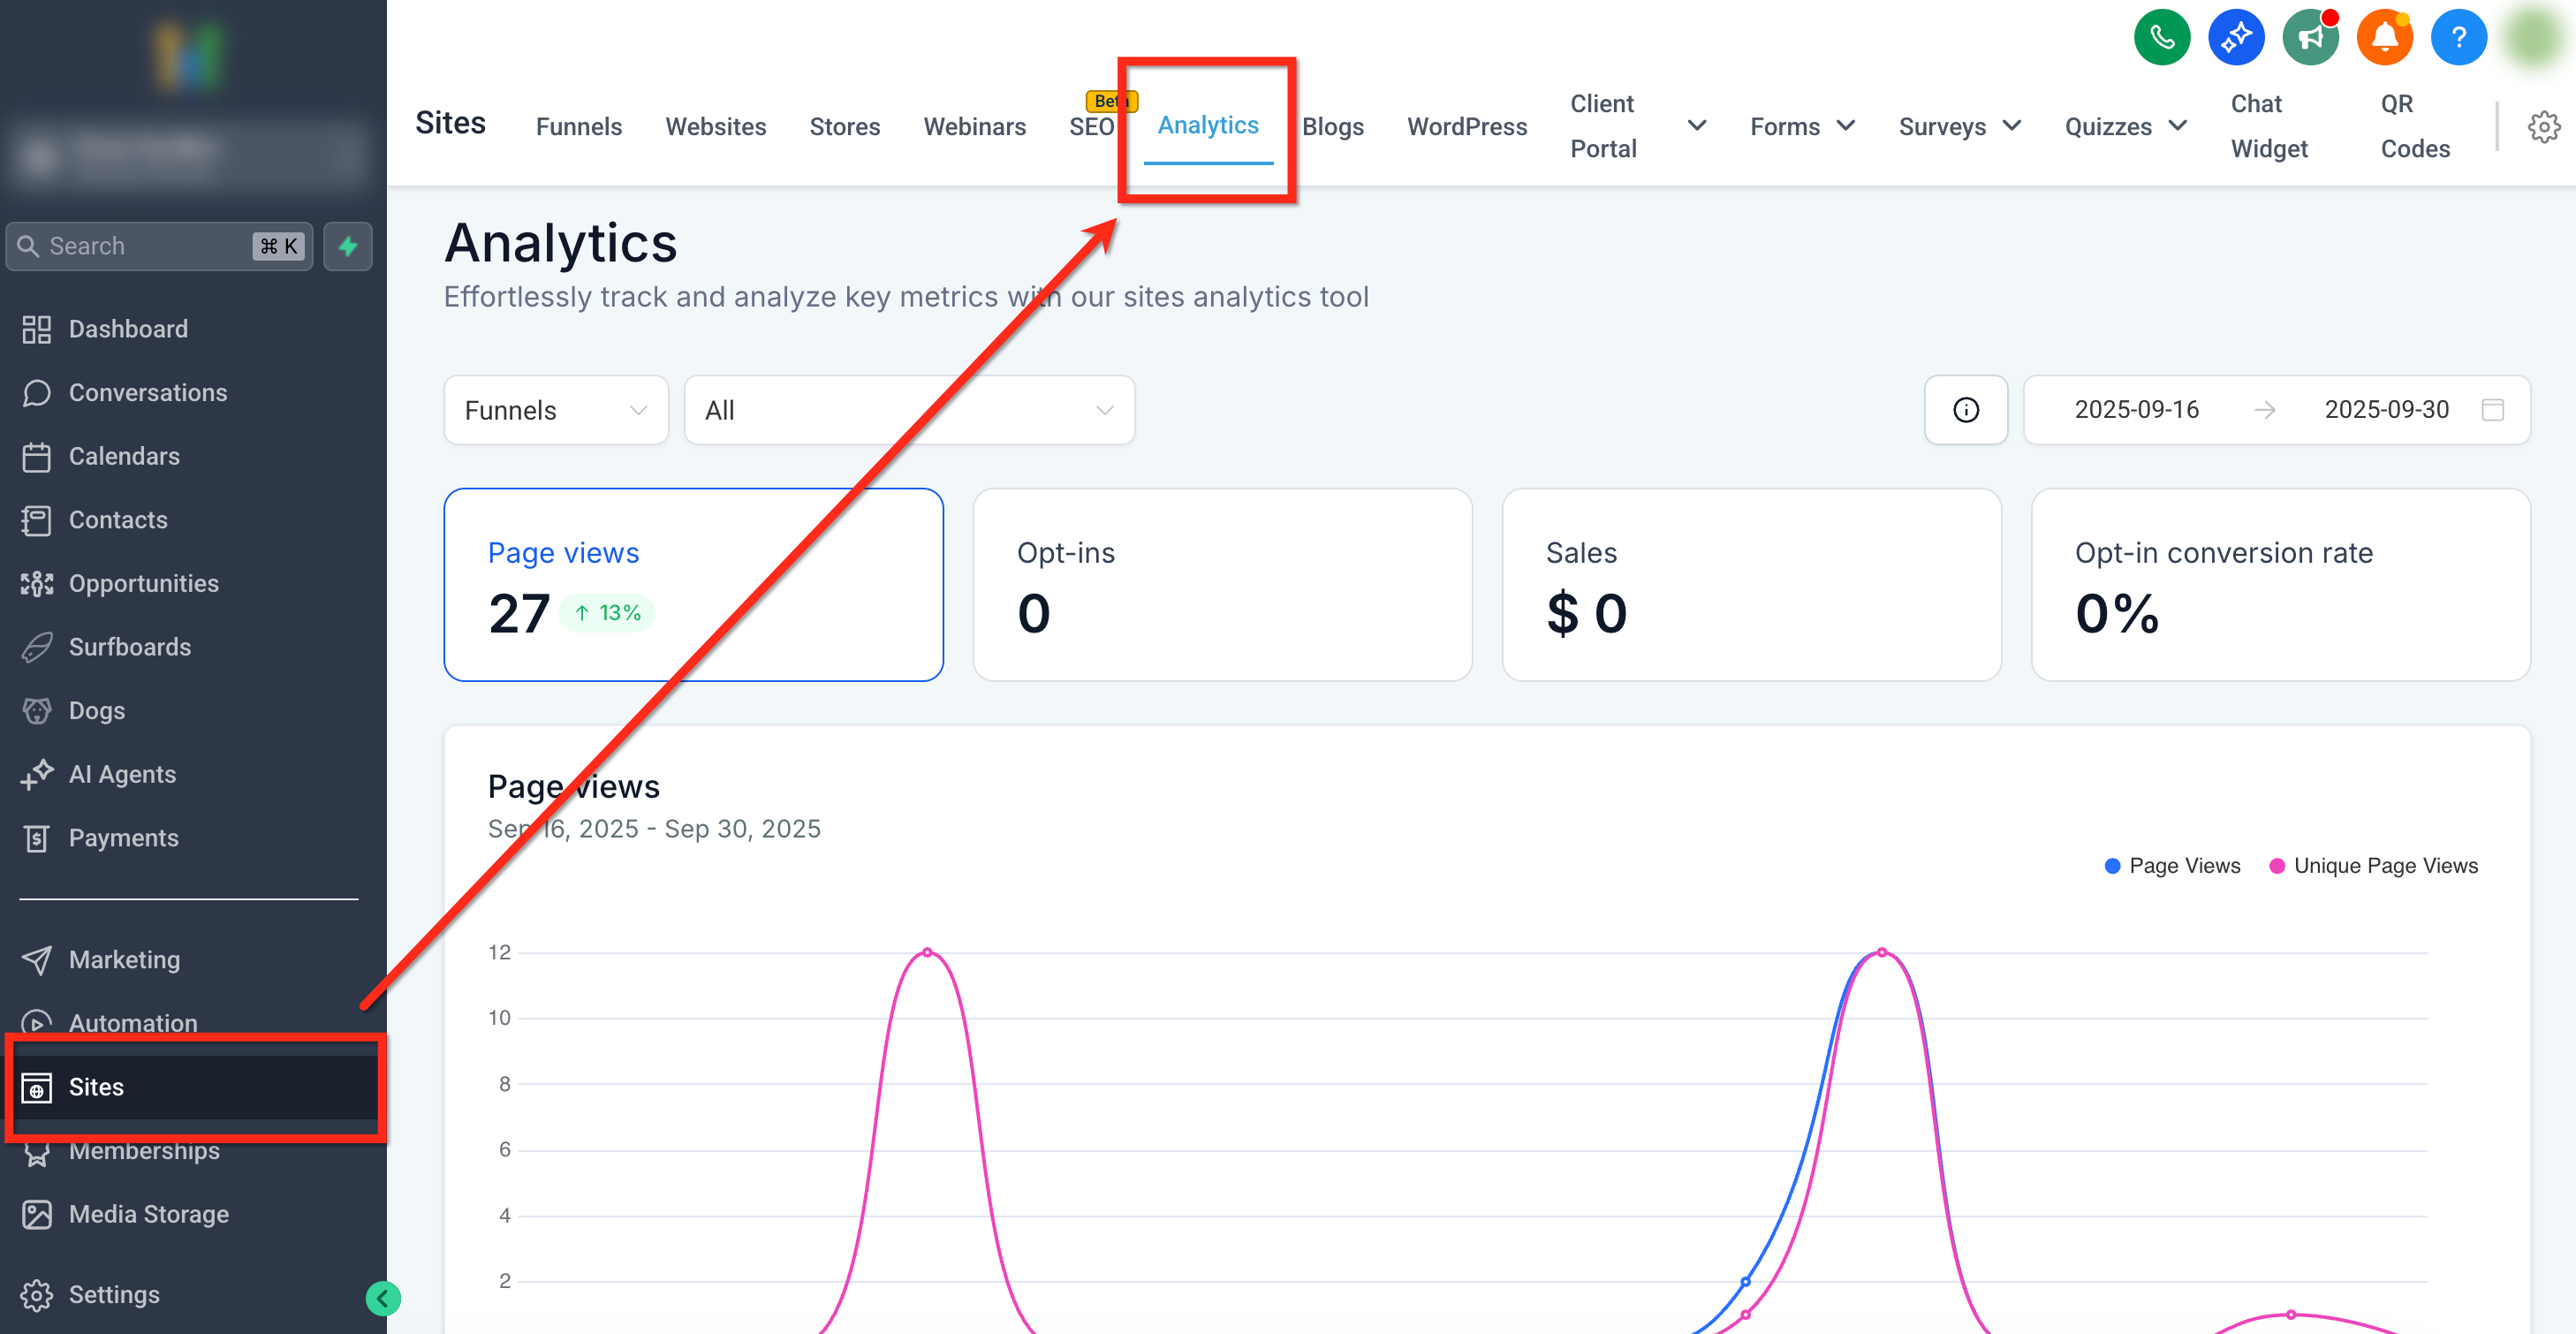
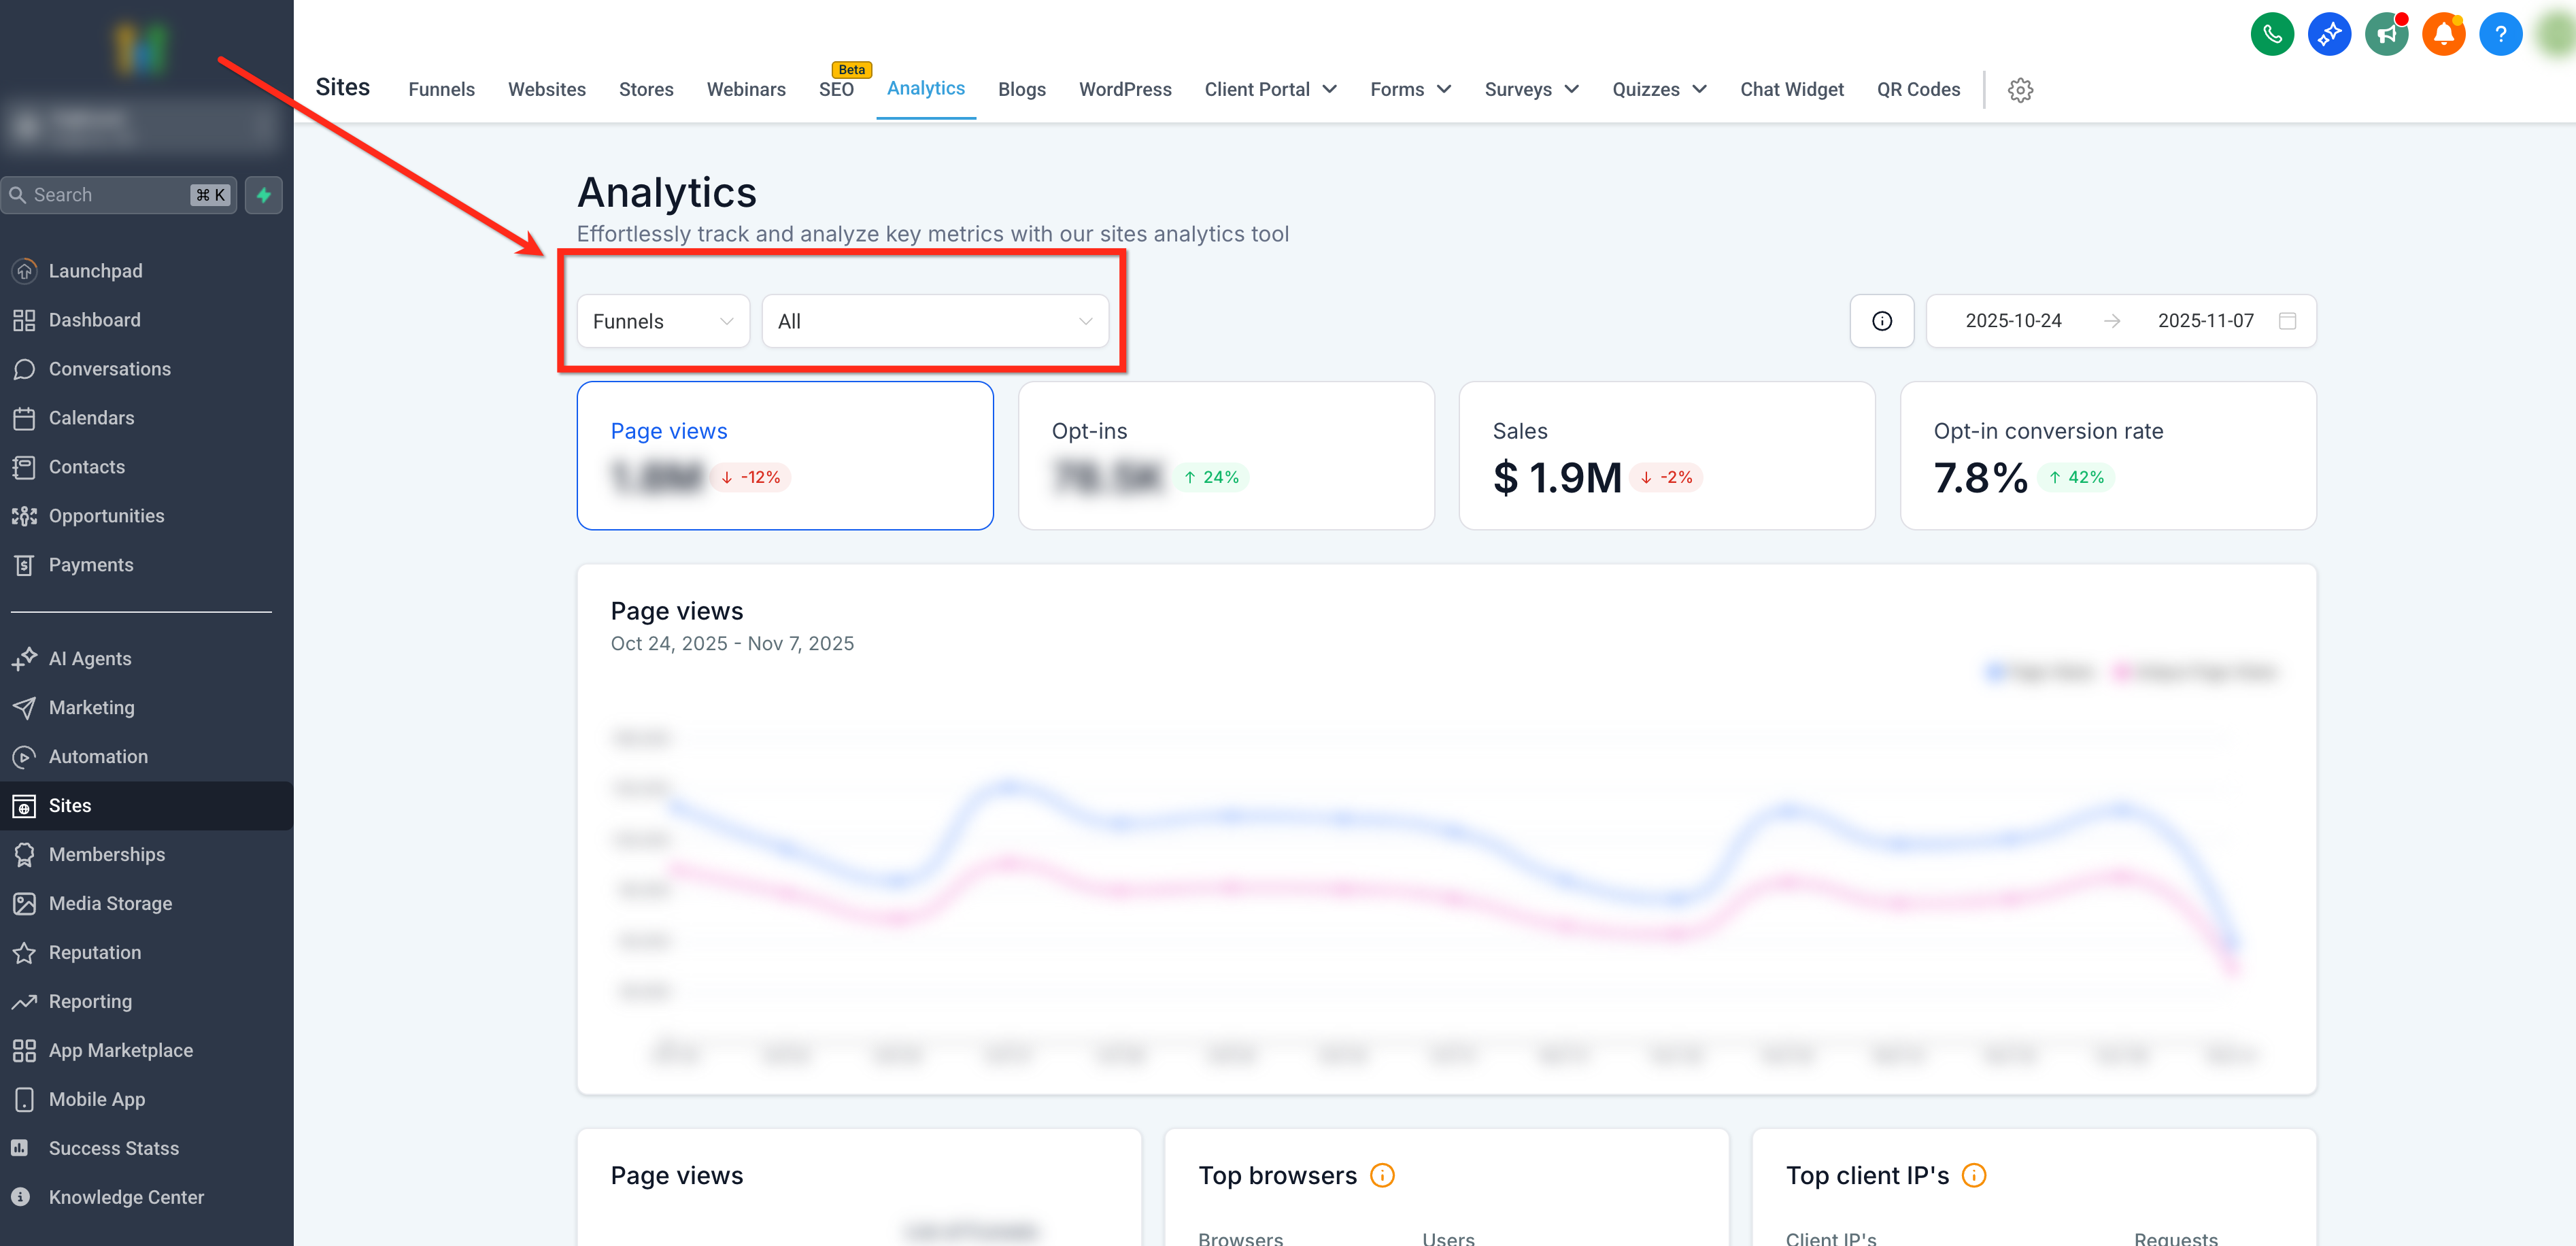
- Open the subaccount dashboard and click Sites in the left navigation, then choose the Analytics tab from the top ribbon.
- Use the top left dropdown to pick Funnels or Websites, and optionally select a specific asset with the second dropdown.
- Select the desired time span with the date filter in the upper right corner, choosing from the preset ranges or a custom interval.
- Scroll to the “Top visits by” card, pick Country, State or City from the dropdown above the map, hover regions for visitor counts, and read the ranked list on the right.
07What it looks like in HighLevel
08Settings that matter
- Geographic Dropdown (Country, State, City). Controls which geographic level the heat map and ranked list display, country, state or city.
- Date Filters. Limits the data shown on the map and list to the chosen time period.
09Things to know before you rely on it
- The ranked side list shows only the top ten locations for the selected level.
- The heat map visual cannot be downloaded; only overall analytics data can be exported.
- If traffic volume is low or tracking scripts are missing, the map may appear empty.
10If something goes wrong
- No country data appears on the heat map.. Verify that the site receives sufficient traffic and that tracking scripts are correctly configured.
11How it connects to the rest of HighLevel
- See how pie chart visualizations compare to the heat map Pie chart visualizations
- Explore traffic source analytics for deeper insight Traffic source analytics
- Review average time on site alongside geographic data Average time analytics
- Start a 30 day HighLevel trial to test this feature 30 day trial
Michael's take

Be aware that geographic analytics only works when your site is tracking visitors and has enough traffic to generate a map. Without proper tracking or sufficient visits, the heat map will appear empty and won’t give you the insights you expect.
When it does work, the visual map provides a quick visual cue of where your audience clusters, letting you see regional patterns without digging through spreadsheets.