
01Who this is for
- Marketing managers who need a quick overview of how landing pages and funnels are performing.
- Ecommerce owners looking to compare sales and opt in rates across multiple websites or product pages.
- Event planners who want to see attendance trends for webinars and QR based ticket scans.
02Site and Funnel Analytics, explained
Site and Funnel Analytics is a unified workspace inside HighLevel where you can measure visitor attraction, engagement and conversion for all web based assets. You start by selecting an asset family, such as Funnels or Websites, then optionally narrow the view to a single asset. A date range picker lets you define the analysis period, and the dashboard updates KPI cards and charts accordingly.
The dashboard adapts its metric cards and visuals to the chosen asset type. KPI cards act as tabs; clicking one changes the chart below to focus on that specific metric, like page views, opt ins or sales. For QR codes, a dedicated view shows scans, unique scans, device distribution, browsers and geographic breakdowns instead of the standard KPI cards.
03How businesses use site and Funnel Analytics
- Digital marketing agency. The agency selects the Funnels asset type, picks a client’s specific funnel, sets a 30 day range, and clicks the Opt in KPI card to see conversion trends. They repeat for each funnel to compare performance across campaigns.
- Restaurant chain. The owner chooses the Websites asset type, narrows to the online reservation page, applies the last 14 day date range, and reviews the Time on Page KPI to gauge visitor engagement before adjusting the menu layout.
- Conference organizer. The organizer selects QR Codes, picks a specific event QR code, sets a custom date range, and examines the Geographic analytics map to understand where attendees are scanning the code.
04The numbers and rules that matter
- Asset types available: Funnels, Websites, Blogs, Webinars, Forms, Surveys, QR Codes, External Tracking.
- Date range defaults to Last 14 days.
- QR Code historical data available from August 28, 2024 onward.
05Before you start
- The External Tracking script must be installed and active on any external site you want to track with the External Tracking asset type.
06How to set up and use site and Funnel Analytics in HighLevel
Use Site and Funnel Analytics
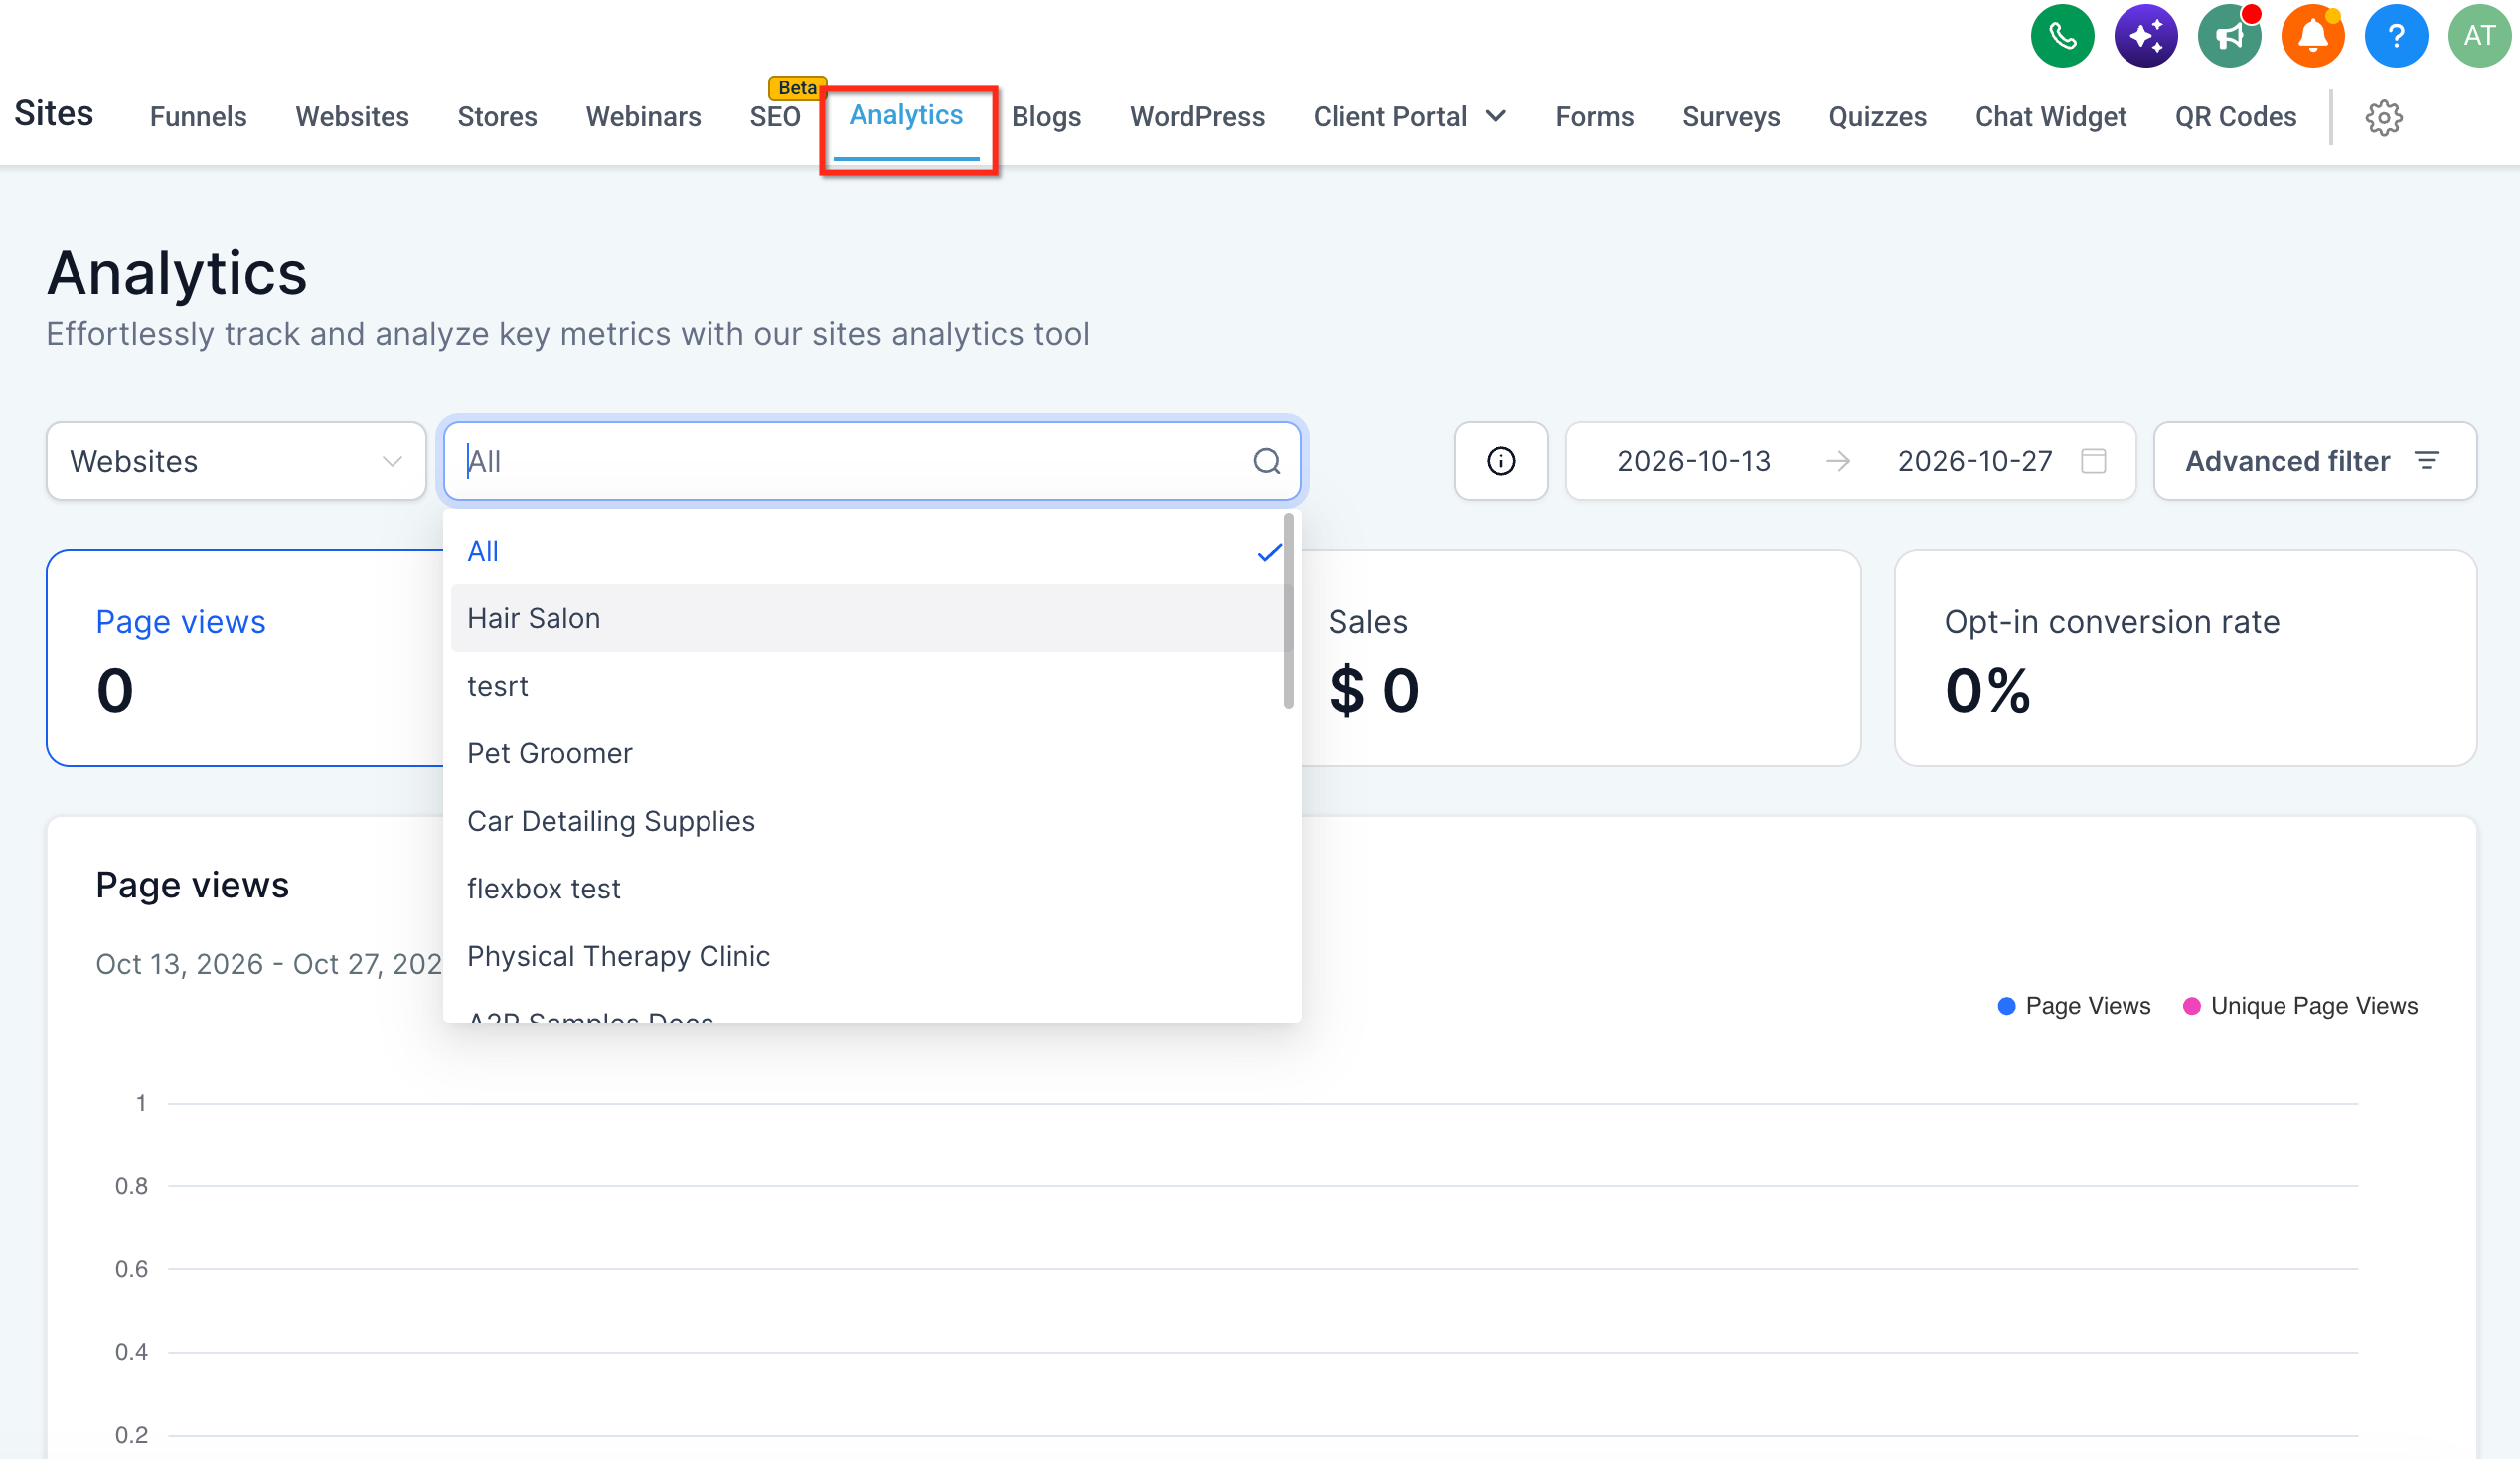
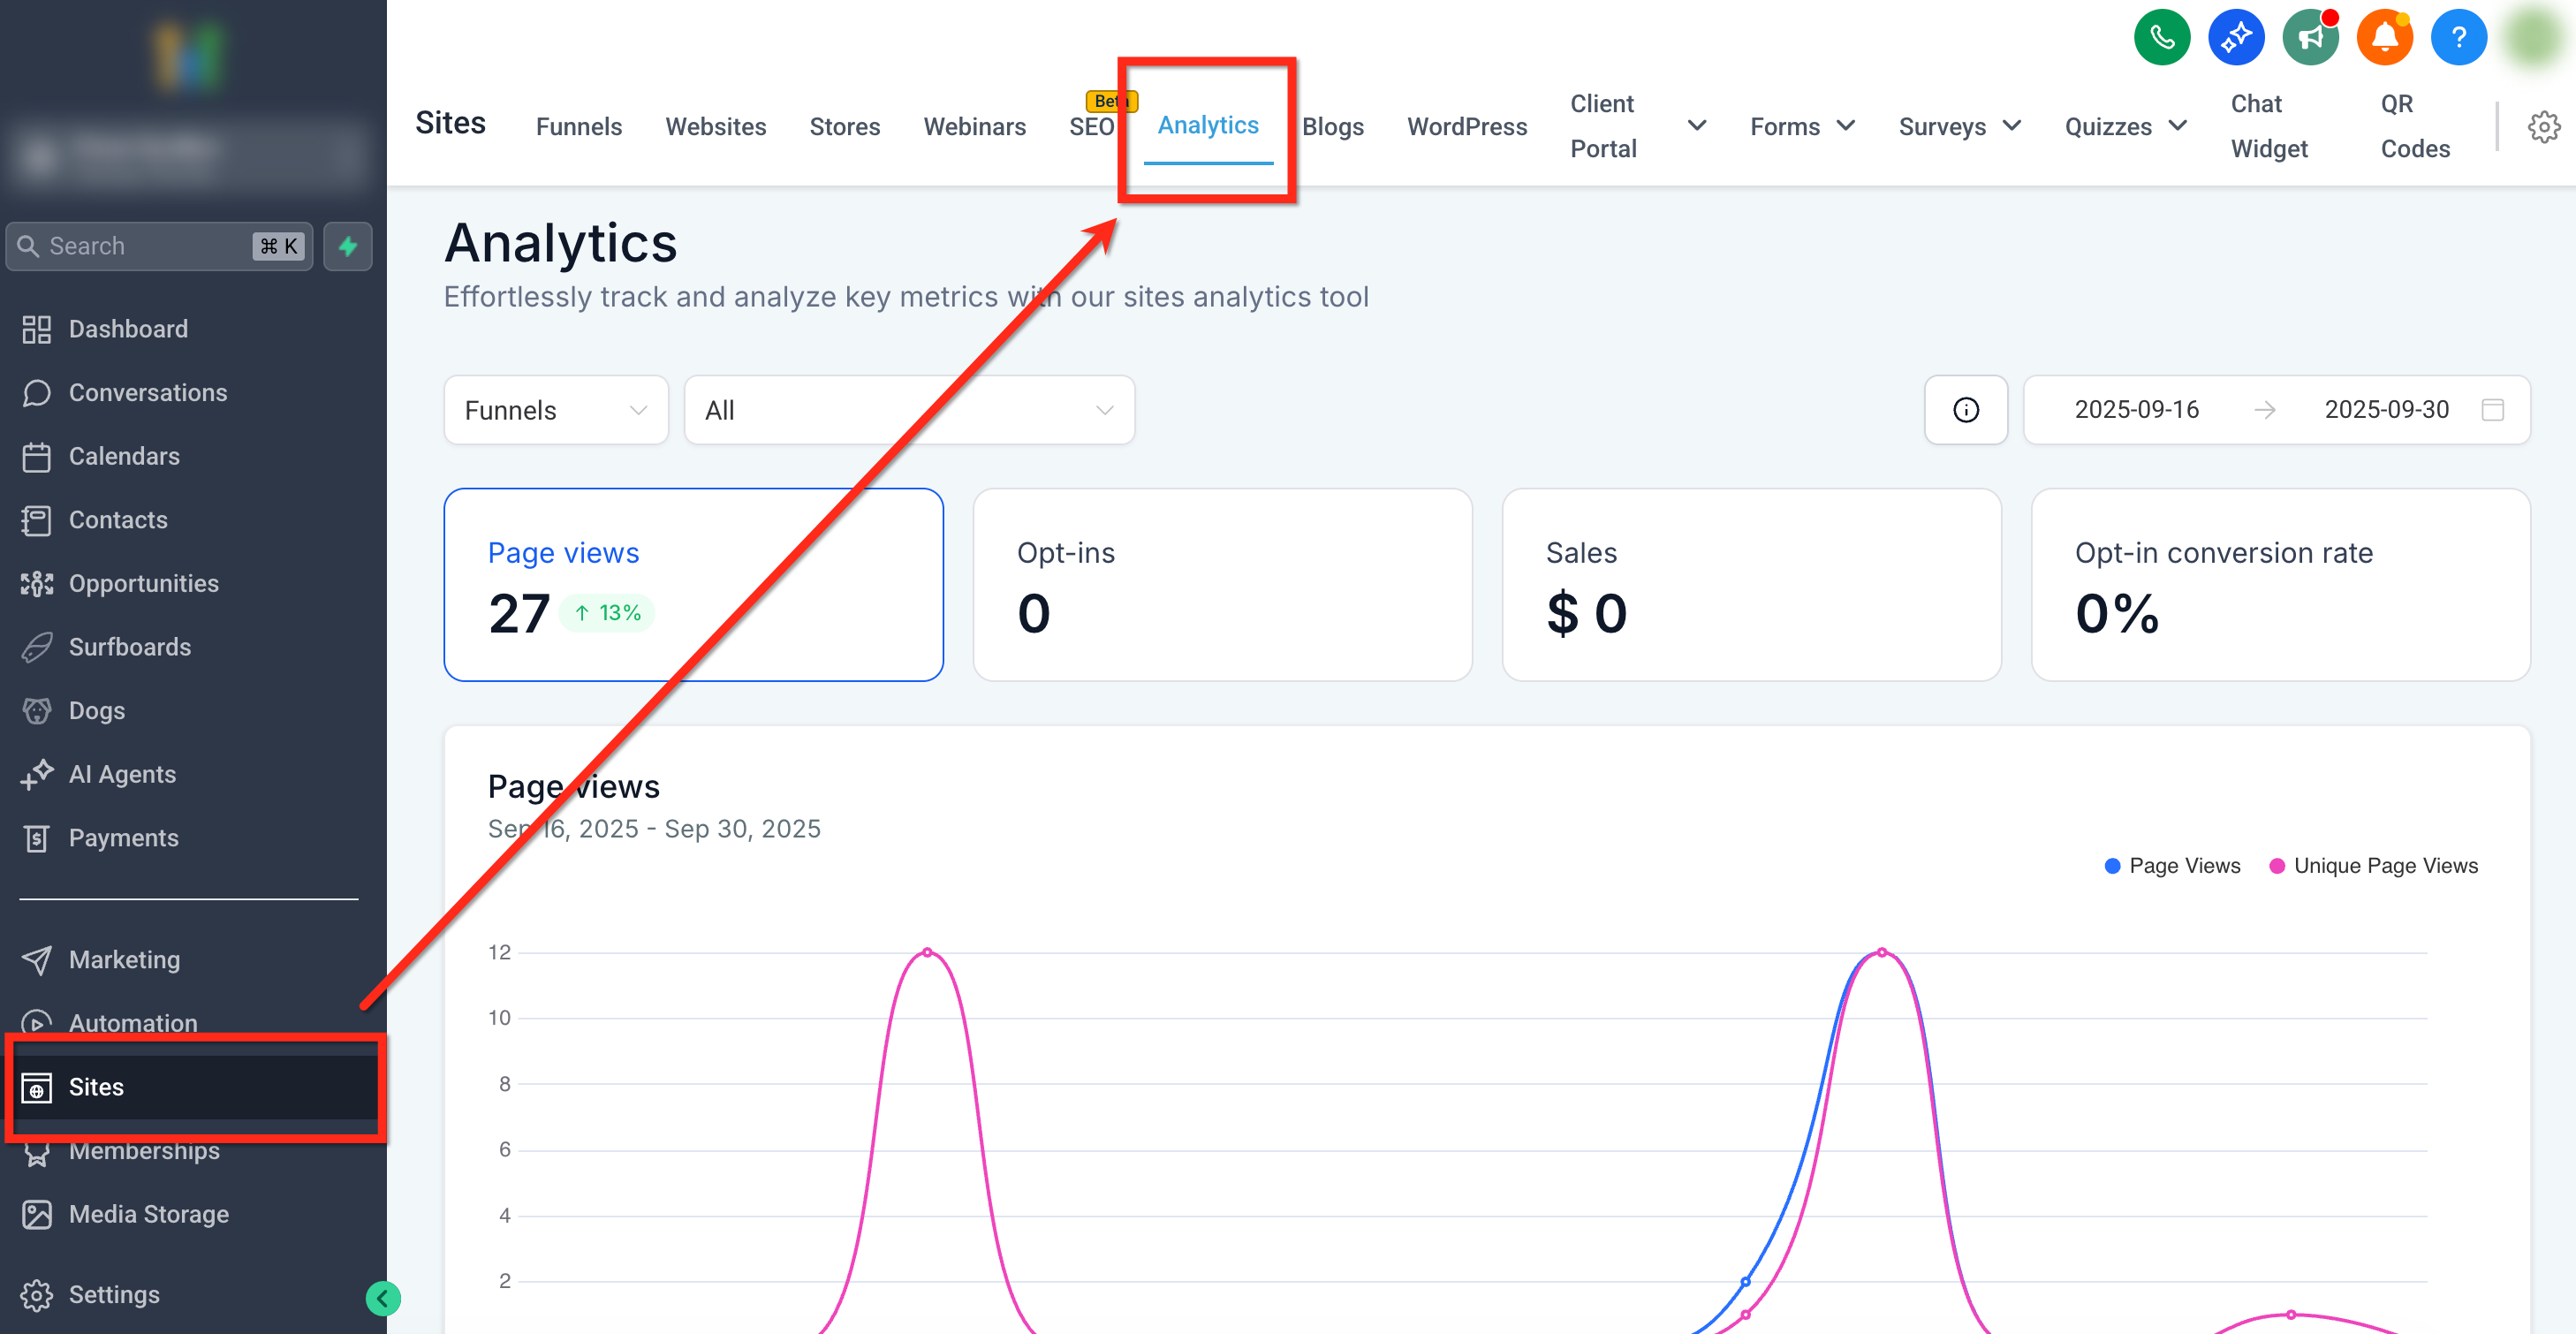
- Open the left navigation bar, click Sites, then select the Analytics tab.
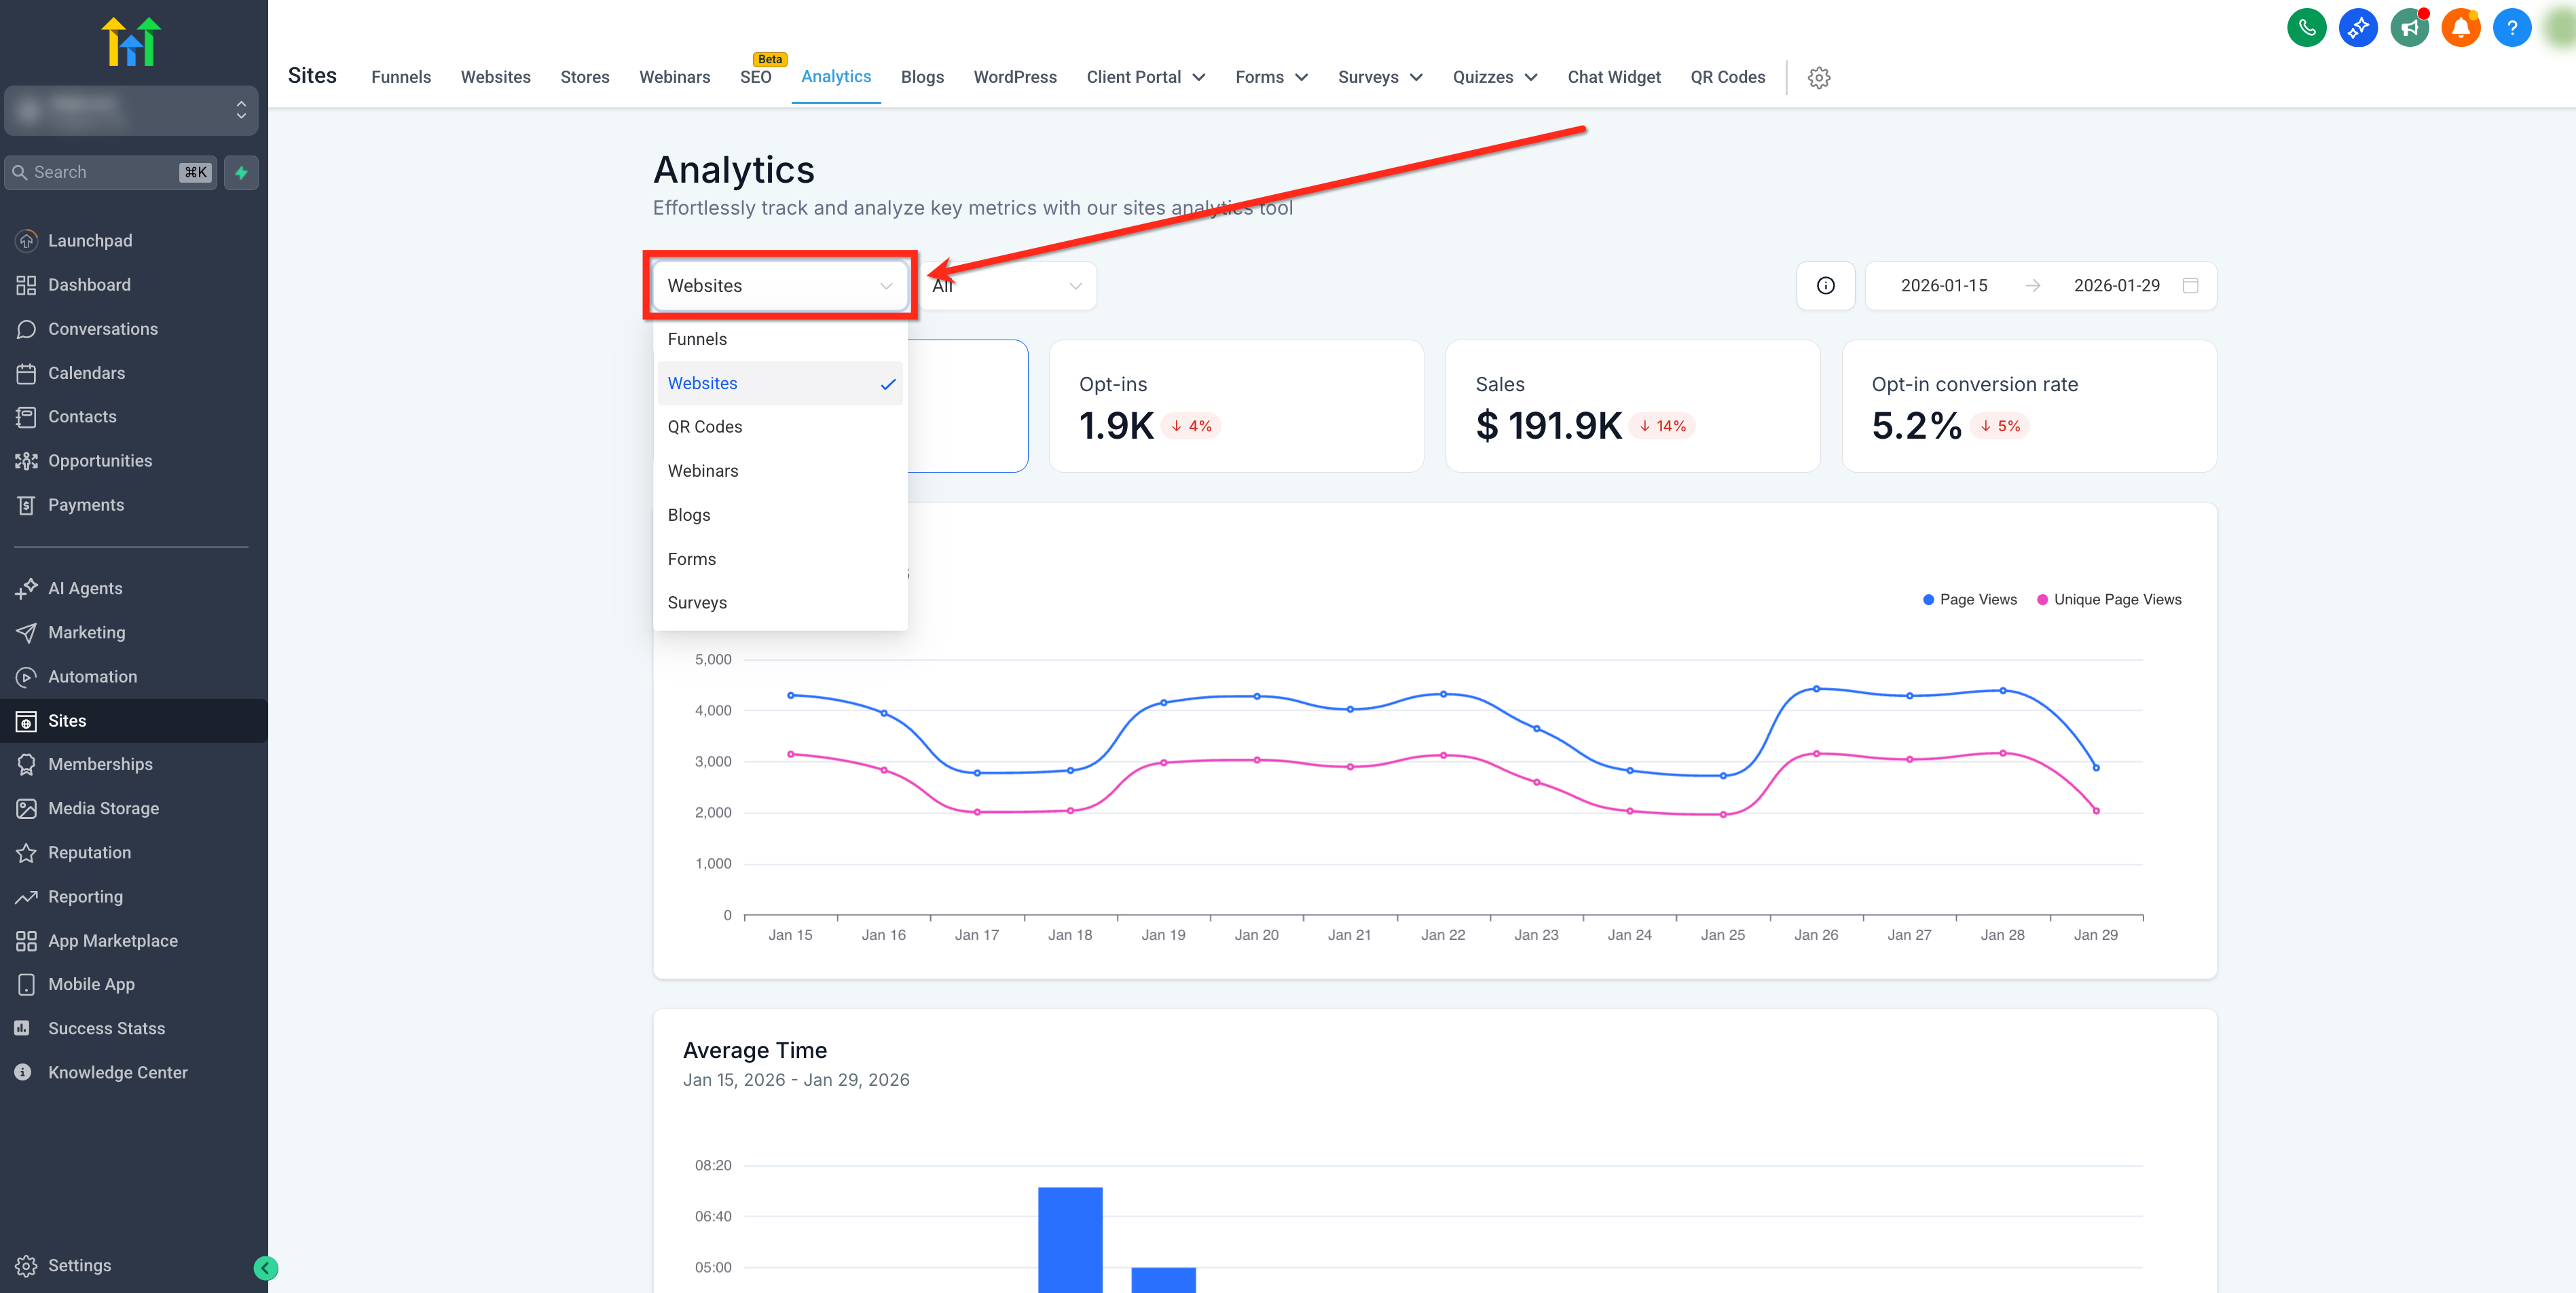
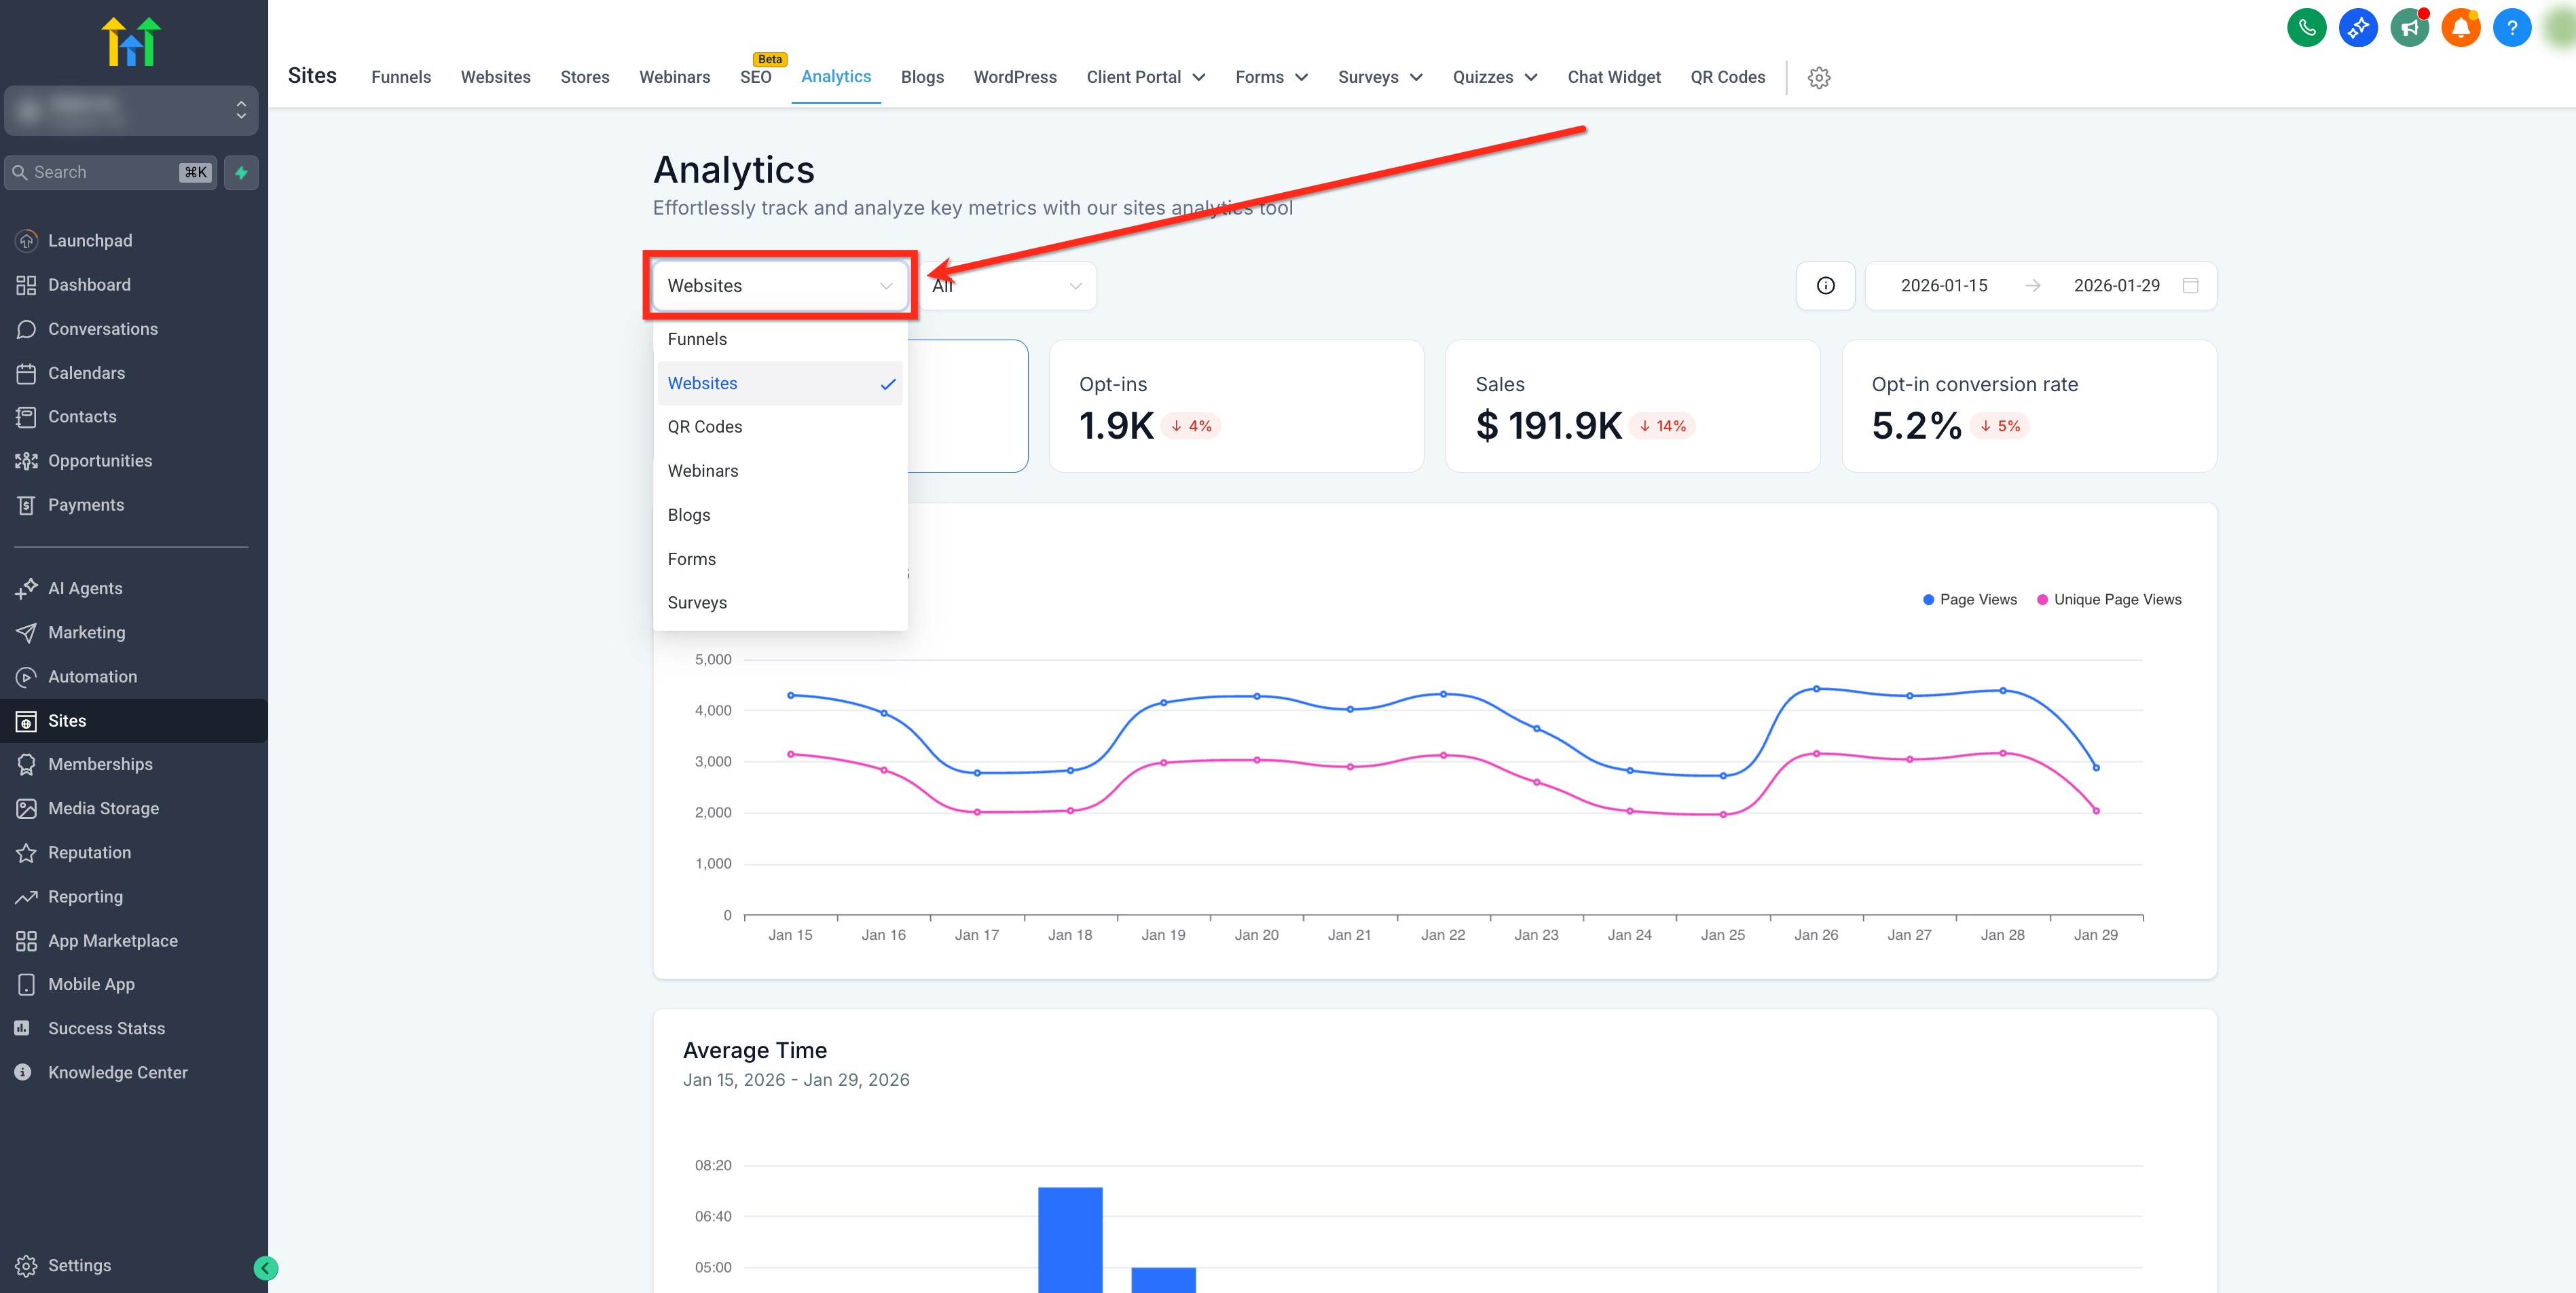
- Open the asset type dropdown and pick the desired type, such as Funnels.
- Optionally choose a single asset from the filtered list to narrow the data.
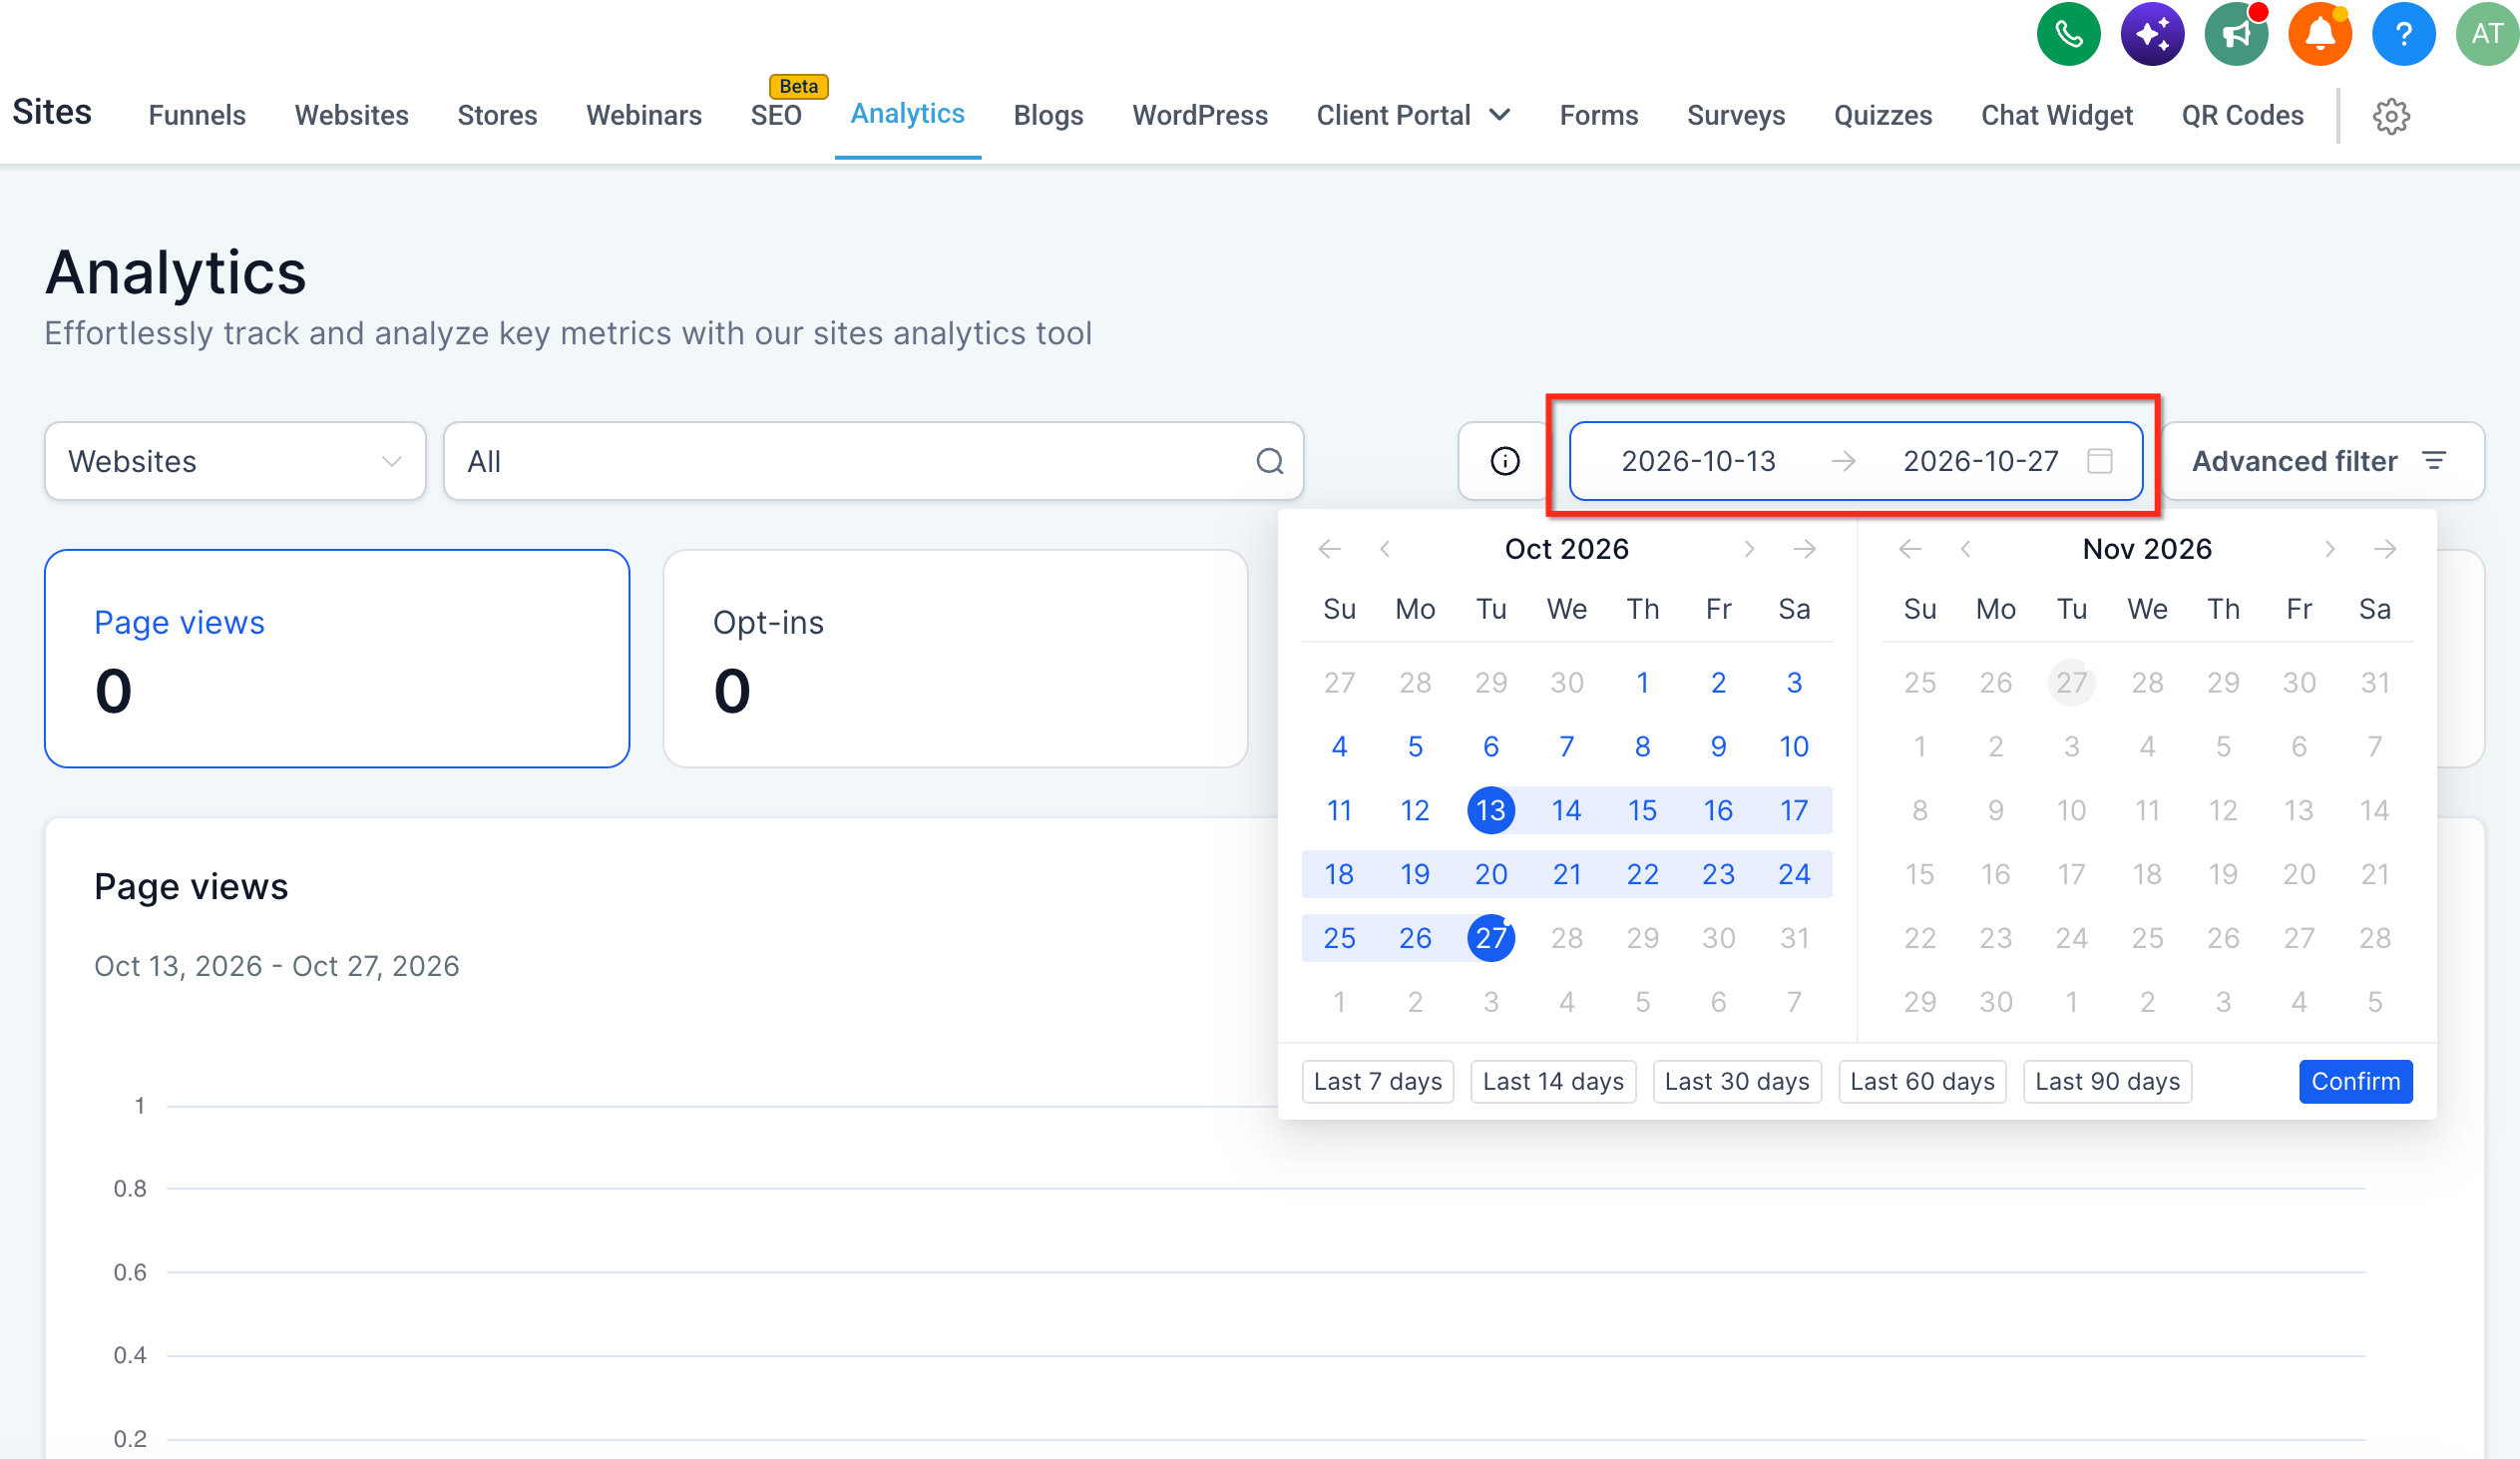
- Click the date range picker in the upper right and select the period you want to analyze.
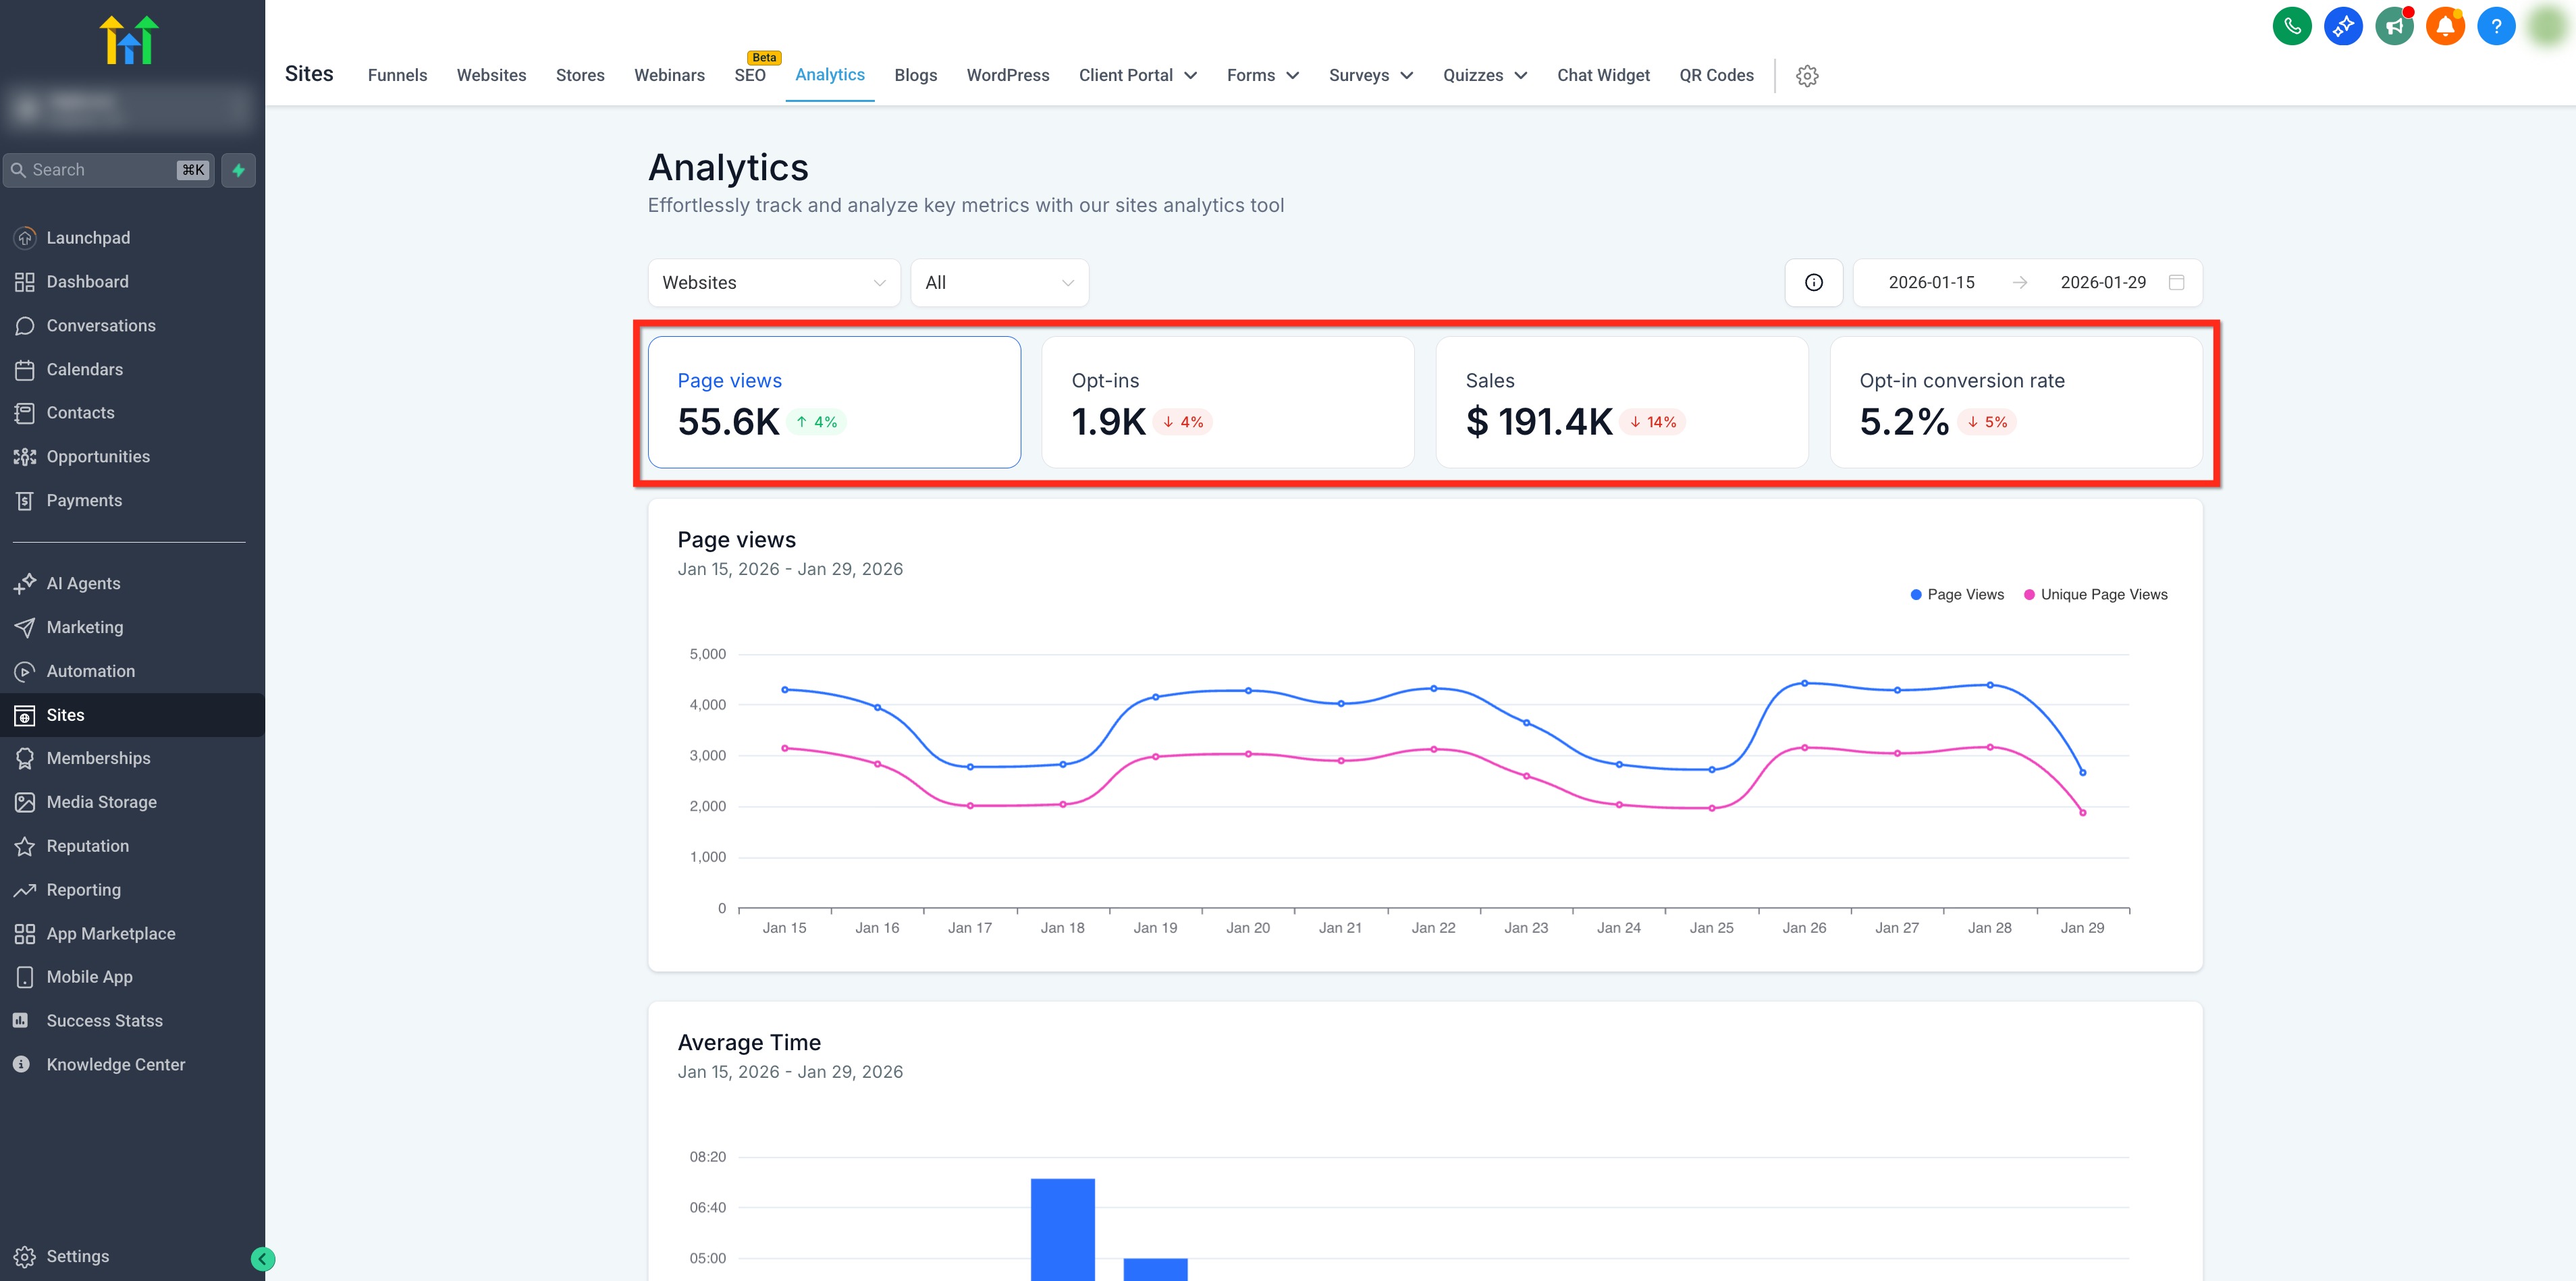
- Click any KPI card to switch the chart view and explore the underlying data.
View QR Code analytics
- Open Sites > Analytics from the left menu.
- Choose QR Codes from the asset type dropdown.
- Select All or pick a particular QR Code to view.
- Set the desired date range using the picker.
- Review the scan metrics and charts displayed on the screen.
07What it looks like in HighLevel
08Settings that matter
- Asset Type dropdown. Controls which family of assets (Funnels, Websites, etc.) is displayed and determines the set of KPI cards shown.
- Specific Asset filter. Limits the data to one particular asset within the chosen family, or aggregates all assets when set to All.
- Date Range picker. Defines the time period for the metrics and enables comparison with the immediately prior period of equal length.
- KPI cards. Act as tabs that change the chart below to focus on the selected metric for the current asset and date range.
09Things to know before you rely on it
- Only one asset type can be active at a time; changing the type resets the Specific Asset filter to All.
- QR Code analytics uses a dedicated view and does not show the standard KPI card toggles.
- Historical QR Code data is only available for scans recorded from August 28, 2024 onward.
- The date range defaults to the last 14 day period if no selection is made.
10If something goes wrong
- KPI toggles are missing when QR Codes are selected. QR Codes use a dedicated analytics view; review the scan metrics and geographic charts instead of KPI cards.
- No data appears for External Tracking assets. Confirm the External Tracking script is installed on the external site and is not blocked.
11How it connects to the rest of HighLevel
- Explore all reporting tools available in HighLevel All Reporting features
- Learn how attribution sources are determined in reports Attribution sources
- Set up Google Ad reporting to view ad performance alongside site analytics Google Ad reporting
- Review pricing options and plan eligibility for reporting features Pricing and plans
Michael's take

Site and Funnel Analytics is a small convenience that can turn a heap of scattered reports into a single, easy to read view. It lets you see how each piece of your online presence is performing without hopping between funnels, pages or separate tools.
A coaching business that runs webinars and uses a landing page could pull the webinar asset type, set a date range, and review the associated metrics.