
01Who this is for
- Marketing managers who need to see which emails reach and engage contacts, so they can refine content.
- Ecommerce owners who want to link email clicks to orders and revenue for better attribution.
02Email campaign statistics, explained
The Email Statistics feature lives under the Marketing section. It aggregates data from Email Campaigns, Workflow email actions and Bulk Actions into a single dashboard. Users can toggle the source filter to show only campaign results or a combined view. The dashboard presents an Engagement Summary, Performance Analysis charts and a list of Top Performing Emails.
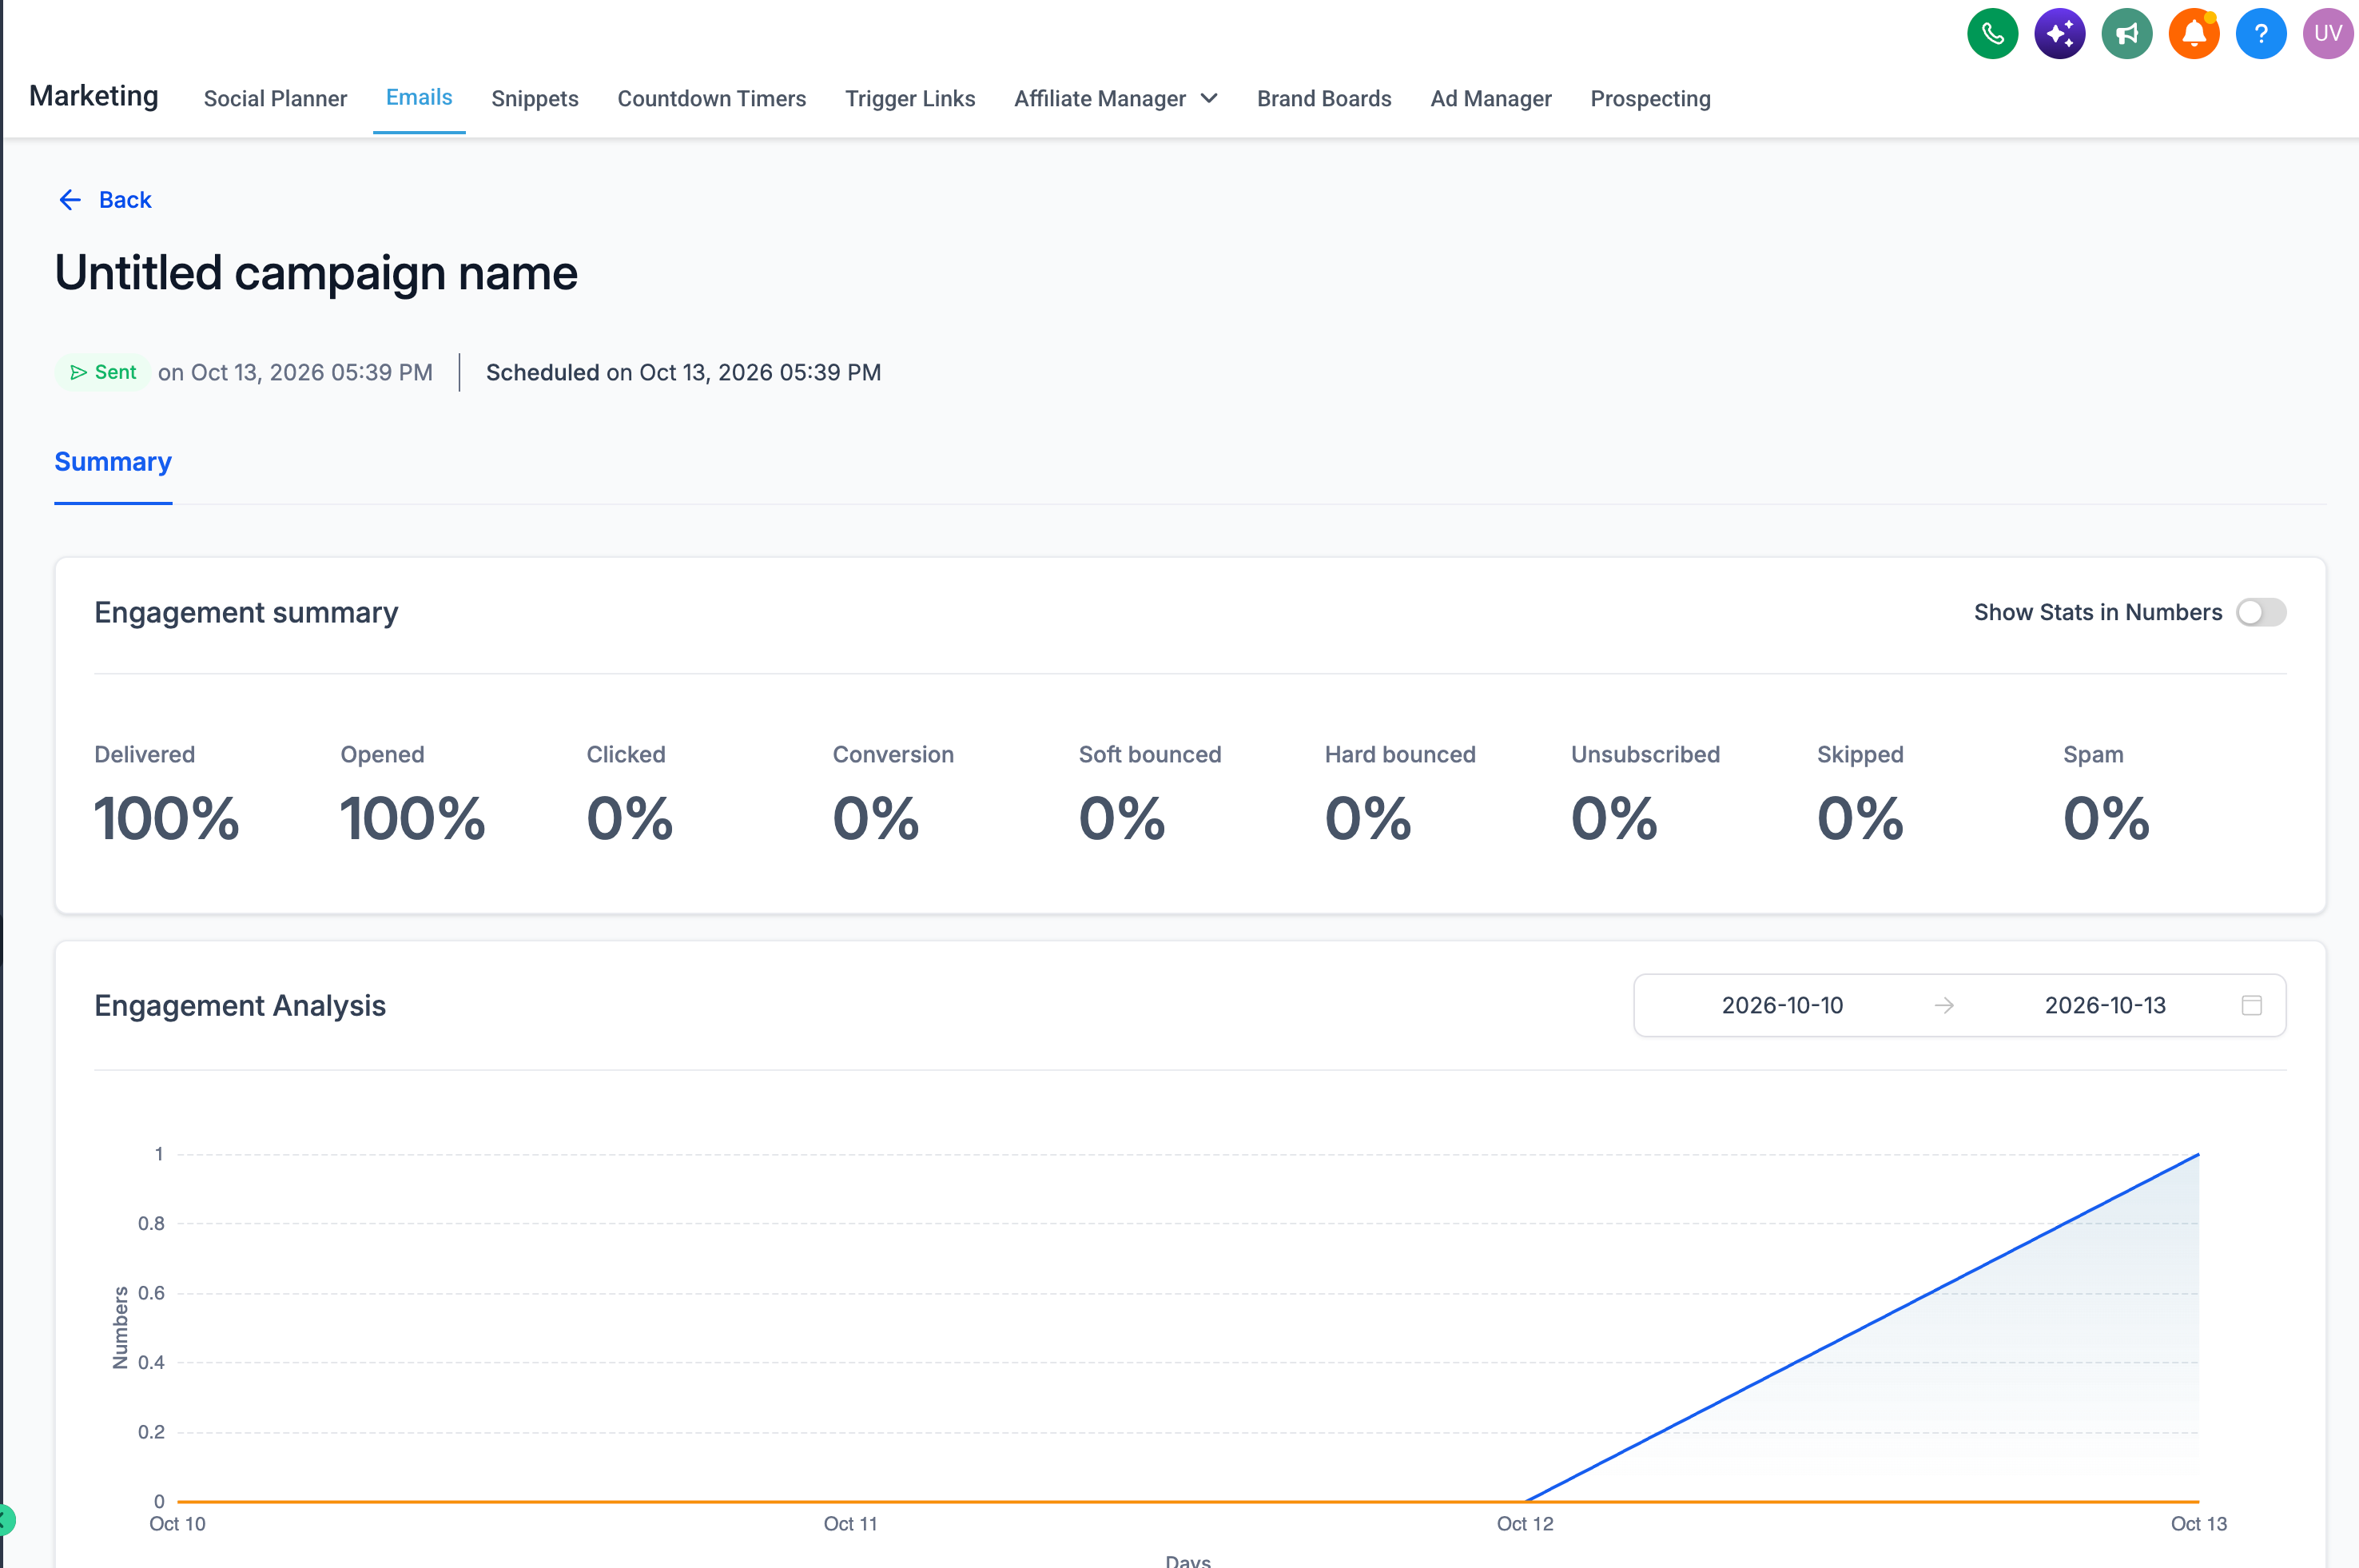
For a deeper dive, each sent campaign has its own statistics side panel. The panel shows a Summary tab with overall metrics and a Details section with recipient level activity such as deliveries, opens, clicks and unsubscribes. Exporting is available from the dashboard and provides a CSV file that can be shared or loaded into other tools.
All data updates in near real time, though some events may take a few minutes to appear. Export links remain active for 30 days after generation.
03How businesses use email campaign statistics
- online coaching business. The coach opens the Email Statistics dashboard, selects the date range for the last month, and filters to Email Campaigns only. They review open and click rates to see which webinar announcements performed best, then export the CSV to compare against signup numbers.
- local restaurant. The owner opens the statistics page for a recent promotional email, checks the Details section for any unsubscribes, and notes the conversion metrics that tie clicks to online orders. This info guides future menu highlight emails.
- real estate agency. The agent navigates to a specific campaign’s statistics, looks at unique opens and clicks, and uses the data to segment contacts for follow up outreach.
04The numbers and rules that matter
- Export download links are valid for 30 days after generation.
05How to set up and use email campaign statistics in HighLevel
Access the Email Statistics dashboard
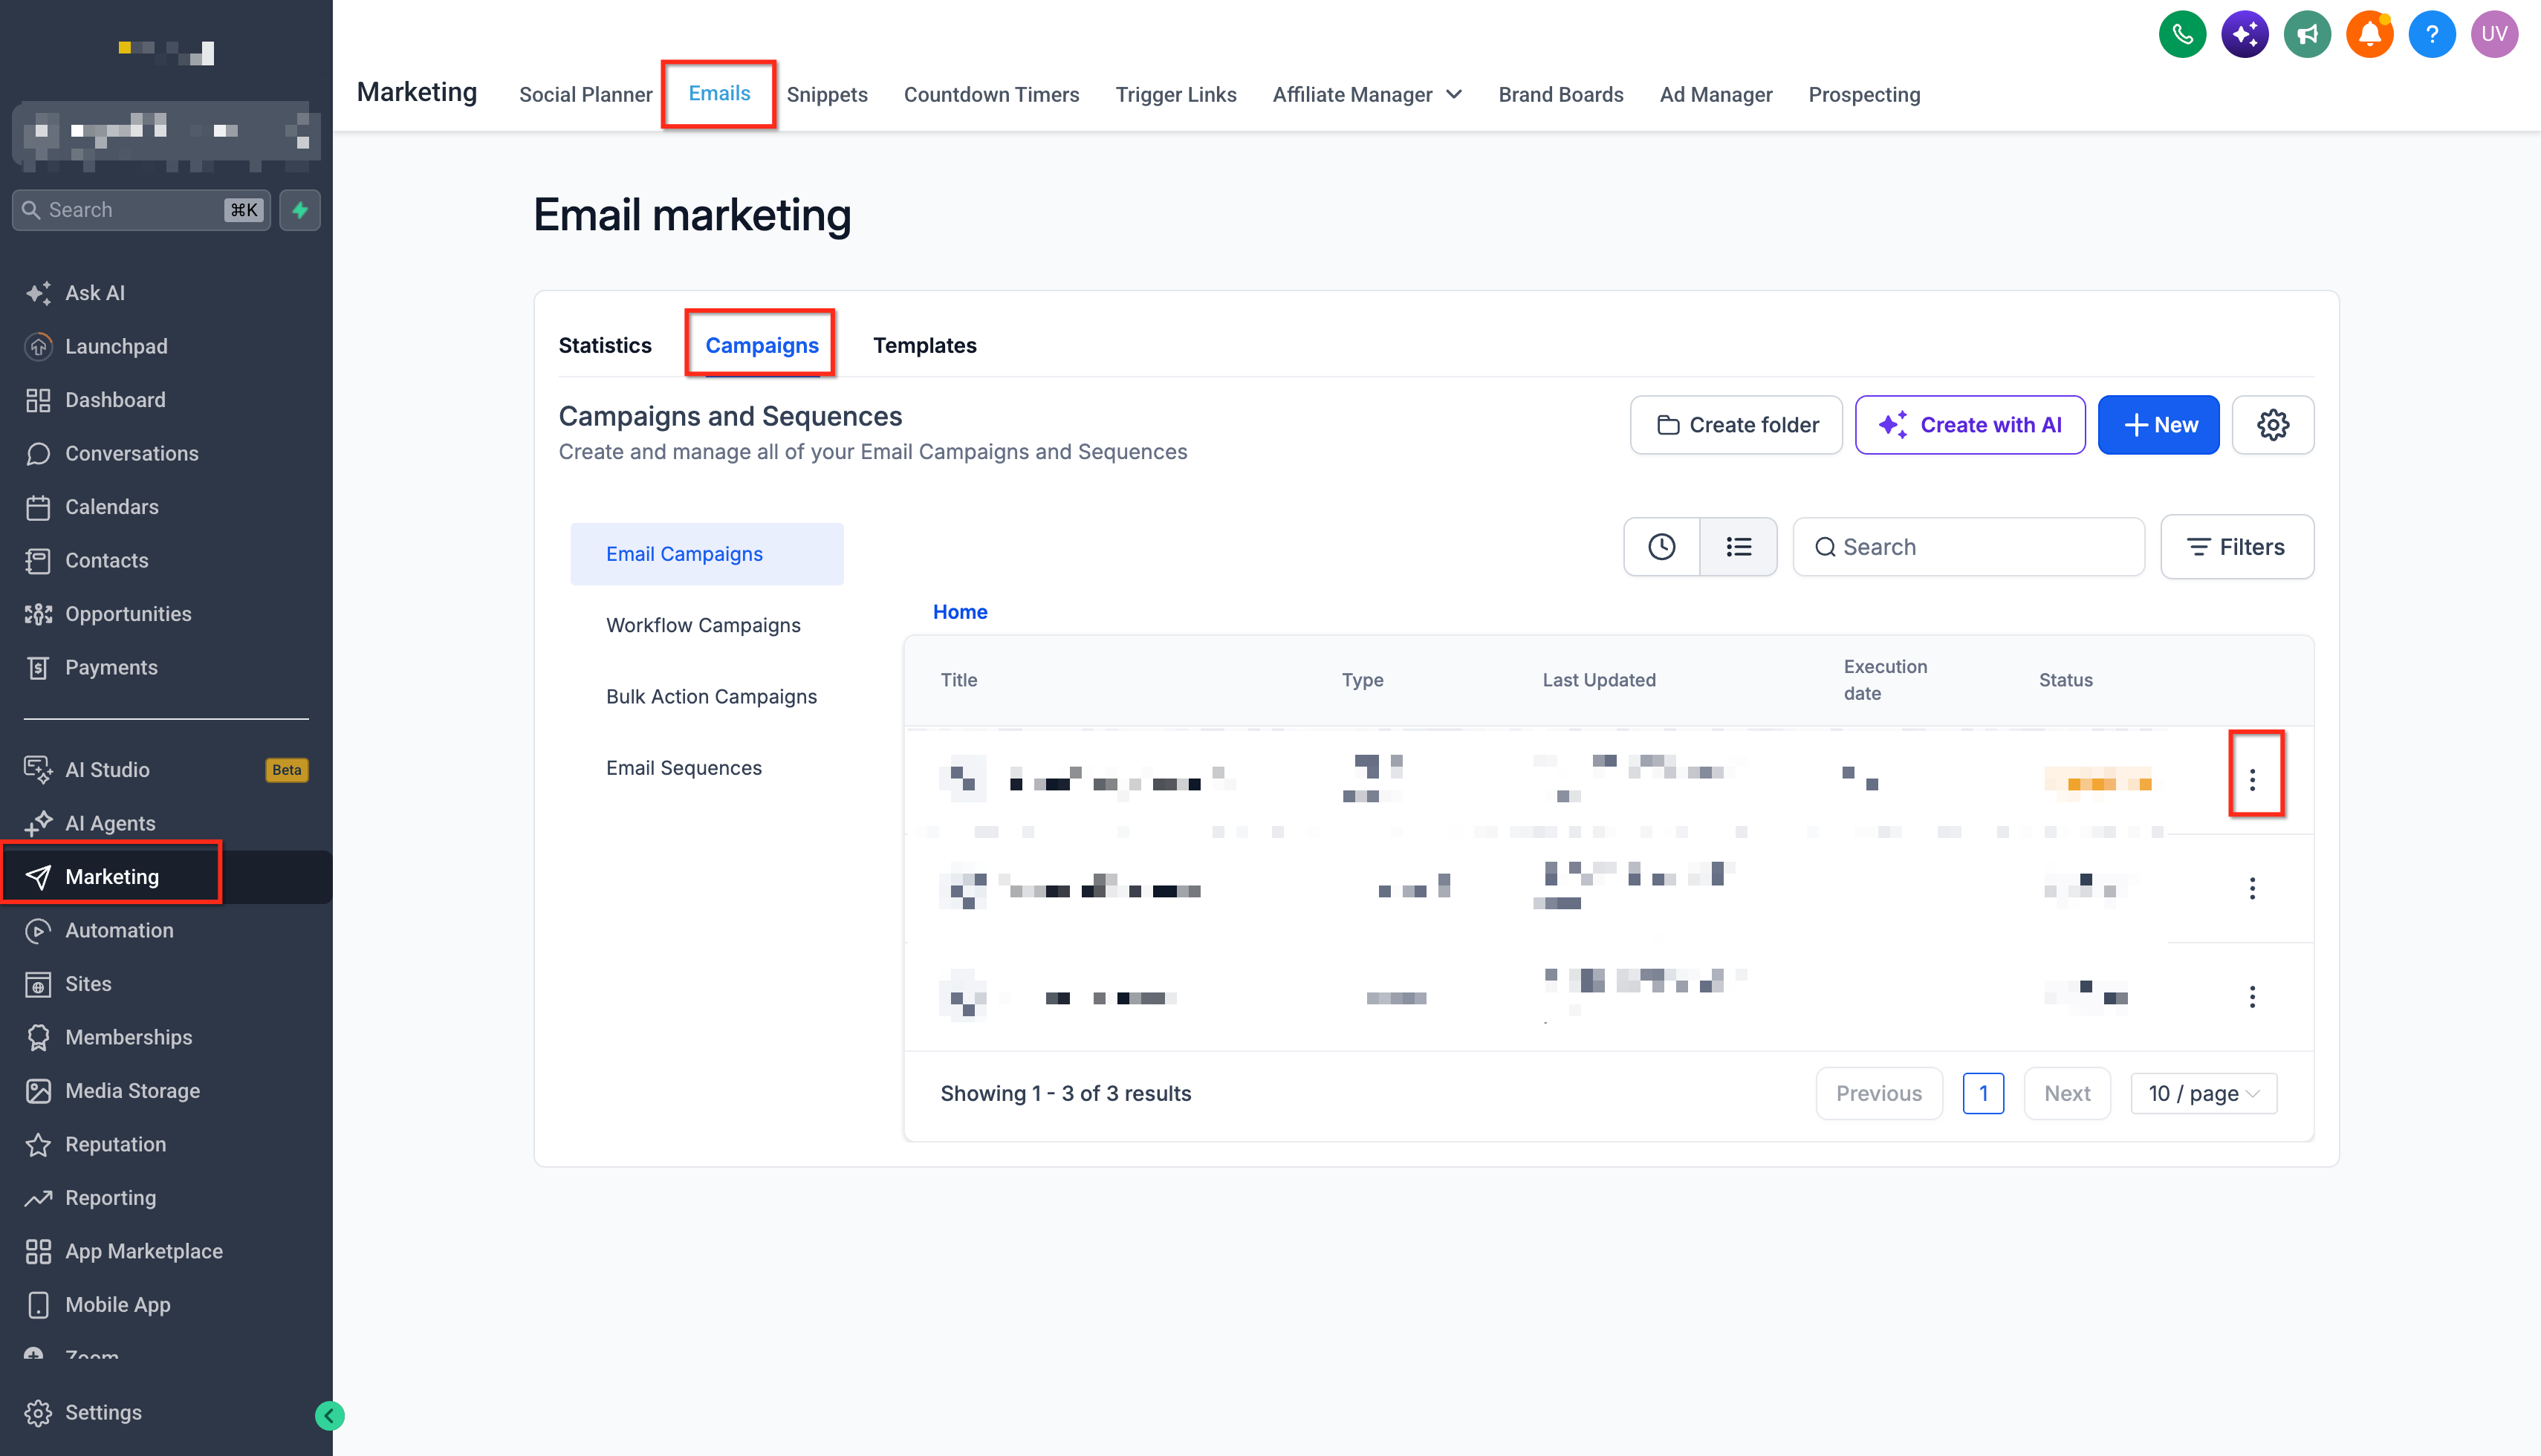
- Open the Marketing menu and choose Emails.
- Click the Statistics tab at the top of the page.
- Find the email source dropdown near the dashboard header.
- Pick Email Campaigns to isolate marketing sends.
- Set the desired reporting date range.
View statistics for an individual email campaign
- Open Marketing, then Emails, and go to Campaigns.
- Locate the campaign you want to examine.
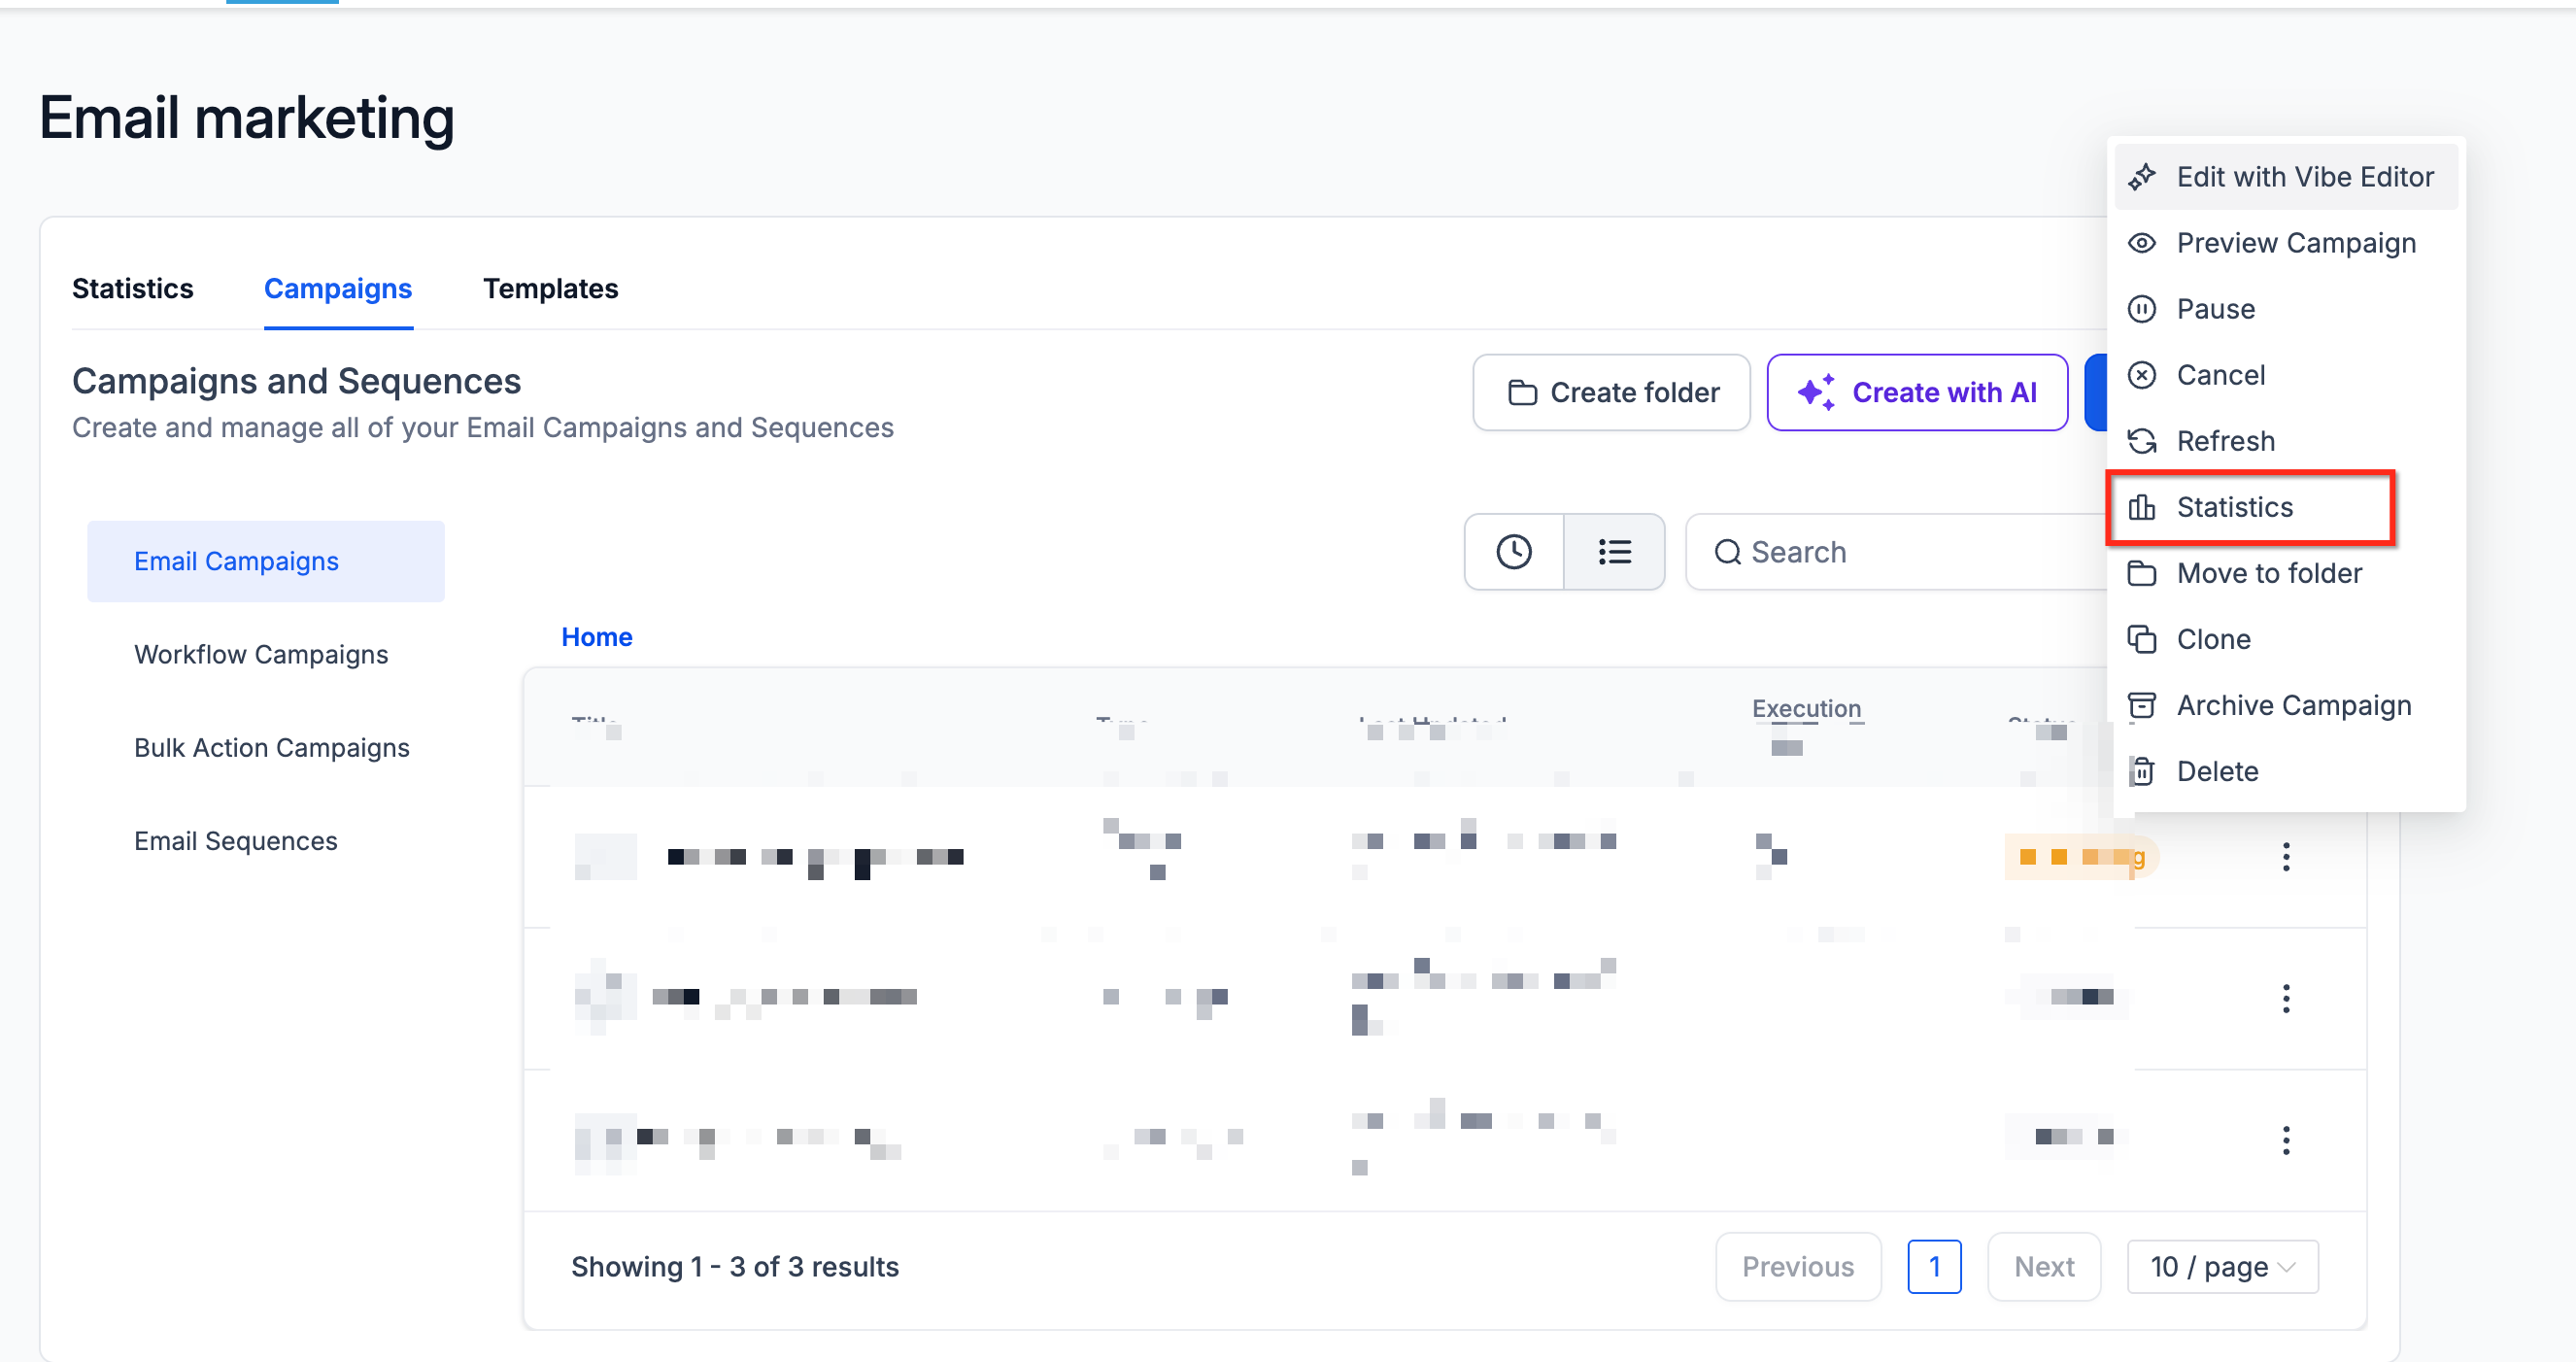
- Open the three dot menu (⋮) beside the campaign.
- Choose Statistics from the menu.
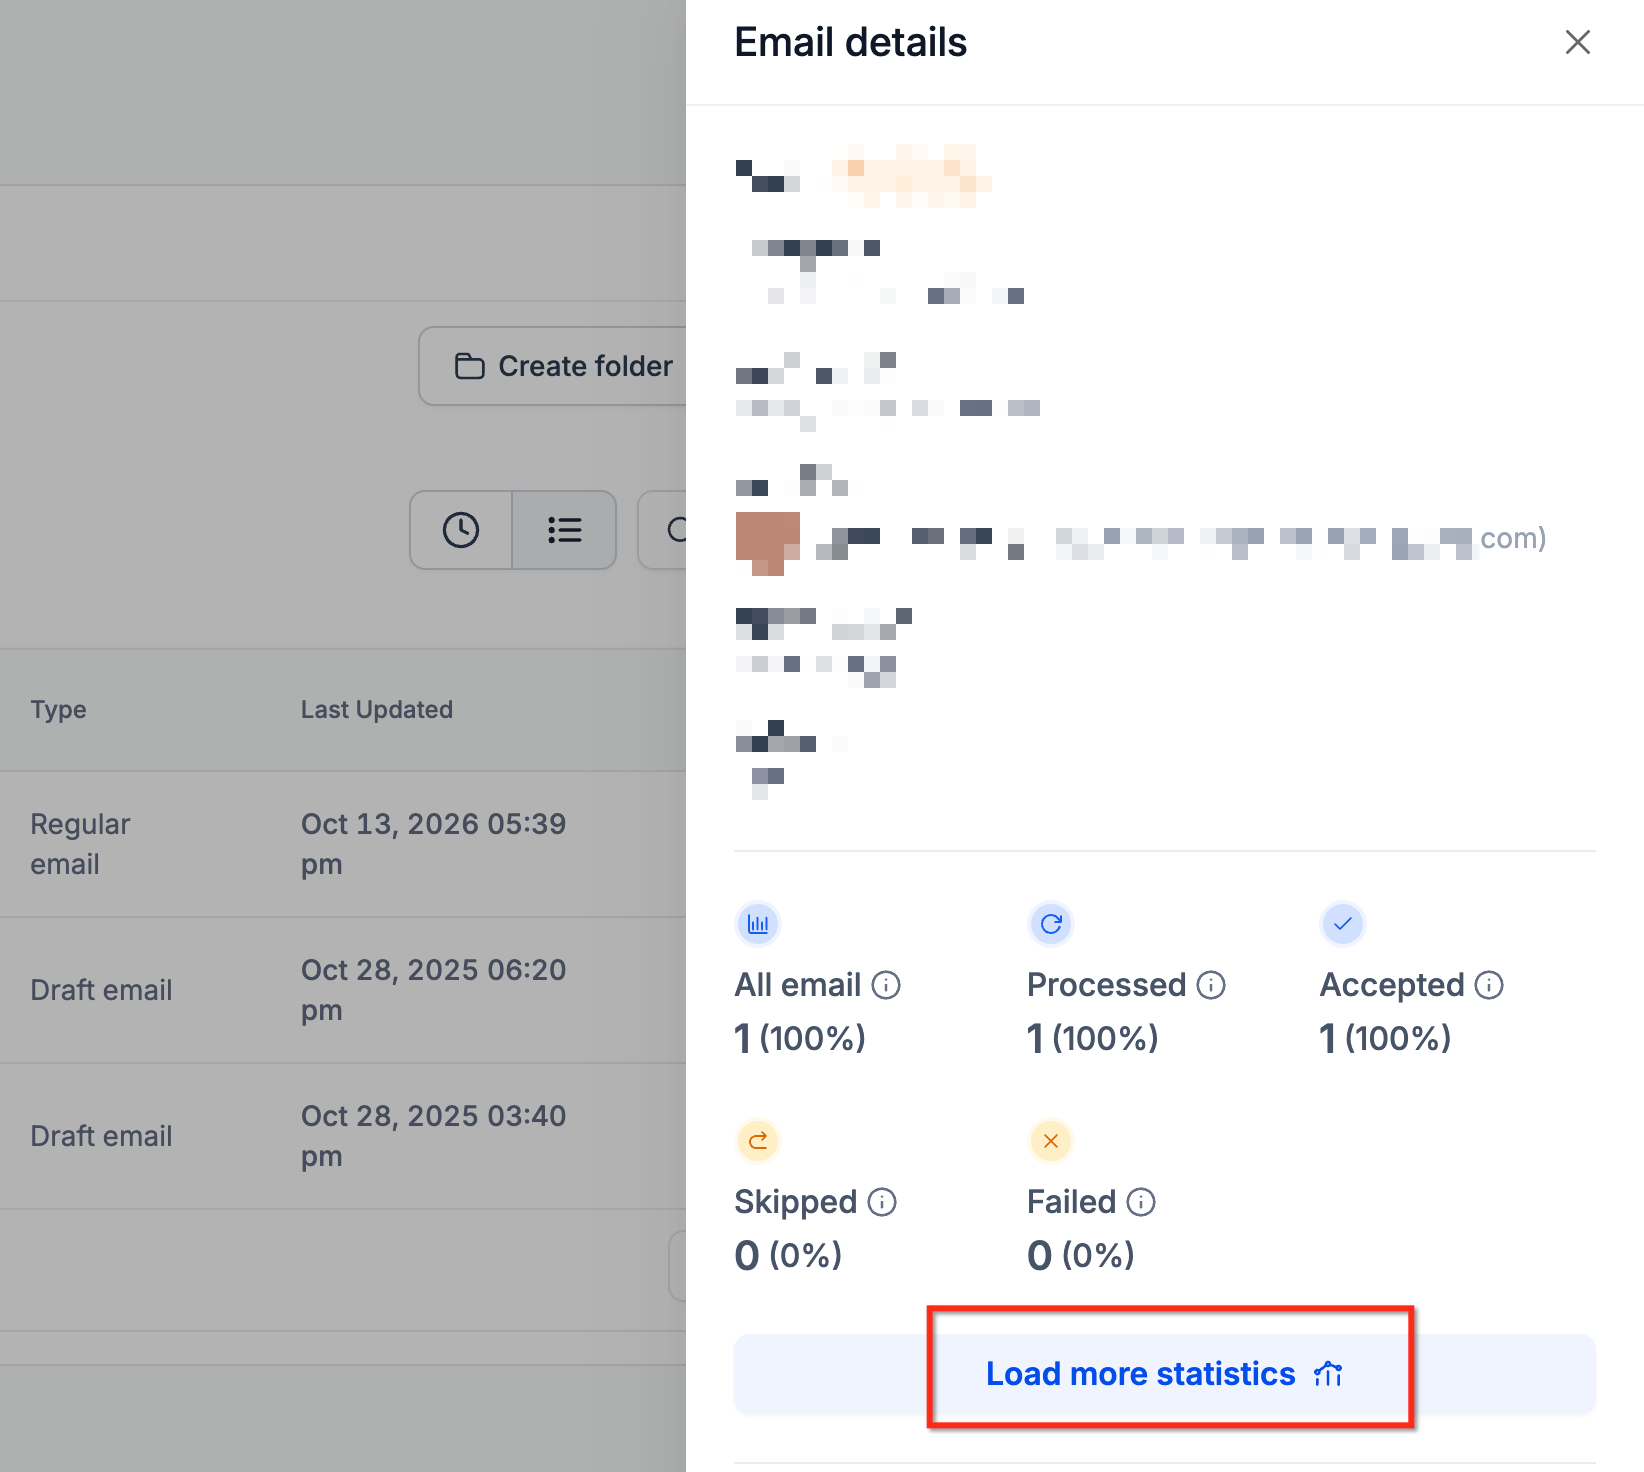
- In the side panel, click Load More Statistics.
- Select the Summary tab to see overall metrics.
- Scroll to the Details area for recipient level activity.
Export email campaign statistics
- Go to Marketing, then Emails, and open Statistics.
- Choose the reporting source and set the date range.
- Press the Export button.
- Enter the email address that should receive the file.
- Click Export again to submit the request.
- Open the received email and download the CSV link.
06What it looks like in HighLevel
07Settings that matter
- Email source dropdown. Controls whether the dashboard shows only Email Campaign data or combines data from workflows and bulk actions.
- Reporting date range. Limits the statistics to a specific period, allowing trend analysis over days, weeks or months.
- Attribution window. Defines how many days after an email interaction a purchase can be credited to that email; the default is five days.
08Things to know before you rely on it
- The default attribution window is five days but can be customized.
- Export links are usable for 30 days after they are generated.
- Open and click tracking depend on the configured email service provider.
- Sample data may appear in the dashboard; clear it before analyzing real results.
09If something goes wrong
- Statistics do not appear immediately after sending. Wait a few minutes for near real time updates and confirm the correct source and date range are selected.
- Opens show but no clicks are recorded. Verify that click tracking is turned on and that the links are supported by the tracking configuration.
- Missing delivery or bounce data. Check the capabilities of the connected email service provider; some providers omit certain events.
10How it connects to the rest of HighLevel
- Email Statistics summary page overview Summary page
- Understanding email conversion and revenue attribution Conversion attribution
- Click performance details in email statistics Click performance
Michael's take

Email campaign statistics give a small business a clear view of how each send performs, from delivery to revenue, so you can stop guessing and start adjusting. It’s a cheap way to turn raw numbers into actionable tweaks.
Don’t mistake a high open rate for sales success; look at the conversion metrics too.