
01Who this is for
- Founders of SaaS startups, need quick insight into which email subject lines and calls to action drive engagement.
- Marketing managers at agencies, rely on detailed campaign data to adjust client outreach and reporting.
- Ecommerce owners, want to see conversion and revenue attributed to each promotional email.
02Email statistics summary page, explained
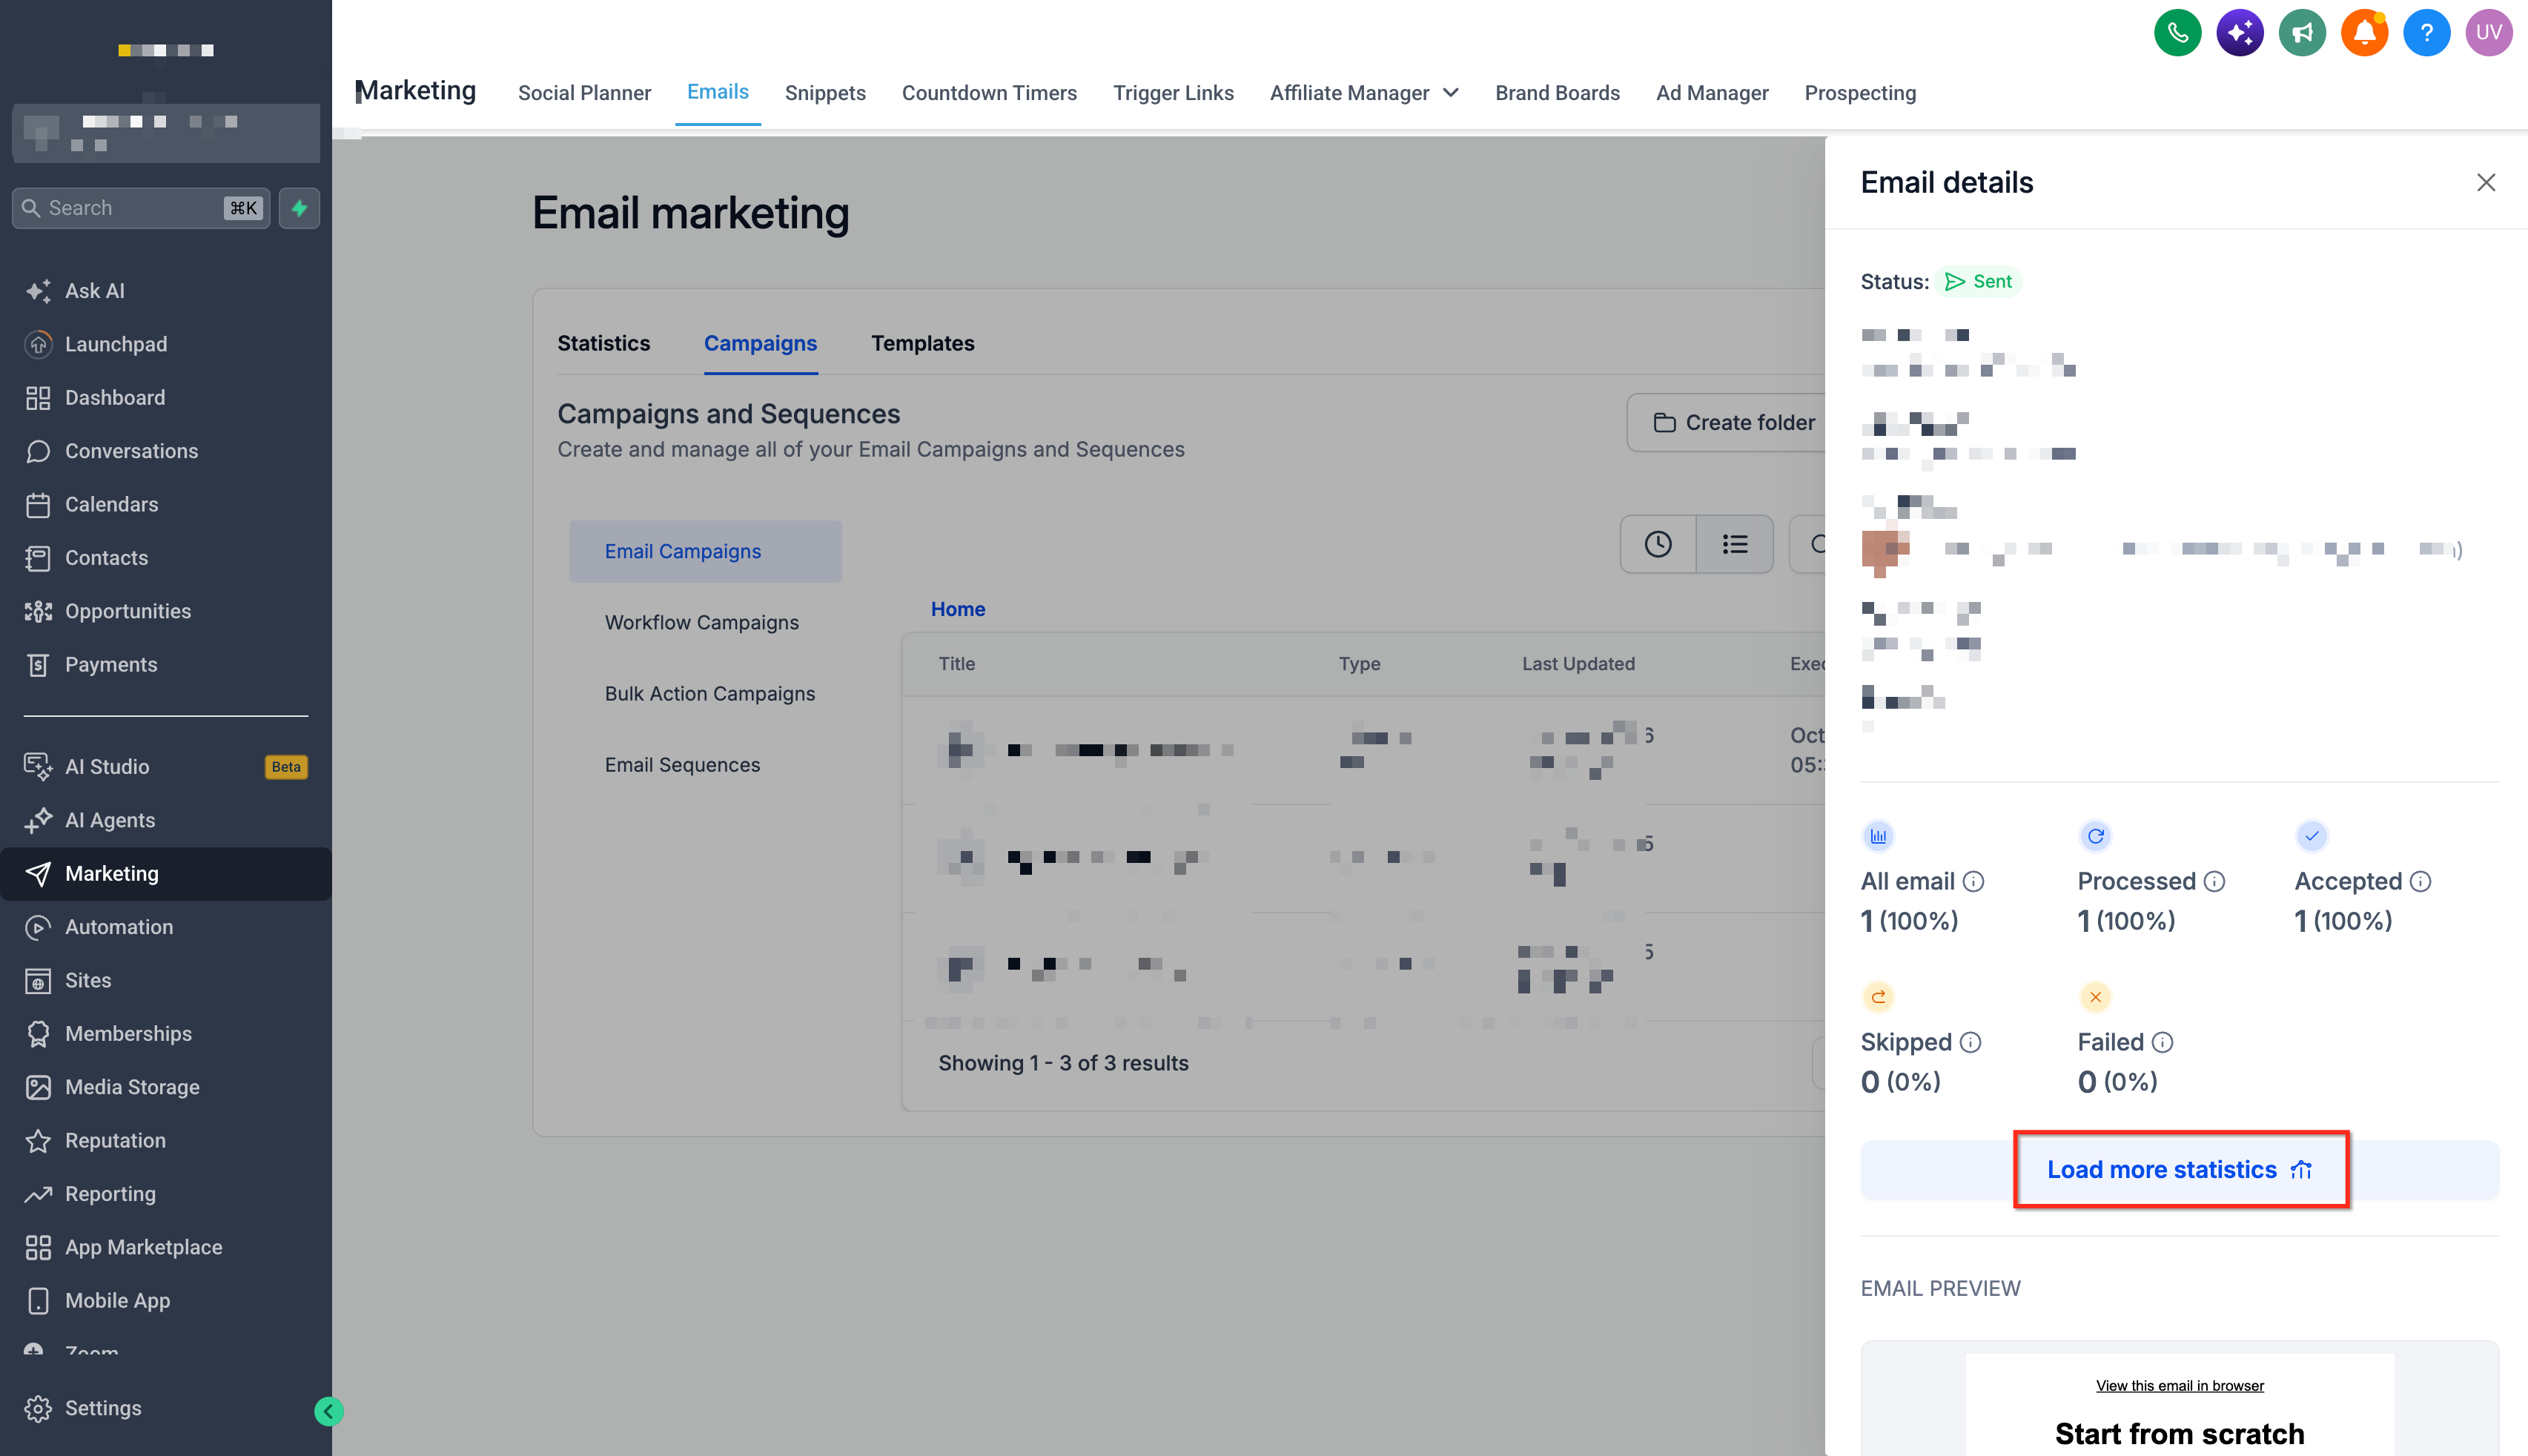
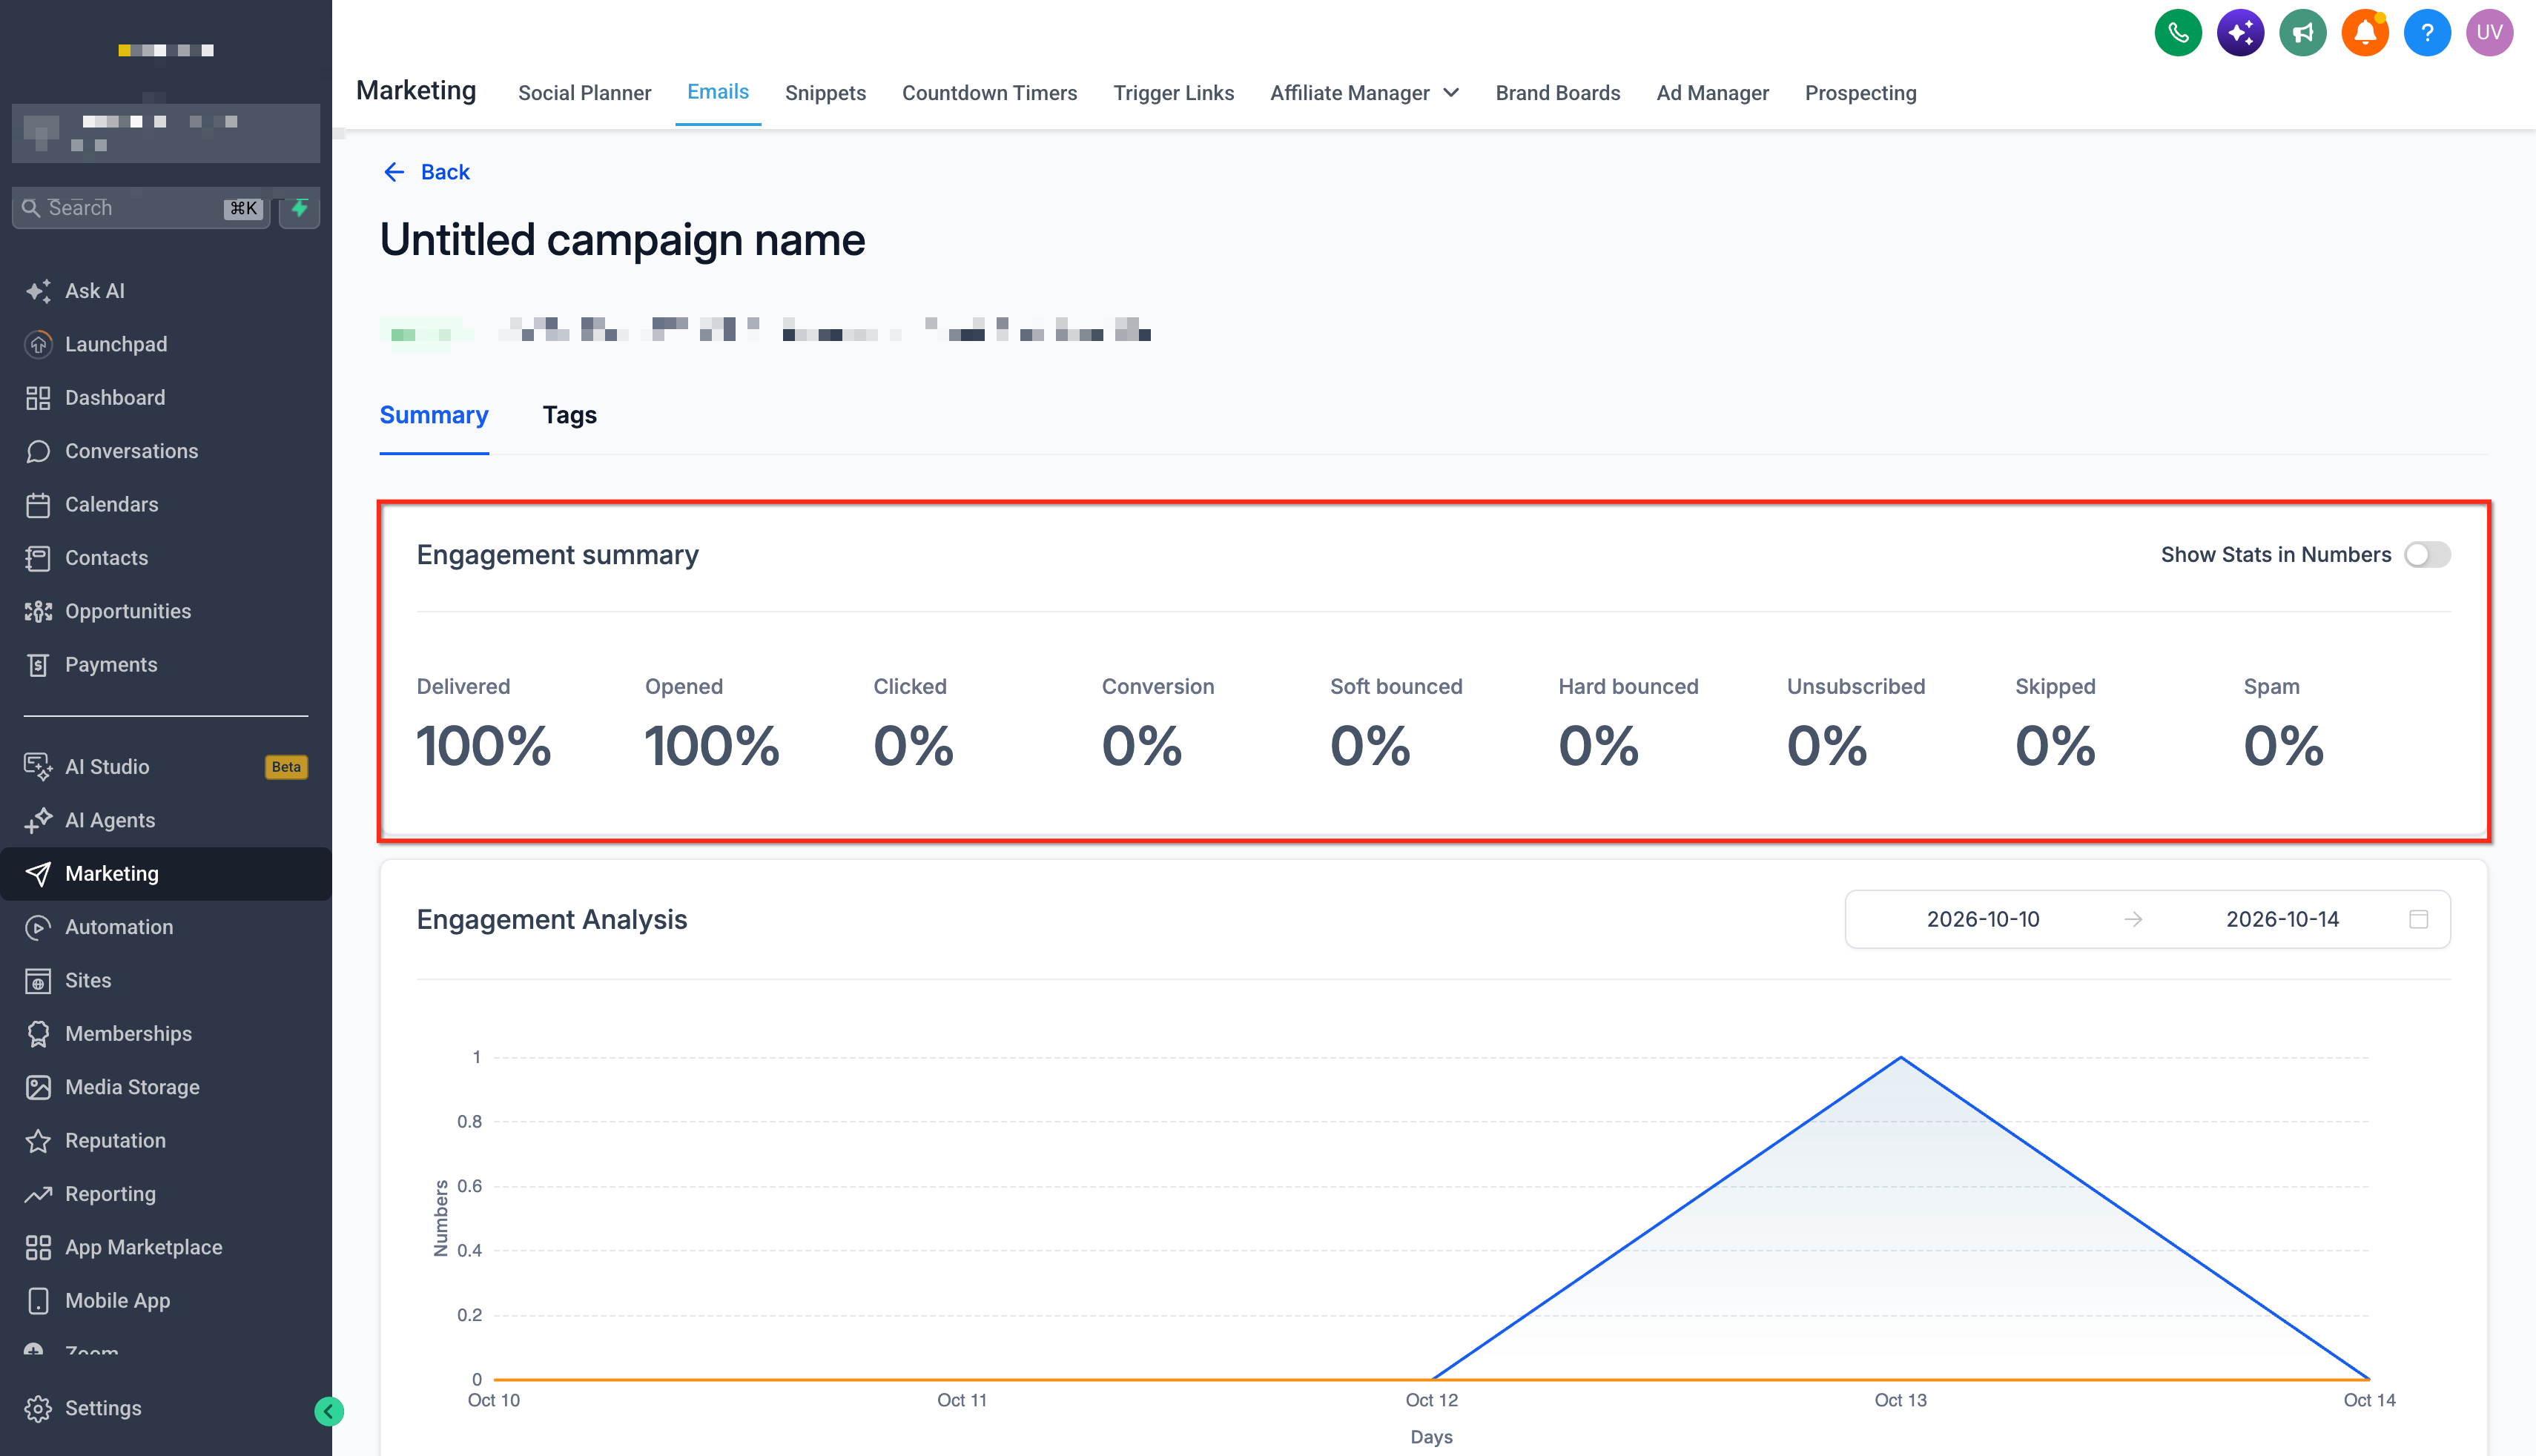
The Summary Page lives inside the individual campaign statistics view. After opening a sent email campaign, a side panel offers a link to load the full statistics page. The page contains two tabs, Summary and Details, that present aggregate numbers and recipient level activity.
Metrics include Delivered, Opened, Clicked, Conversion, Soft Bounced, Hard Bounced, Unsubscribed, Skipped and Spam. Each metric follows a standard formula, such as Open Rate = Unique Opens ÷ Delivered Emails × 100. An Engagement Analysis Chart plots Delivered, Opened and Clicked over the reporting period, letting you spot peaks and troughs.
Data appears as soon as sending and tracking events are recorded. Availability depends on the configured email service provider and on whether open and click tracking are enabled. Some metrics may take extra time to populate.
03How businesses use the Email Statistics Summary Page
- Real estate agency. The agency opens the Summary Page for a new property listing email, reviews open and click counts, and checks which contacts opened but did not click to refine follow up calls. The Details tab helps identify exact recipients who engaged.
- Ecommerce store. After sending a promotion, the store accesses the Summary Page to see conversion numbers and revenue per recipient. The chart shows whether clicks aligned with purchase timing, guiding future discount timing.
- Fitness studio. The studio examines the Summary Page for a class schedule newsletter, looks at bounce and unsubscribe rates, and uses the Details tab to flag contacts with delivery issues for list cleaning.
04The numbers and rules that matter
- Delivery Rate Formula: (Delivered Emails ÷ Total Emails Sent) × 100.
- Open Rate Formula: (Unique Opens ÷ Delivered Emails) × 100.
- Click Rate Formula: (Unique Clicks ÷ Delivered Emails) × 100.
- Unsubscribe Rate Formula: (Unsubscribed Recipients ÷ Delivered Emails) × 100.
05How to set up and use the Email Statistics Summary Page in HighLevel
Access the Email Statistics Summary Page for a specific campaign
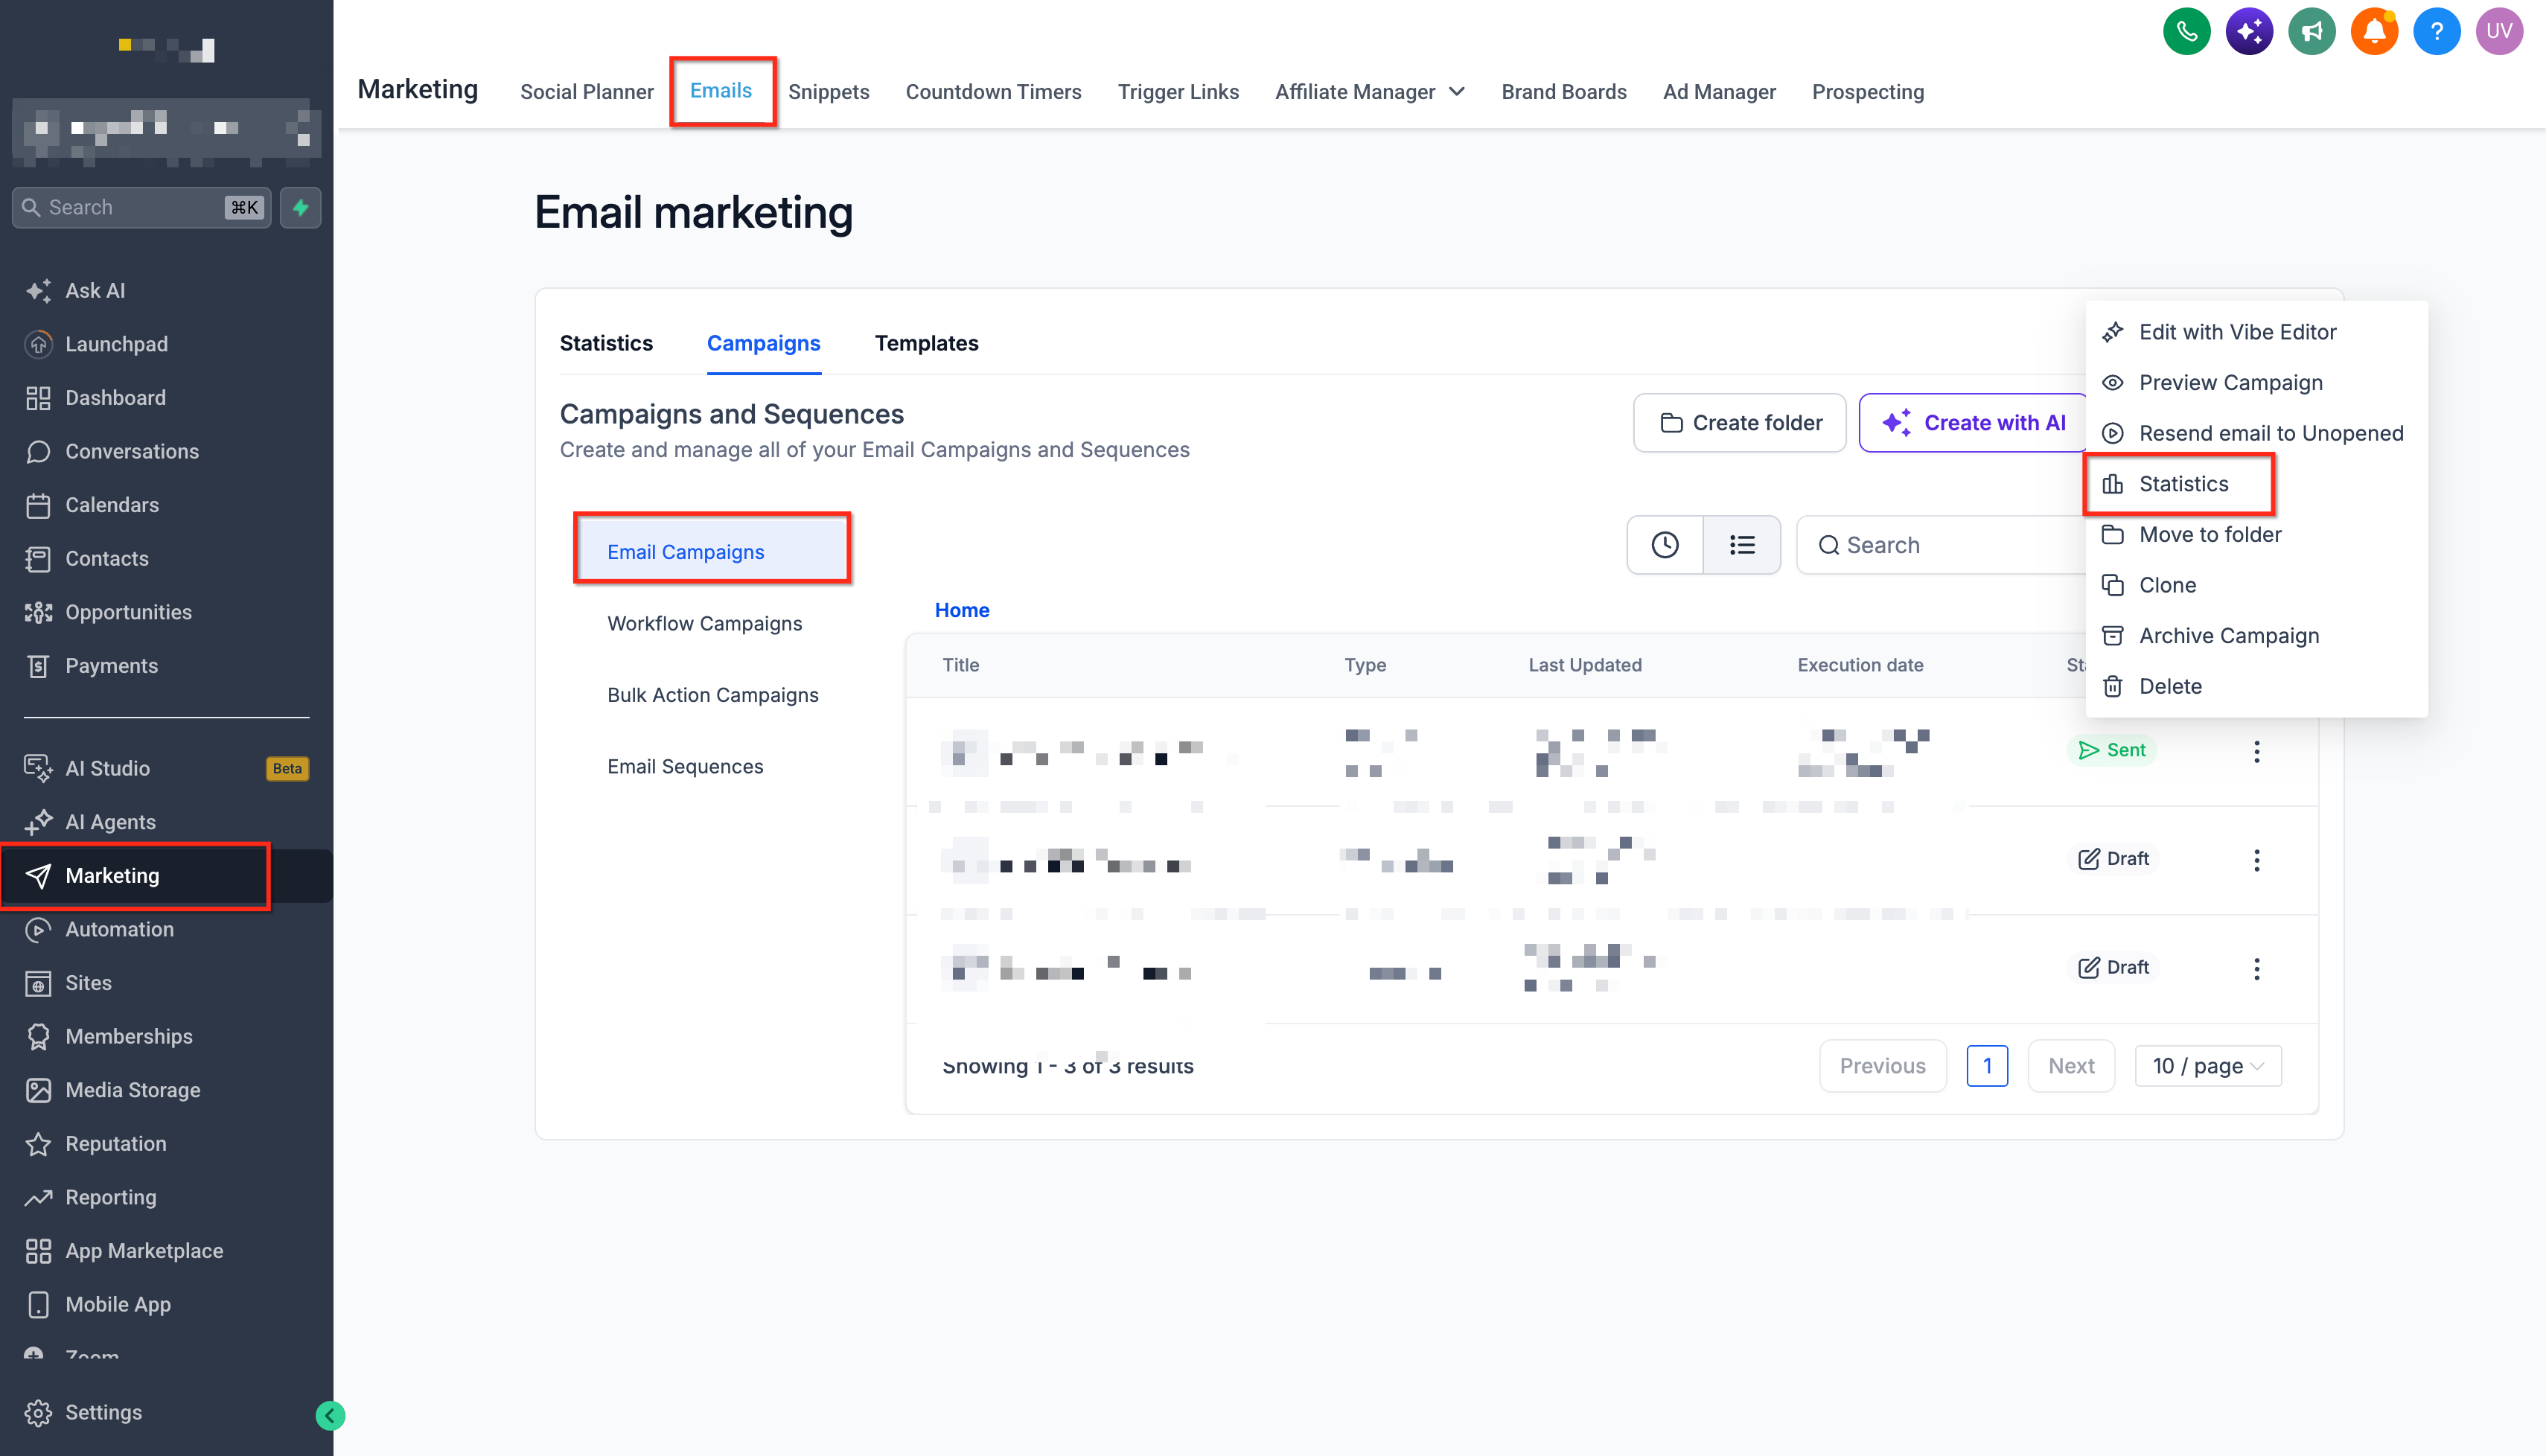
- Open the Marketing menu and choose Emails in the desired subaccount.
- Click the Campaigns tab to list all email campaigns.
- Find the email campaign that has already been sent and that you wish to review.
- Select the three dot (⋮) icon located next to the campaign title.
- Choose Statistics from the dropdown menu.
- In the side panel that appears, press Load More Statistics.
- When the full page loads, click the Summary tab at the top.
- Read the delivery, engagement and conversion numbers displayed.
- Scroll down and click the Details tab to view activity for individual contacts.
06What it looks like in HighLevel
07Things to know before you rely on it
- Open and click counts rely on the tracking capabilities of the connected email service provider; some providers only supply open and click data.
- The default attribution window for conversions is five days; purchases outside this period are not credited to the campaign.
- Metrics may be delayed while the email provider processes delivery events, so some numbers can appear later than the send time.
08If something goes wrong
- Missing statistics despite the campaign being sent. Check the email provider and tracking configuration; some SMTP services expose only limited open and click events.
- Opens appear but no clicks are recorded. Verify that the email’s links are set up for tracking and that the sending configuration supports click tracking.
- Open rates higher than expected. Remember that automatic image loading or privacy features can generate recorded opens even if the recipient did not read the email.
- Conversion summary shows $0 despite clicks. Ensure that a purchase meets the attribution rules and occurs within the five day attribution window. (per HighLevel's help center, checked November 2026)
- Confusion between Skipped, Failed and Bounced emails. Skipped means the email was not sent because of a restriction; Failed indicates a sending error; Bounced signals a delivery failure, either temporary (soft) or permanent (hard).
- Delivered count differs from total targeted contacts. Review the Details tab to see which contacts were skipped, failed or bounced, which explains the difference.
09How it connects to the rest of HighLevel
- Learn how click tracking works for email campaigns. Click tracking guide
- Understand how email conversion and revenue attribution are calculated. Conversion attribution
- View the unified Email Statistics dashboard that aggregates data from multiple sources. All in one dashboard
Michael's take

When campaigns land in spam folders or bounce back, you never know why your message never reaches the inbox. The Summary Page gives you a single place to see delivery, opens, clicks and revenue so you can pinpoint the weak spot before you waste another send.
The first setting I would get right is the attribution window. Make sure the default five day window matches your sales cycle, or adjust it so conversions are captured accurately. Once that’s set, I’d dive into the delivery and bounce numbers to clean the list and protect sender reputation.