
01Who this is for
- Marketing agencies: need to merge ad spend and lead data to show ROI on client dashboards.
- Ecommerce owners: can calculate cost per acquisition by combining sales and traffic metrics.
- SaaS Founders: can track churn rate versus new sign ups in a single KPI widget.
02Custom metrics, explained
Custom Metrics let you define new key performance indicators inside the platform. You select data from various sources, write a formula using up to four metrics, and decide how the result appears, such as a percentage, currency, integer, or float. The metric can be added as a widget to any dashboard or report and works with snapshots for subaccount deployment.
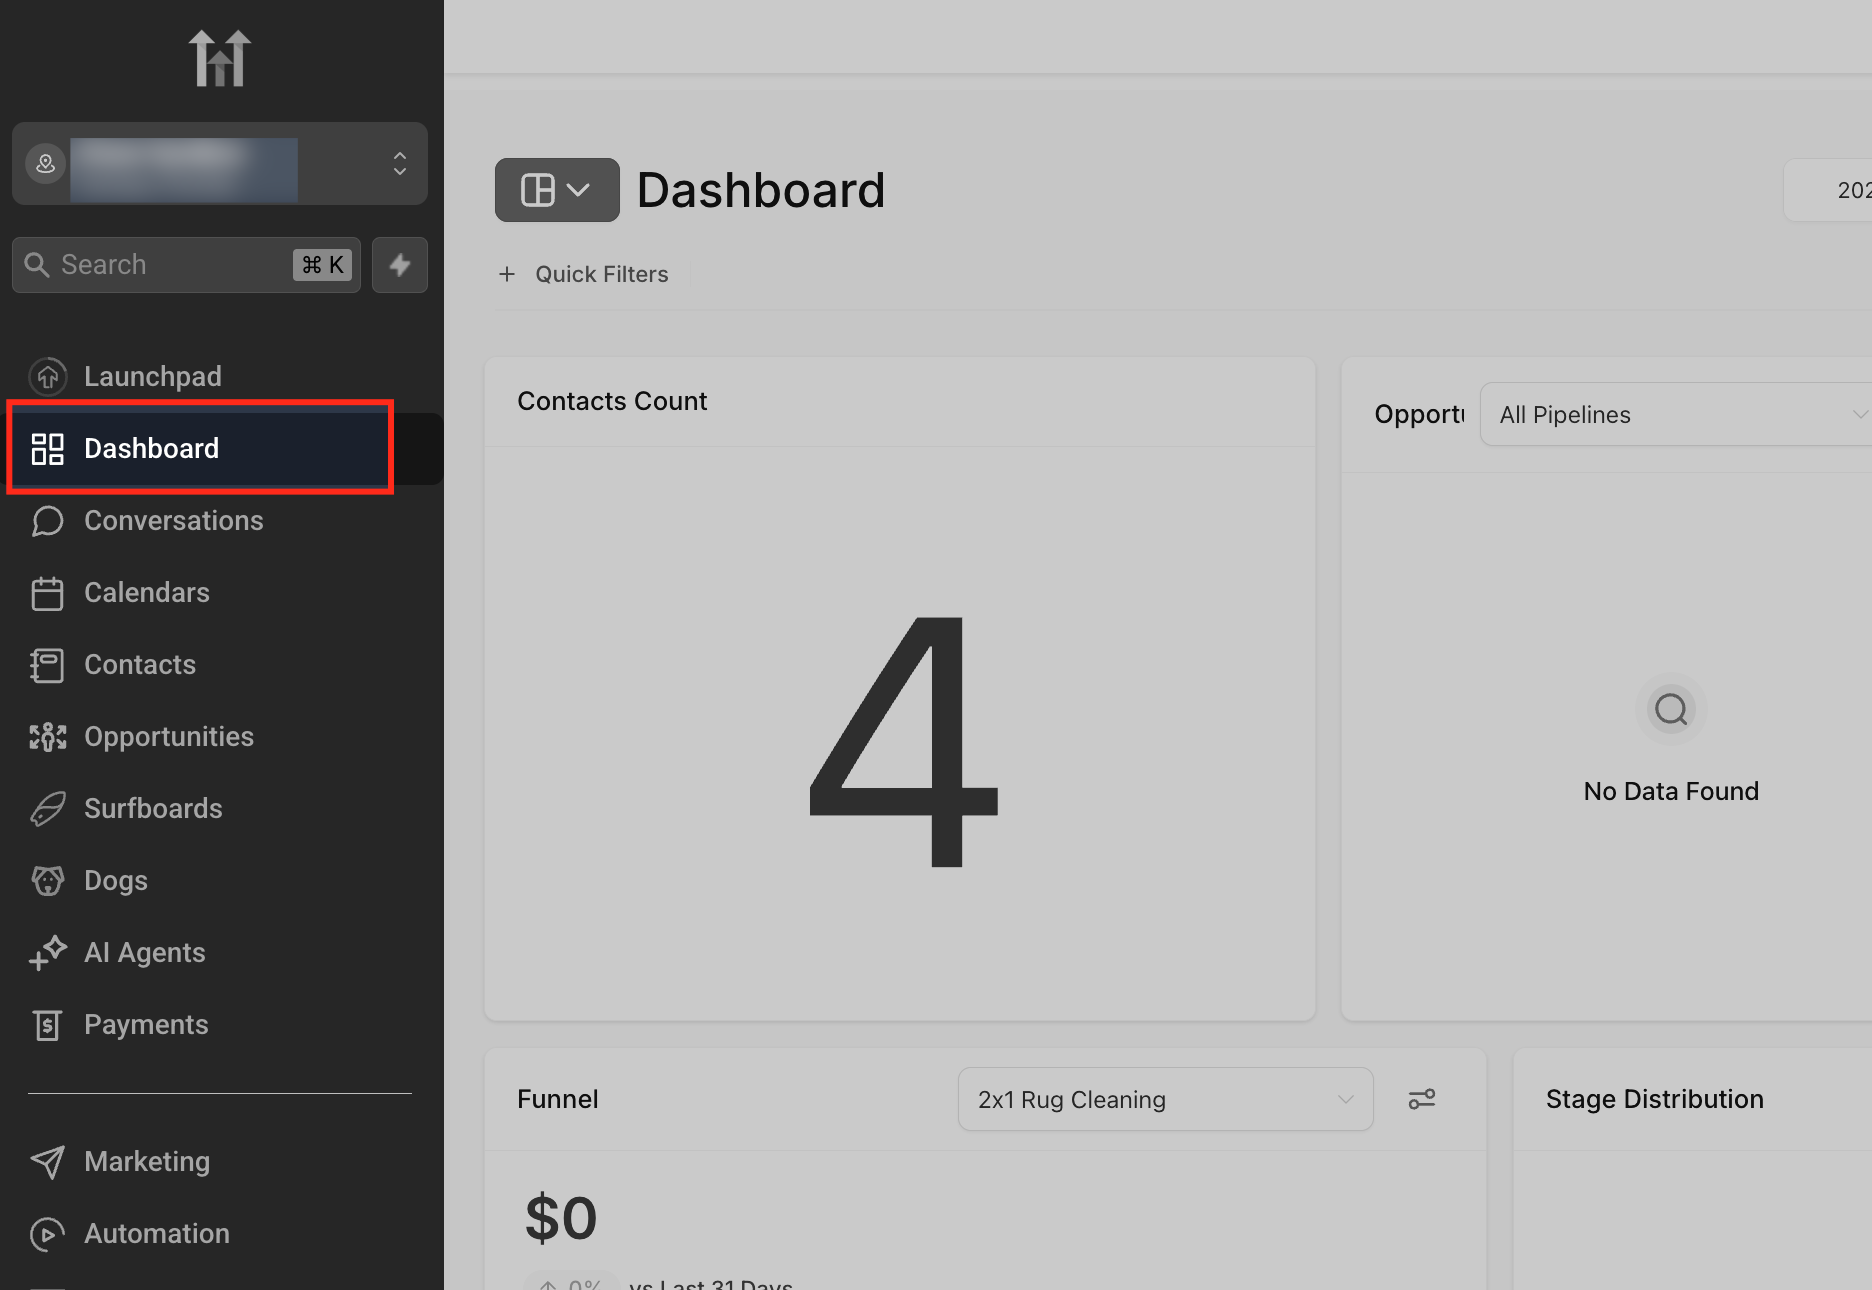
The feature lives within the dashboard area. From the left menu select Dashboard, enter edit mode, add a widget, and choose the Custom Metrics tab. From there you create a new metric or clone an existing one, set its name, display type, description, formula, date properties, and trend direction, then save it to make it available on your dashboards.
03How businesses use custom metrics
- Digital marketing agency. Combine Meta Ads spend and Google Analytics conversions in a formula, set the display to Currency, and add the resulting metric as a widget on client performance dashboards.
- Real estate brokerage. Create a metric that divides closed deals by total leads, choose Percentage as the data type, set the trend direction to increase is positive, and place the widget on the team performance dashboard.
- Health clinic. Build a metric that adds appointments and subtracts cancellations, select Integer for the display, configure date properties for each source, and add the widget to the financial overview dashboard.
04The numbers and rules that matter
- Available on plans $497 and above (per HighLevel's help center, checked November 2026).
- You can combine up to four different metrics in a formula.
05Before you start
- You must be on a plan priced at $497 or higher to access Custom Metrics (per HighLevel's help center, checked November 2026).
06How to set up and use custom metrics in HighLevel
Set up a custom metric
- Open the Dashboard from the left hand menu.
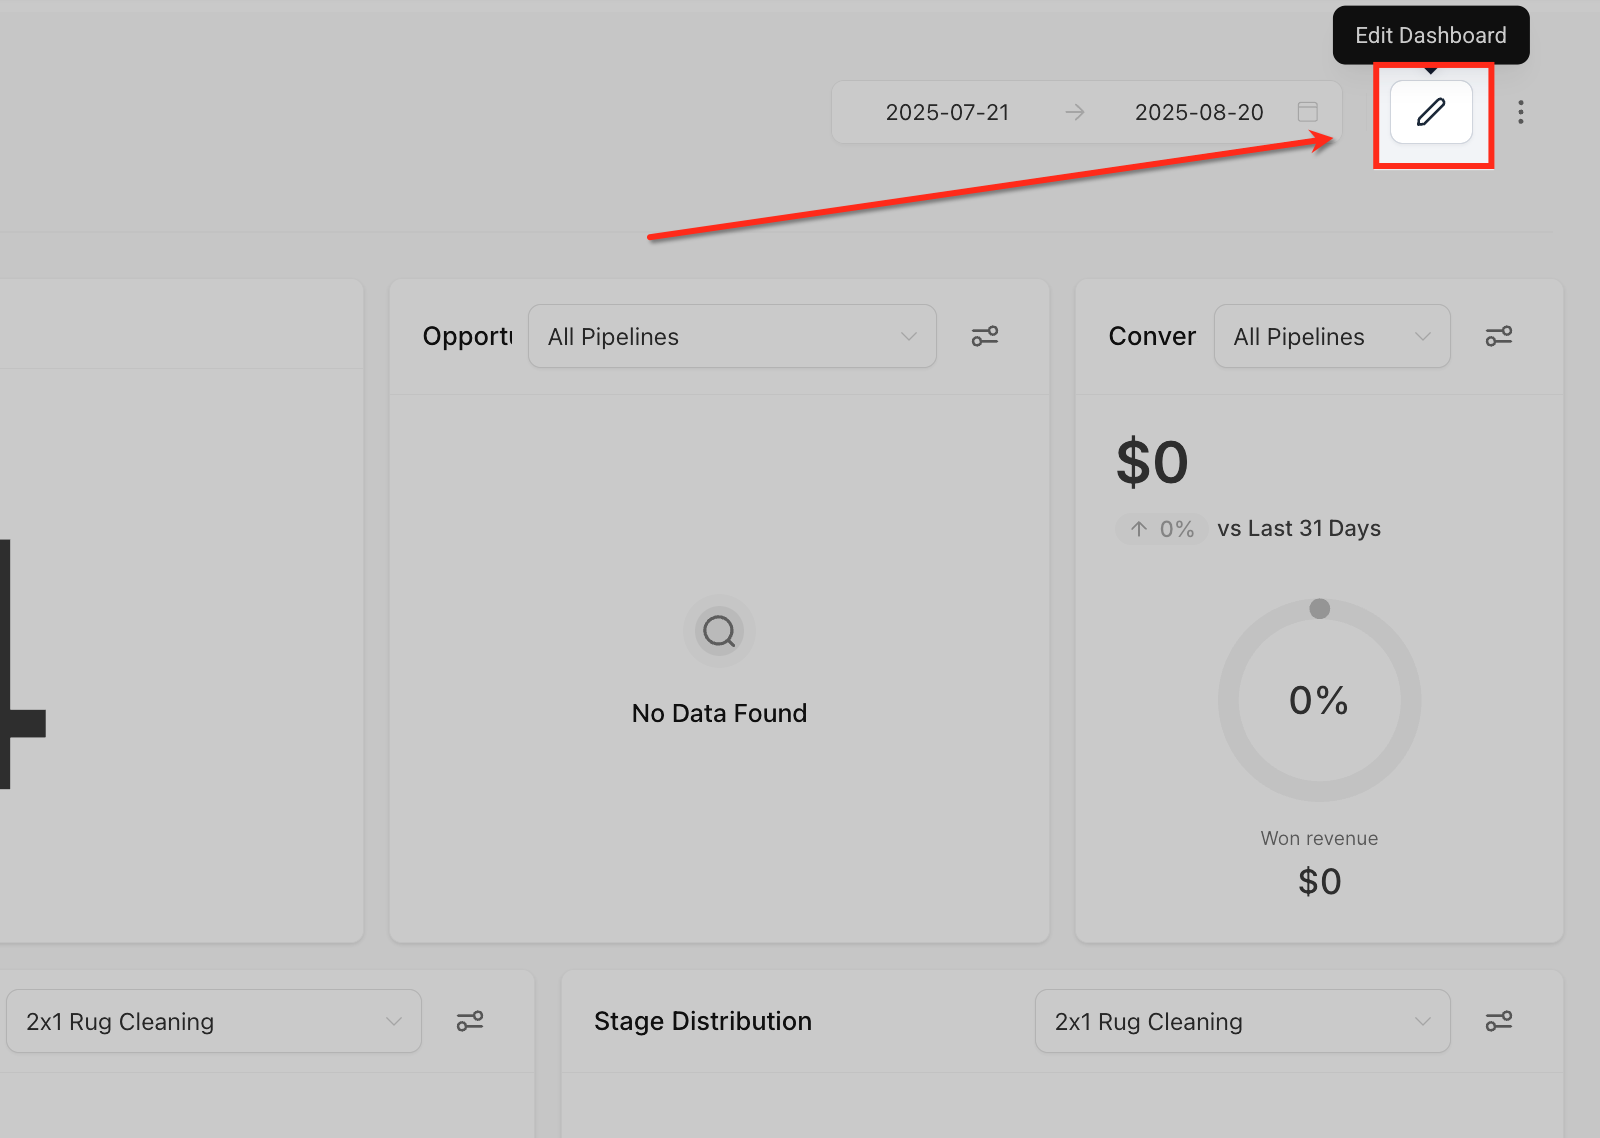
- Click the Edit Dashboard icon at the top right to enter edit mode.
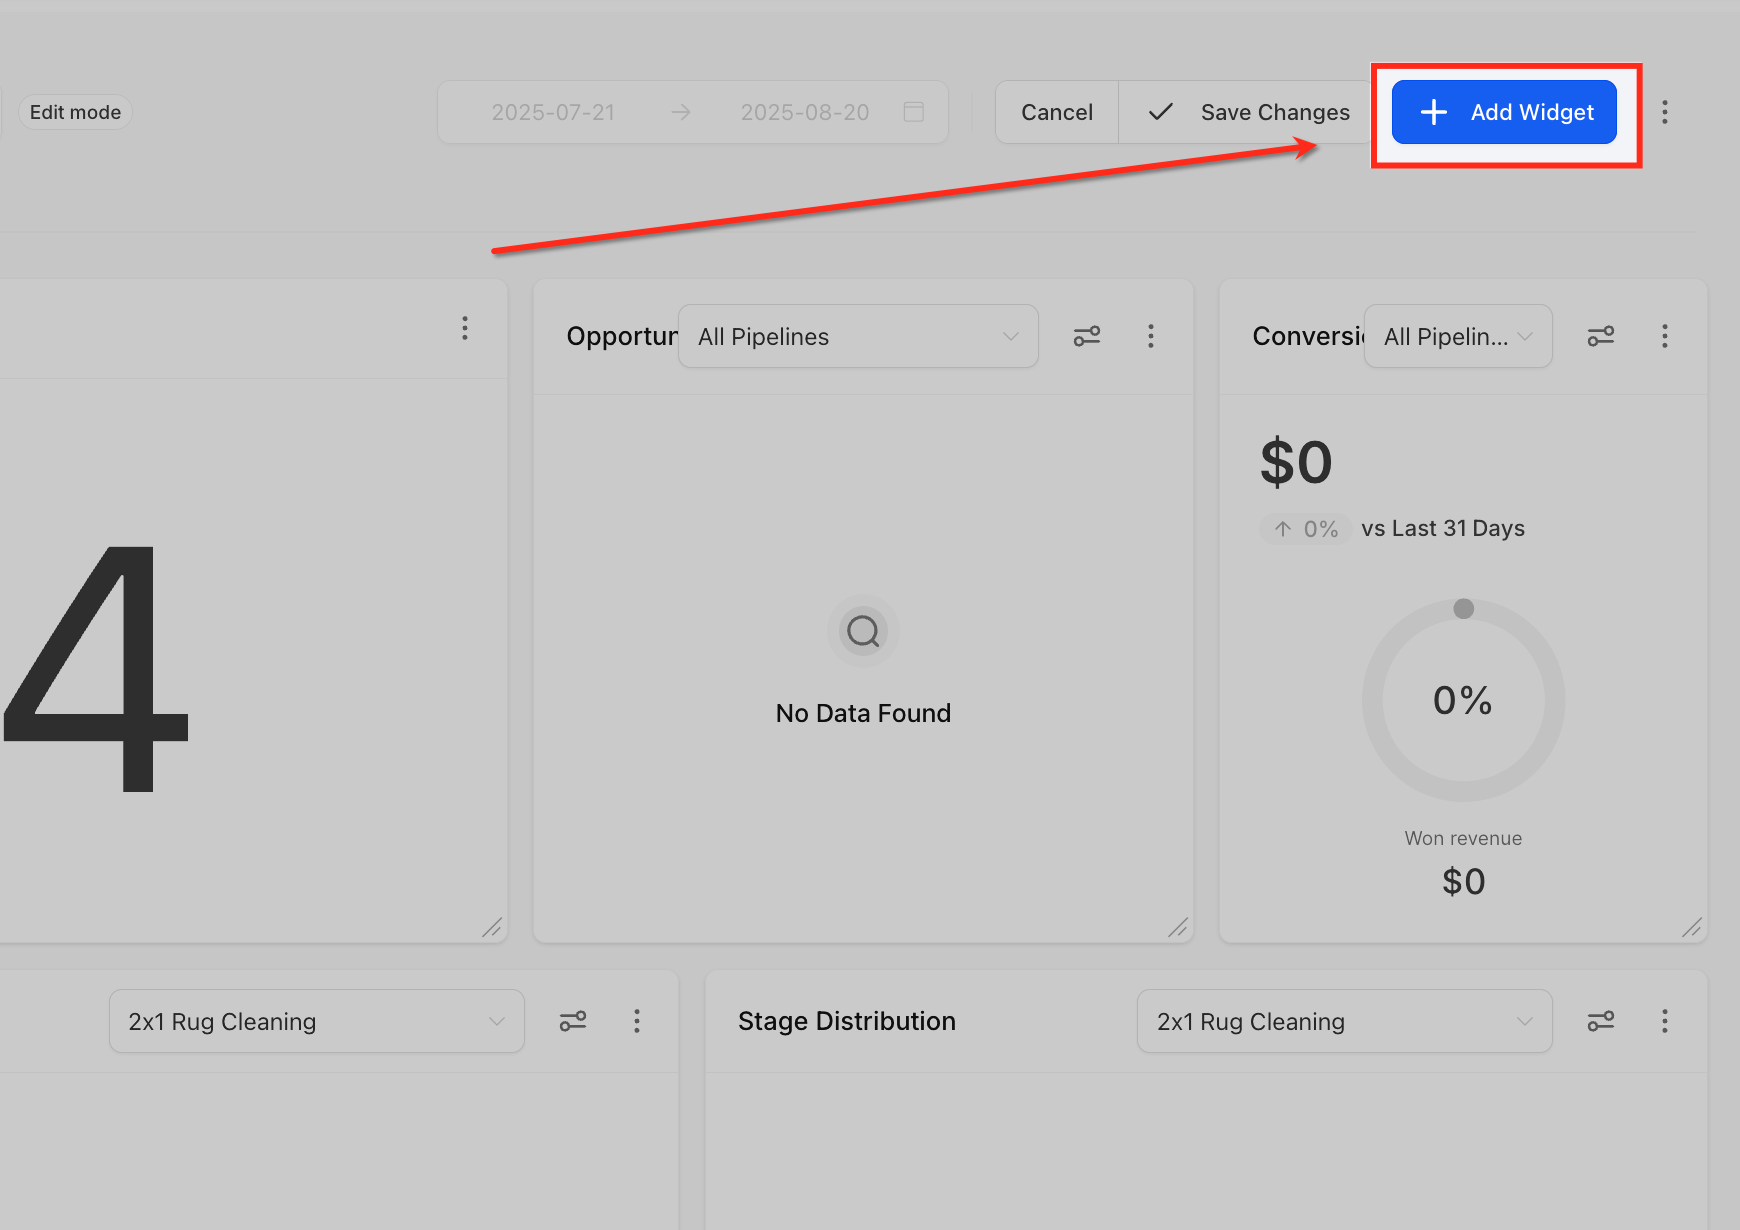
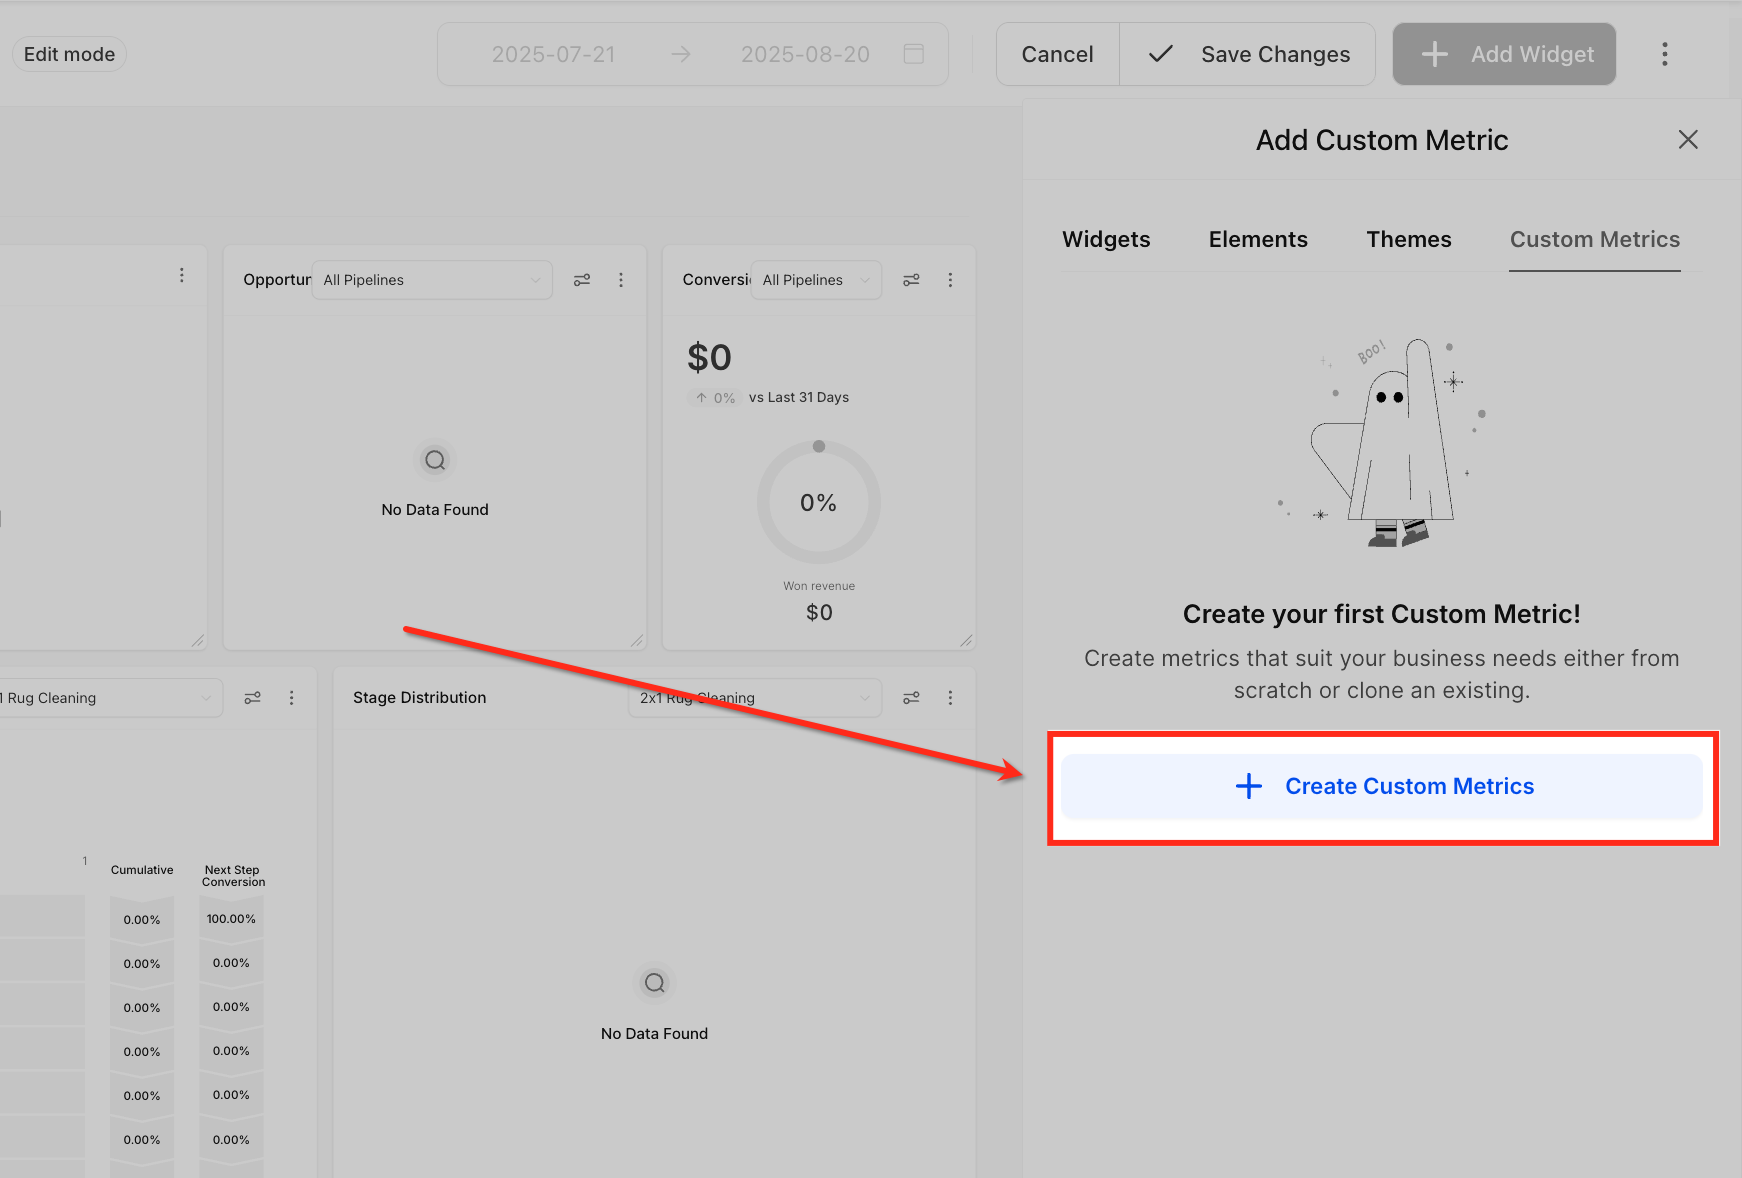
- Press the Add Widget button at the top right.
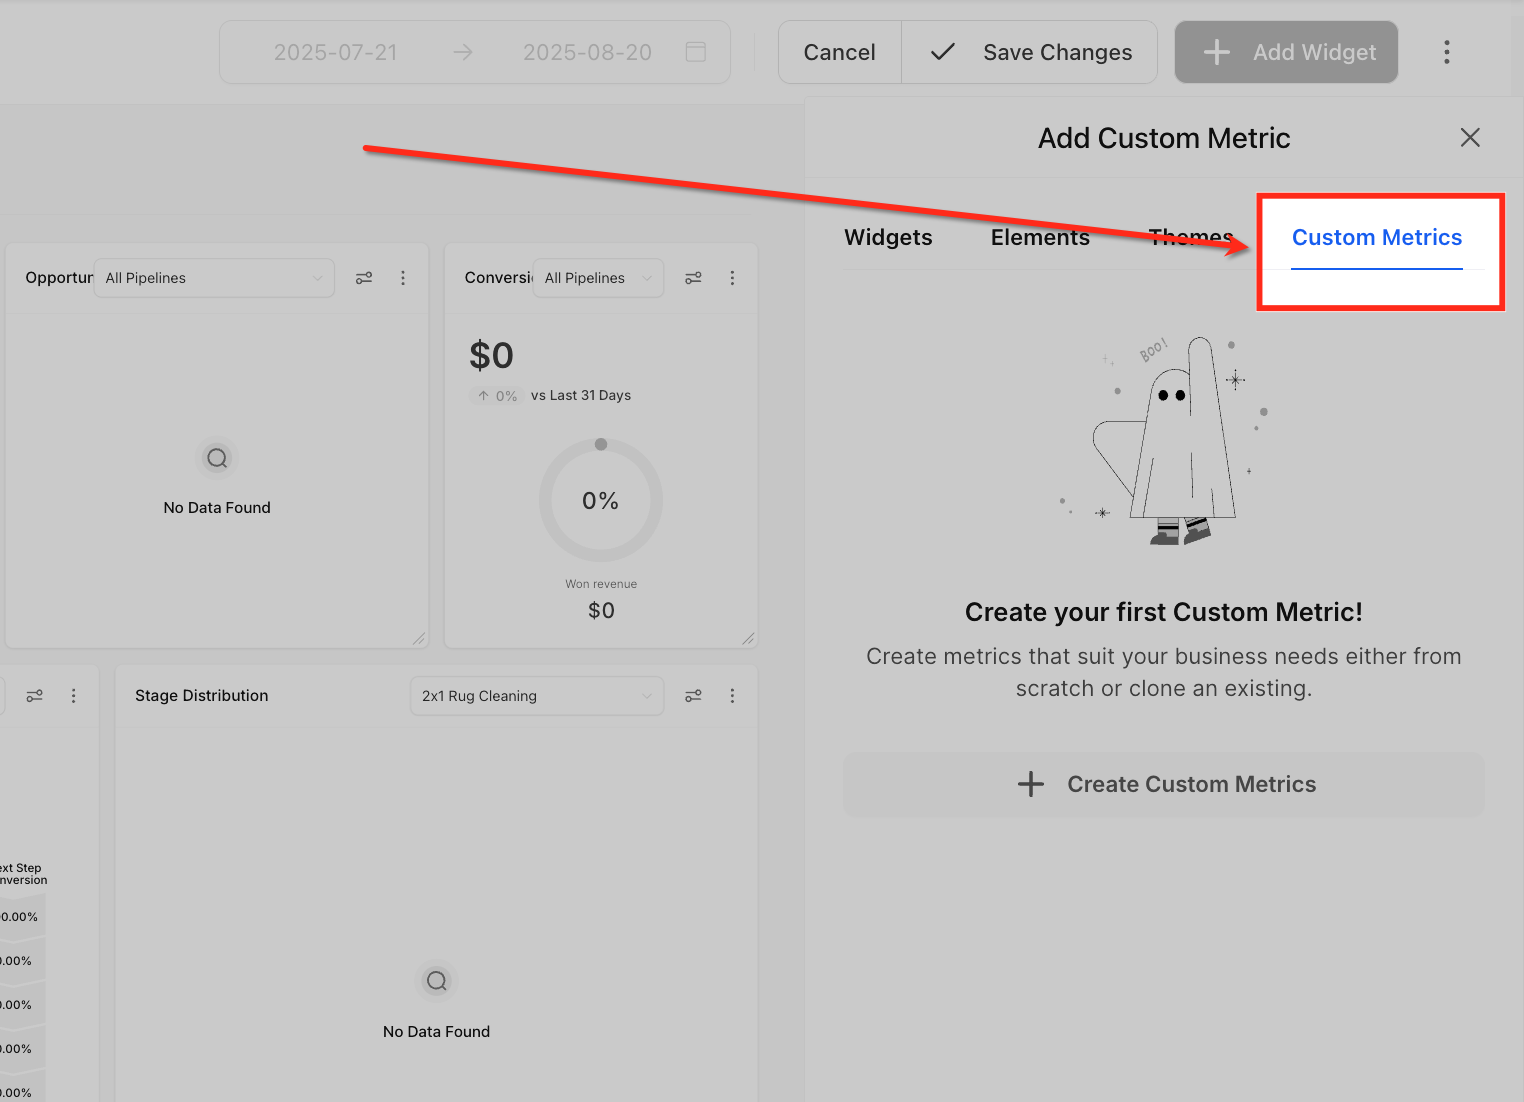
- Select the Custom Metrics tab in the widget options panel.
- Click the + Create Custom Metrics button to start a new metric.
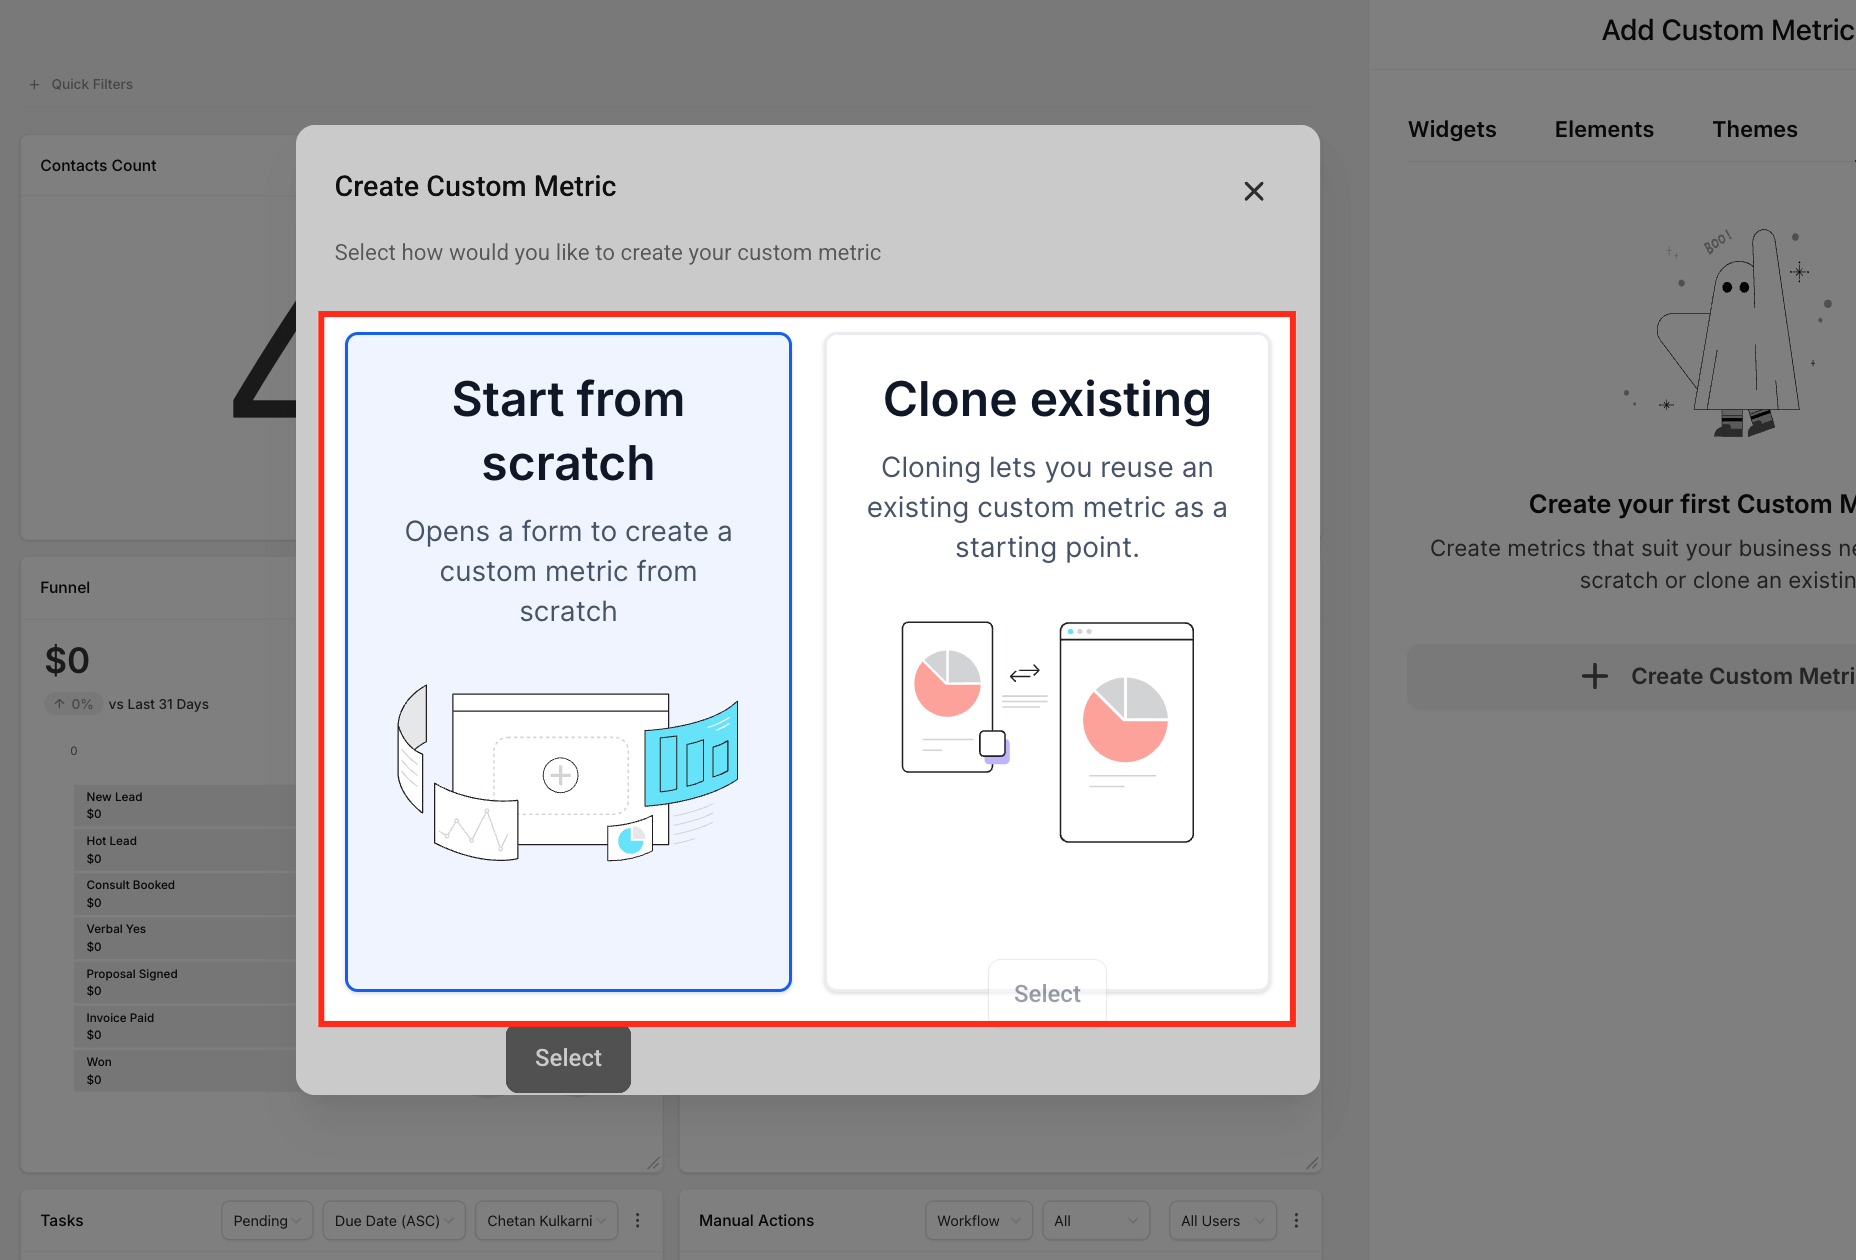
- Choose either Start from scratch or Clone existing as the starting point.
- Click the Select button to confirm your choice.
- Enter a clear Metric Name, pick a Data Type, and add a short Description.
- Define the calculation in the Formula field, combining up to four metrics with operators and constants.
- In Advanced Settings, assign the appropriate date property to each metric used in the formula.
- Set the Comparison Value to indicate whether an increase or decrease is positive, then click Create to save the metric.
07What it looks like in HighLevel
08Settings that matter
- Metric Name. The label that identifies the custom metric in dashboards and reports.
- Data Type. Controls how the metric value is displayed, Integer, Float, Percentage, or Currency.
- Description. Provides a brief explanation of the metric’s purpose for you and your team.
- Formula. Defines the calculation using up to four selected metrics, mathematical operators, and optional constant values.
- Advanced Settings (date property). Specifies which date field each metric in the formula should use for its calculations.
- Comparison Value. Determines whether an increase or a decrease in the metric is considered a positive trend.
09Things to know before you rely on it
- Custom Metrics are only available on plans priced at $497 and above (per HighLevel's help center, checked November 2026).
- A formula can include a maximum of four different metrics.
- Metric level filtering and additional data sources such as Meta Ads and Google Analytics are supported.
- Cloned metrics may break if the underlying data source fields are removed, renamed, or change type.
10If something goes wrong
- Cloned metric shows errors after a source field changes.. Edit the cloned metric’s formula and re map the affected fields to correct the calculation.
- Metric does not calculate after being pushed to a subaccount via a Snapshot.. Ensure the destination subaccount has the same data sources and fields; add or map missing sources as needed.
11How it connects to the rest of HighLevel
- Add and customize dashboard widgets Dashboard widgets
- Manage dashboard permissions Dashboard permissions
- View pricing details for eligible plans Pricing
Michael's take

Custom metrics can feel daunting because they let you manipulate raw numbers from multiple places. A slip in a date field or a wrong trend direction can send your whole dashboard reading the wrong story.
When the logic works, you get a crystal clear view of the exact KPI that drives your business, whether it’s ROI, cost per acquisition or any custom ratio you need. That level of precision is worth the extra care.