
01Who this is for
- Team members who need to track data that does not fit standard objects, because the widgets let them create KPIs from that unique data.
- Managers who want to combine custom object metrics with standard metrics on a single dashboard for a comprehensive view.
02Custom object widgets, explained
A Custom Object Widget is a chart that pulls information from a custom object you have defined in Subaccount Settings. The widget can show counts, sums or averages and appears alongside other dashboard elements.
You choose a chart type, Numeric, Table, Bar, Horizontal Bar, Line or Donut, then apply filters, themes and date ranges. The widget updates in real time as new custom object records are added.
Widgets live on any HighLevel dashboard or custom report. Permissions for the dashboard (VIEW, EDIT, FULL, NO ACCESS) also control who can see or edit the custom object widget.
03How businesses use custom object widgets
- Veterinary clinic. The clinic creates a Custom Object for "Pets" with fields like age and breed. A widget showing the average pet age is added to the dashboard. Staff filter by date range to monitor changes over time.
- Real estate agency. Agents define a Custom Object called "Properties" with price and status fields. A Bar chart widget displays total listings per status. The chart is placed on a shared dashboard for the sales team.
- Project management firm. The firm builds a Custom Object named "Projects" tracking budget and hours. A Donut widget visualises the sum of budgets by project type. Project leads view the widget to assess allocation.
04The numbers and rules that matter
- Up to ten Custom Objects per location (subaccount). Each object can be used in widgets.
- Metrics available for Custom Object Widgets: Count, Sum, Average.
- Supported chart types: Numeric, Table, Bar, Horizontal Bar, Line, Donut.
05Before you start
- Create the required Custom Object in Subaccount Settings before adding any widgets.
06How to set up and use custom object widgets in HighLevel
Insert a Custom Object Widget into a dashboard
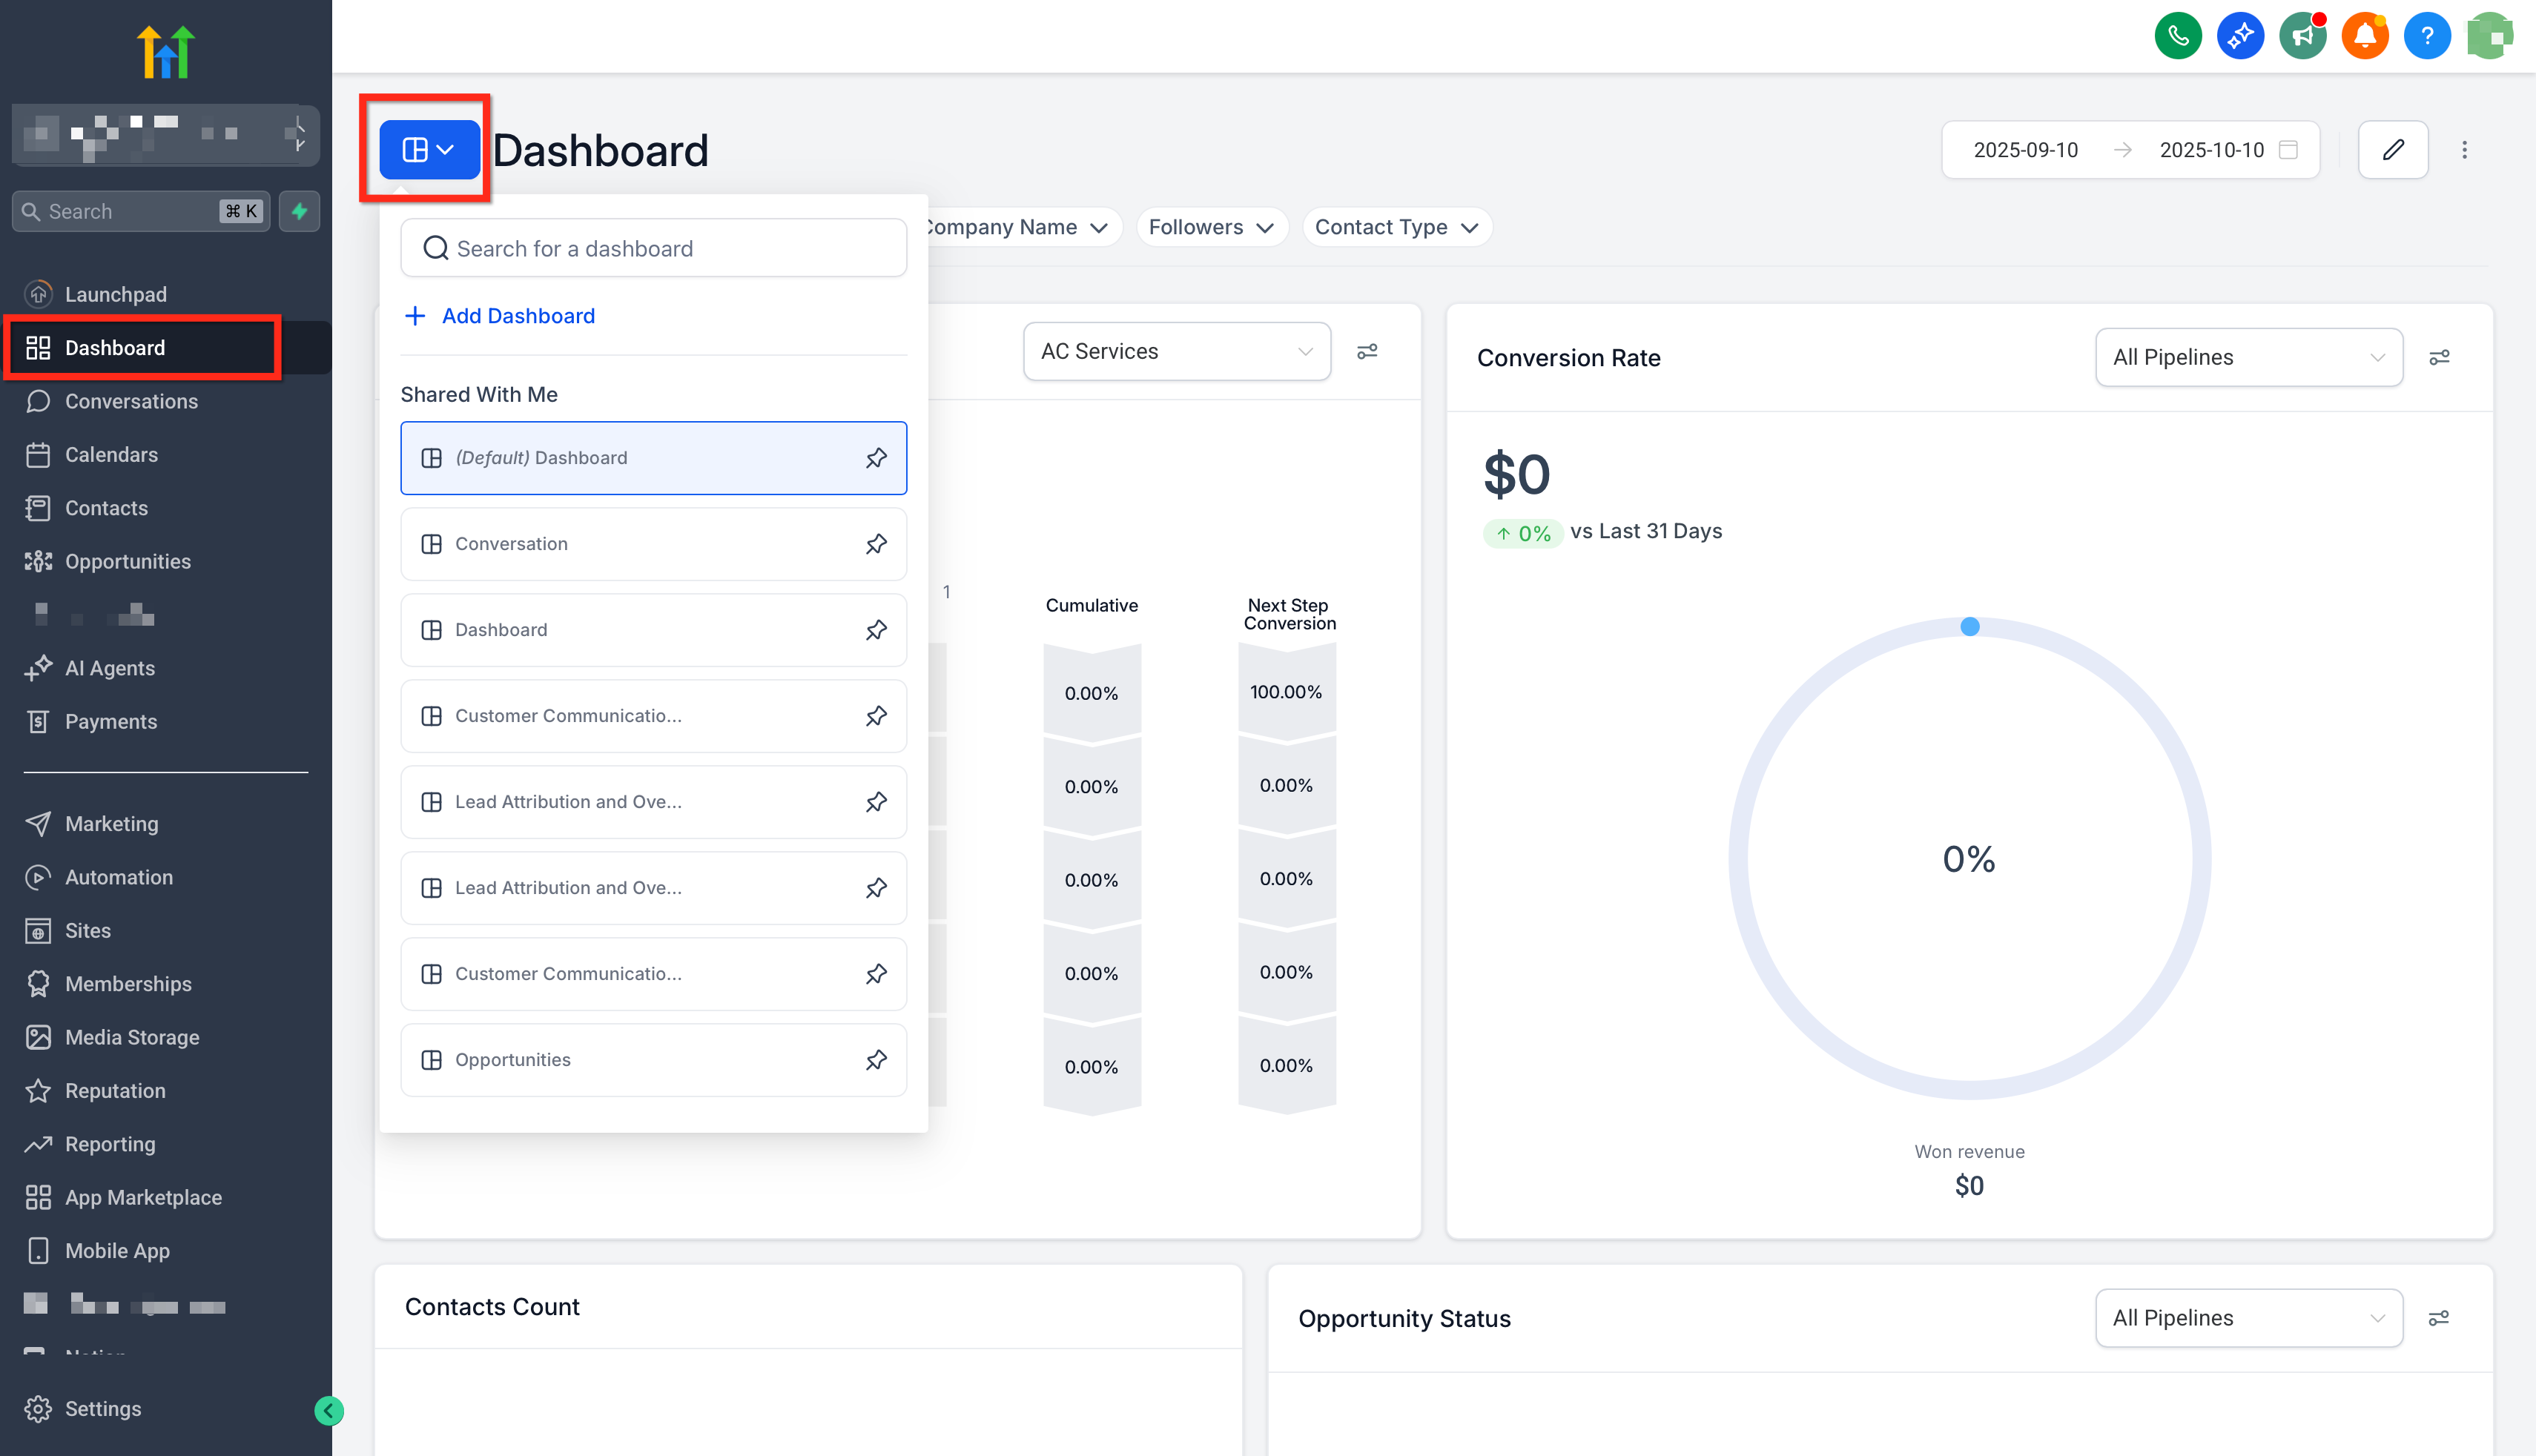
- Open the Subaccount, go to the Dashboard area, and click the blue button at the top left to select the target dashboard.
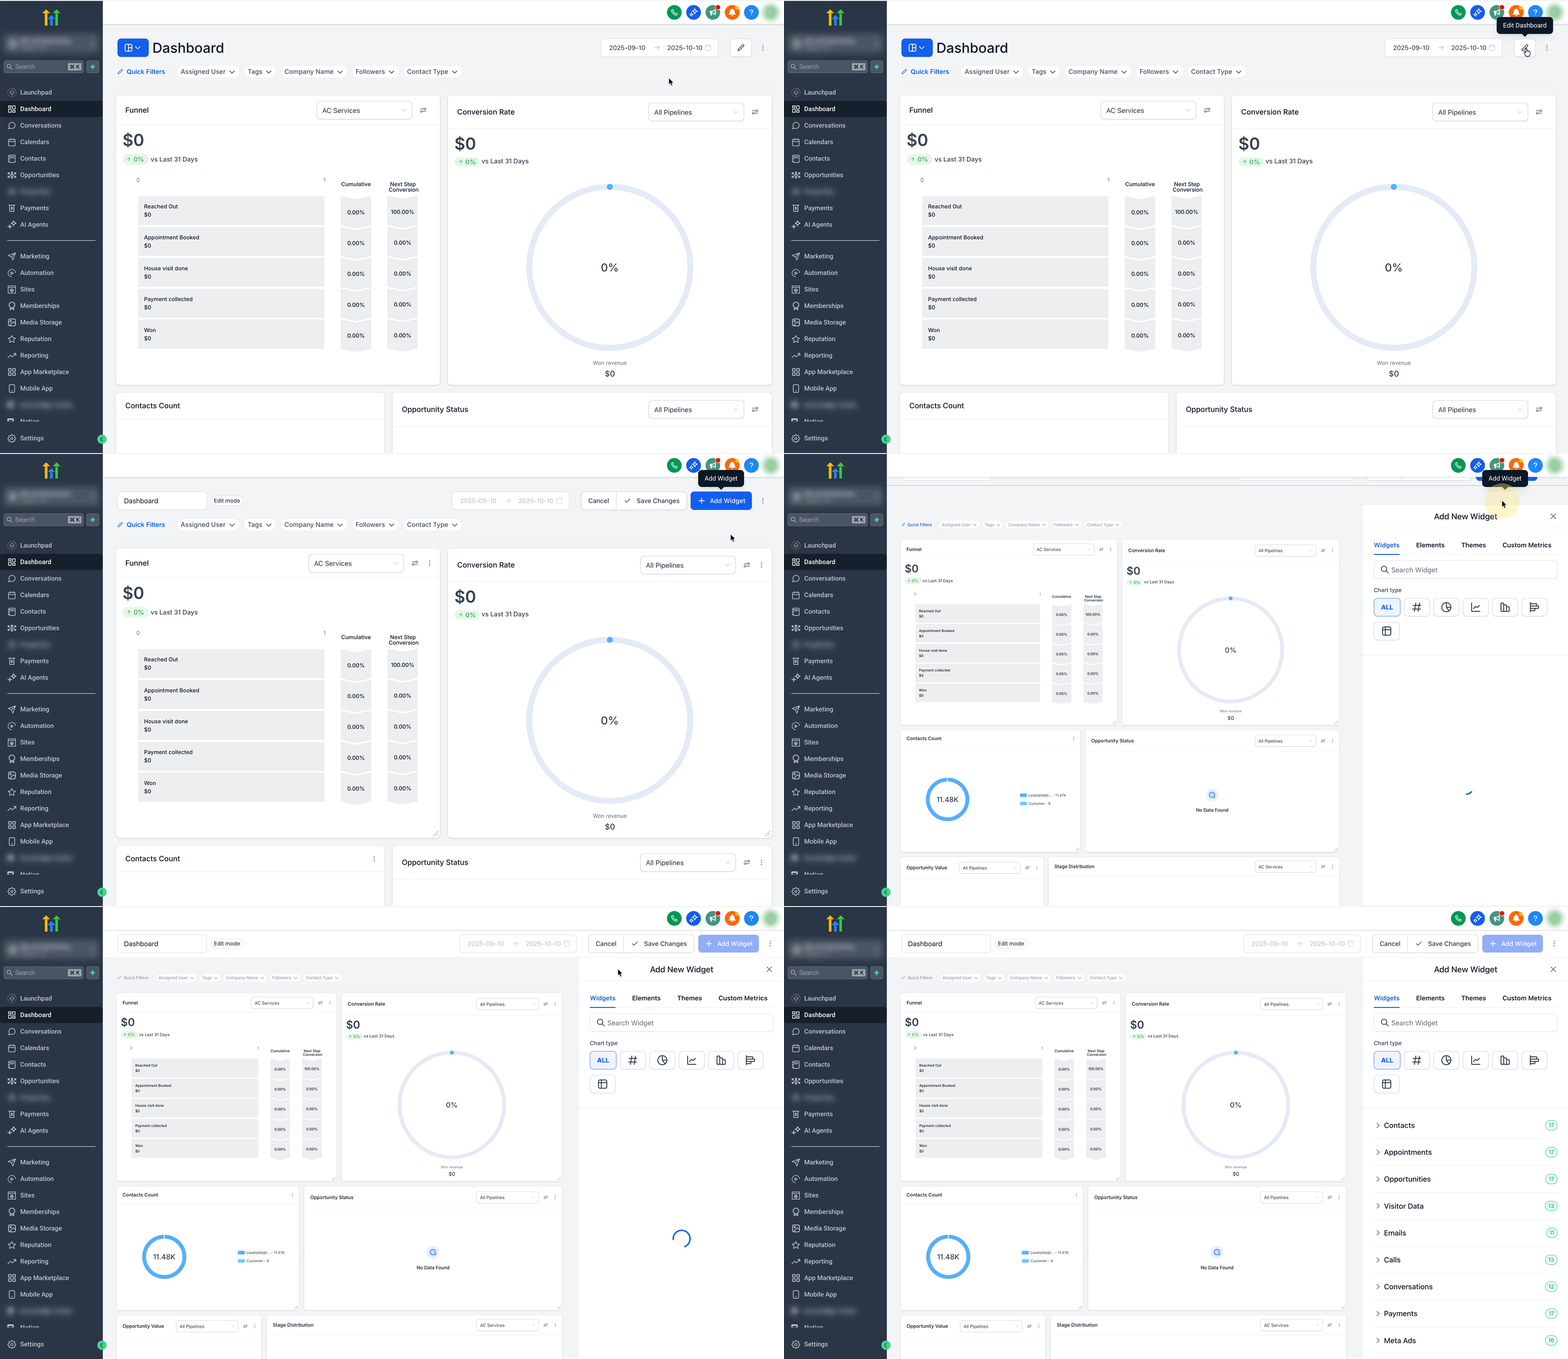
- Press the Edit icon (pencil) and then choose Add Widget.
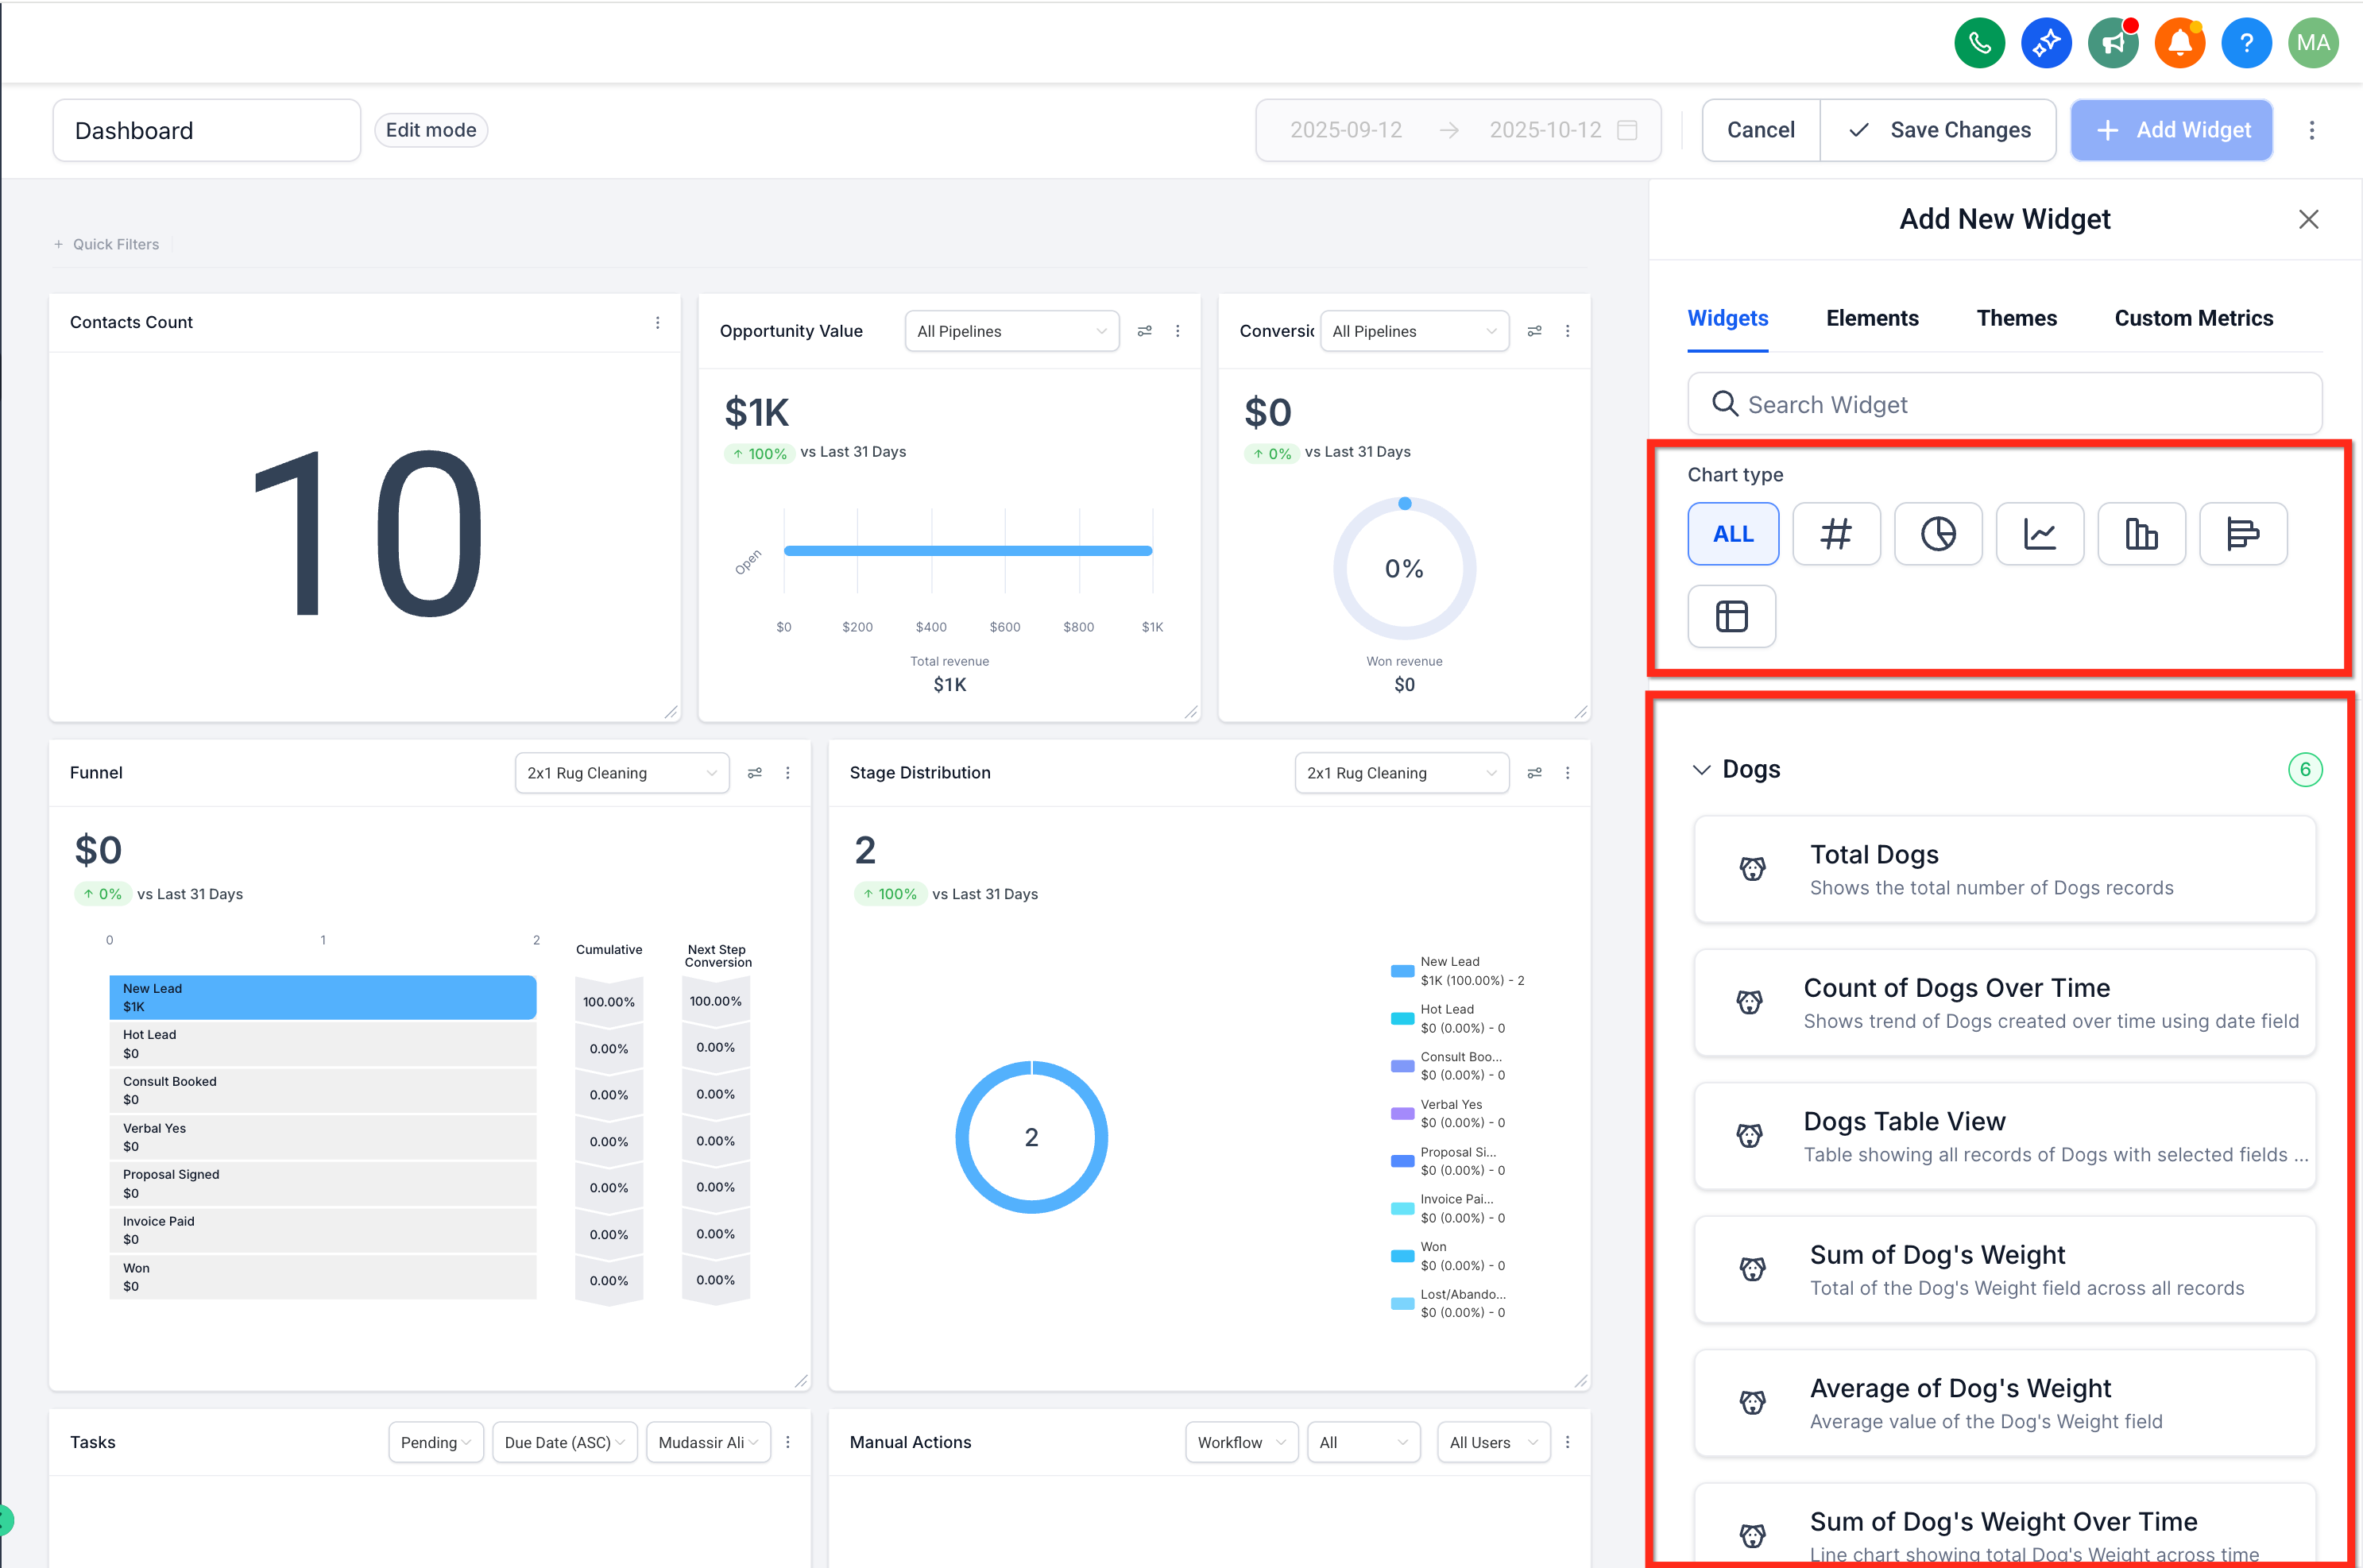
- Select the desired chart type, scroll to the Custom Objects section, and pick the metric or widget you need.
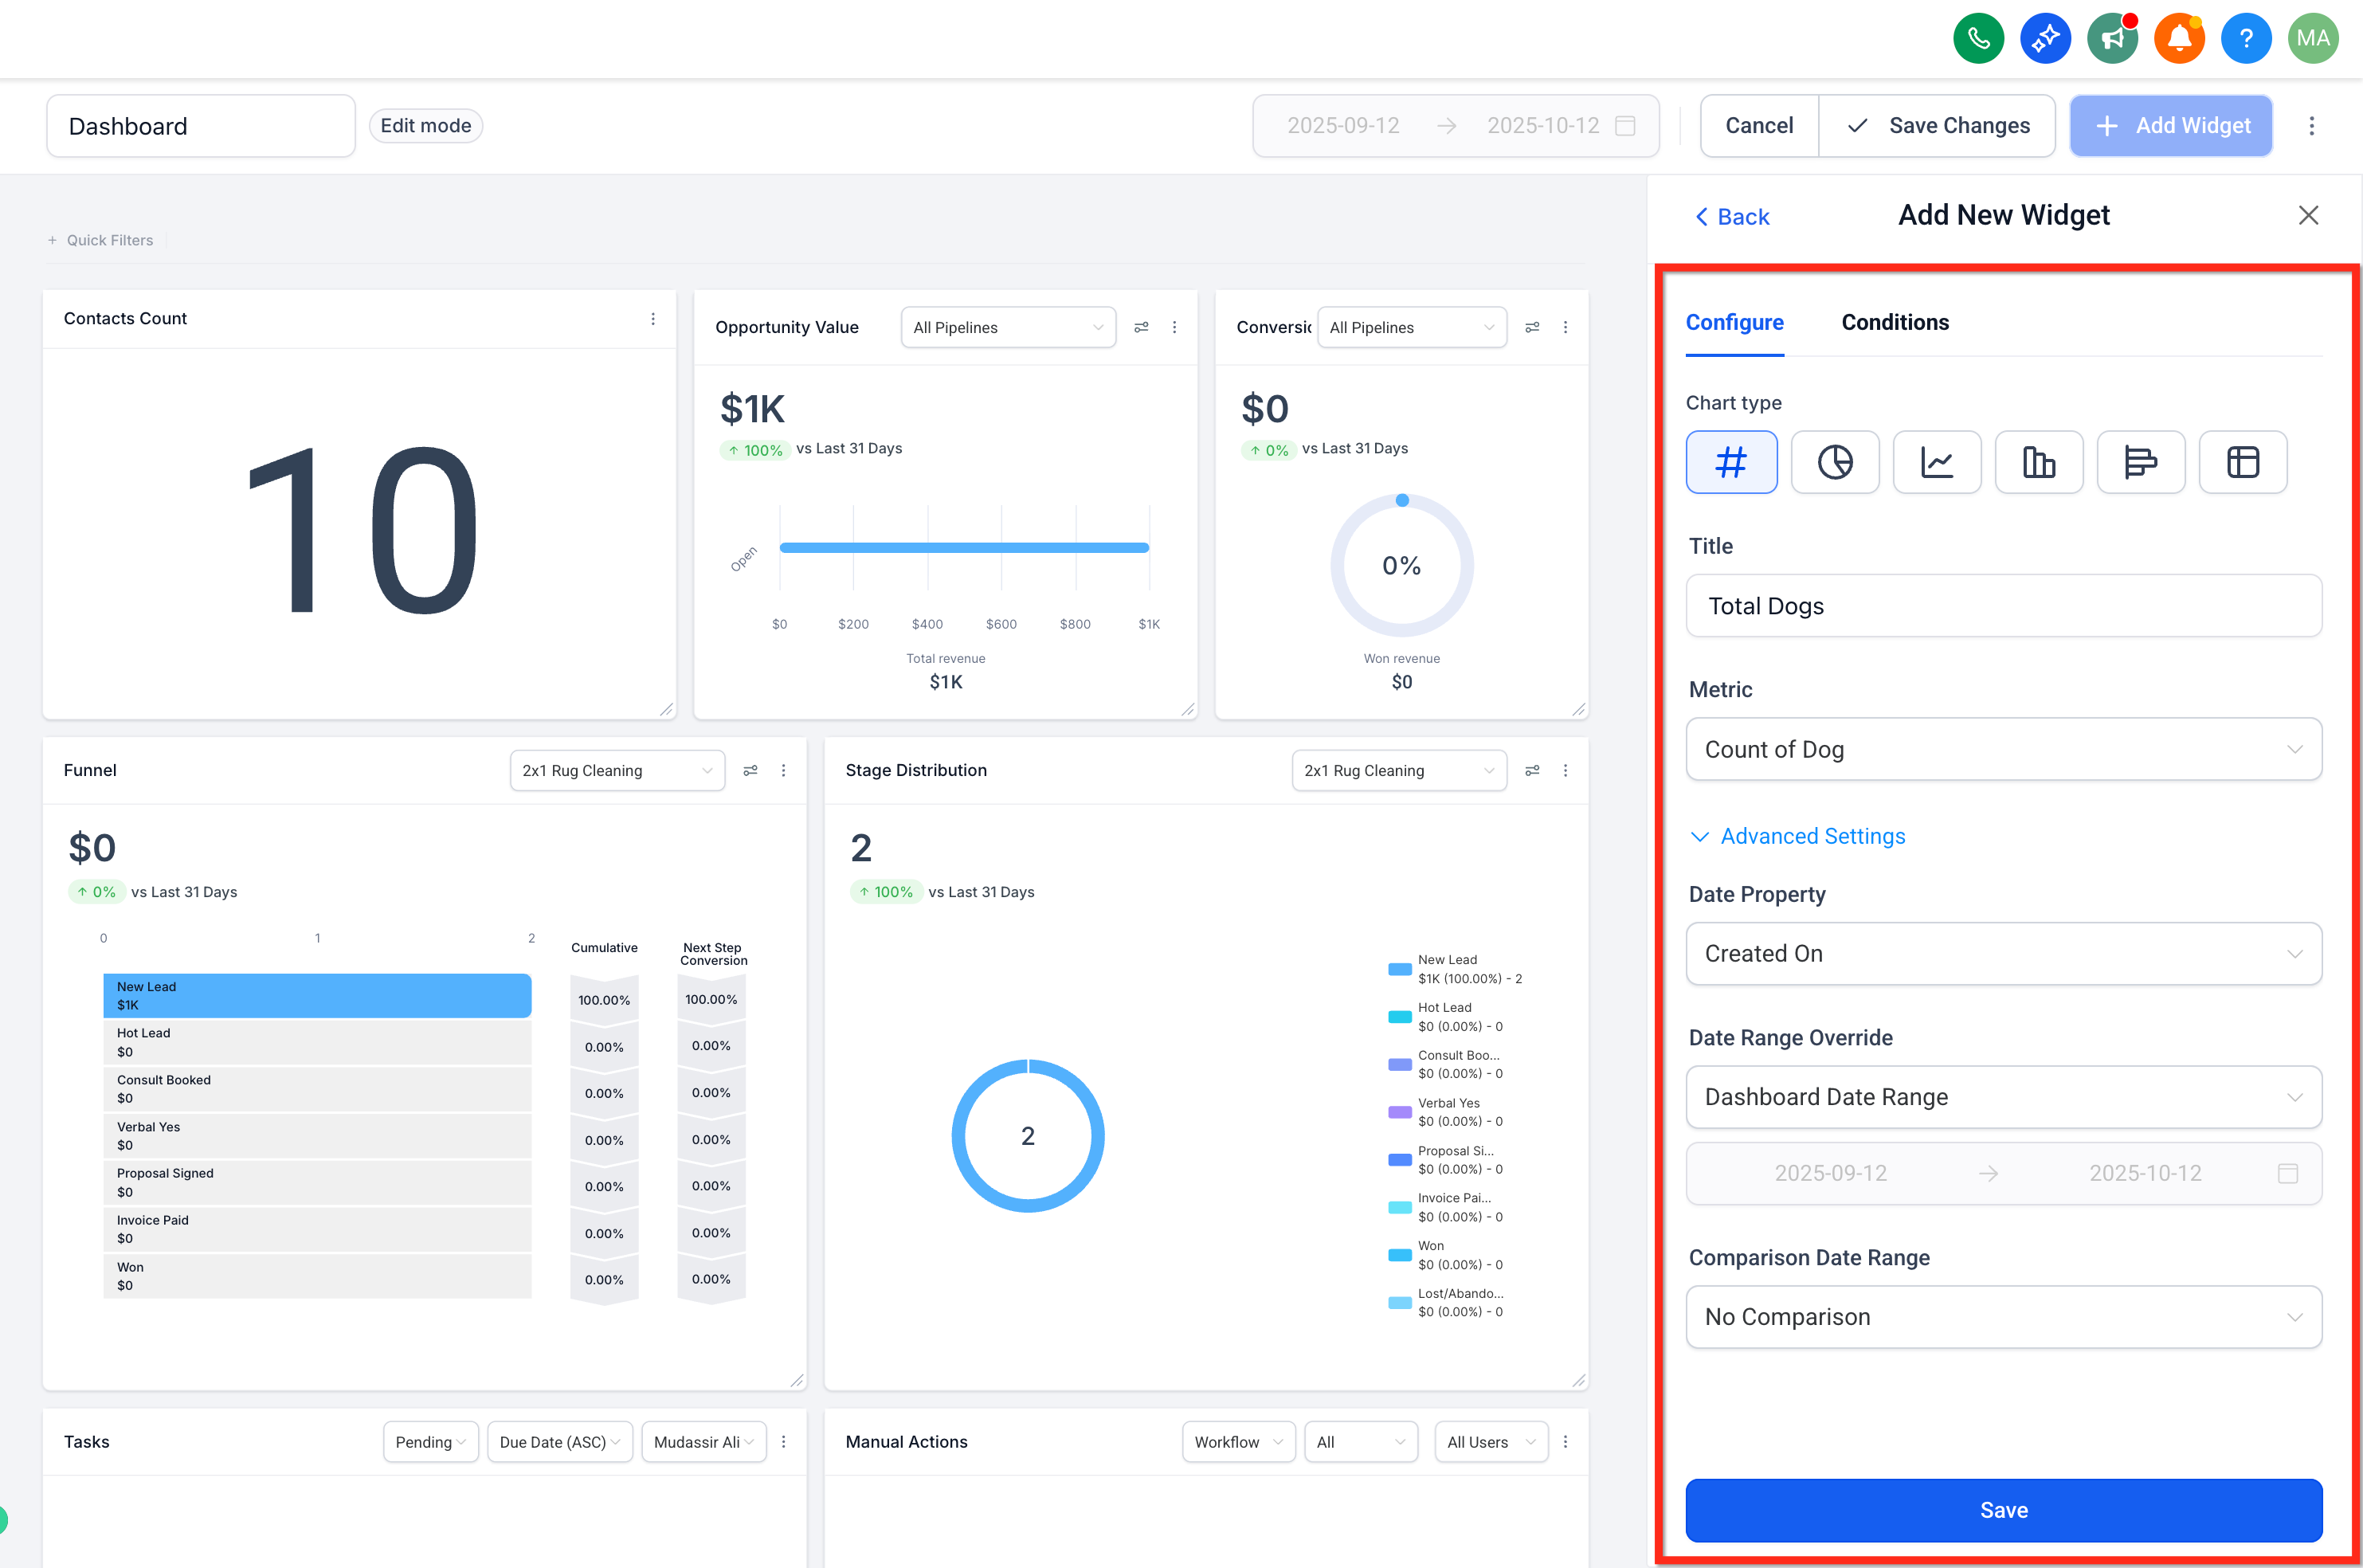
- Set any filters such as campaign, specific metric or date range, and adjust the theme or colors if desired.
- Click Save to store the widget.
- The widget begins streaming data on the dashboard.
Insert a Custom Object Widget into a custom report
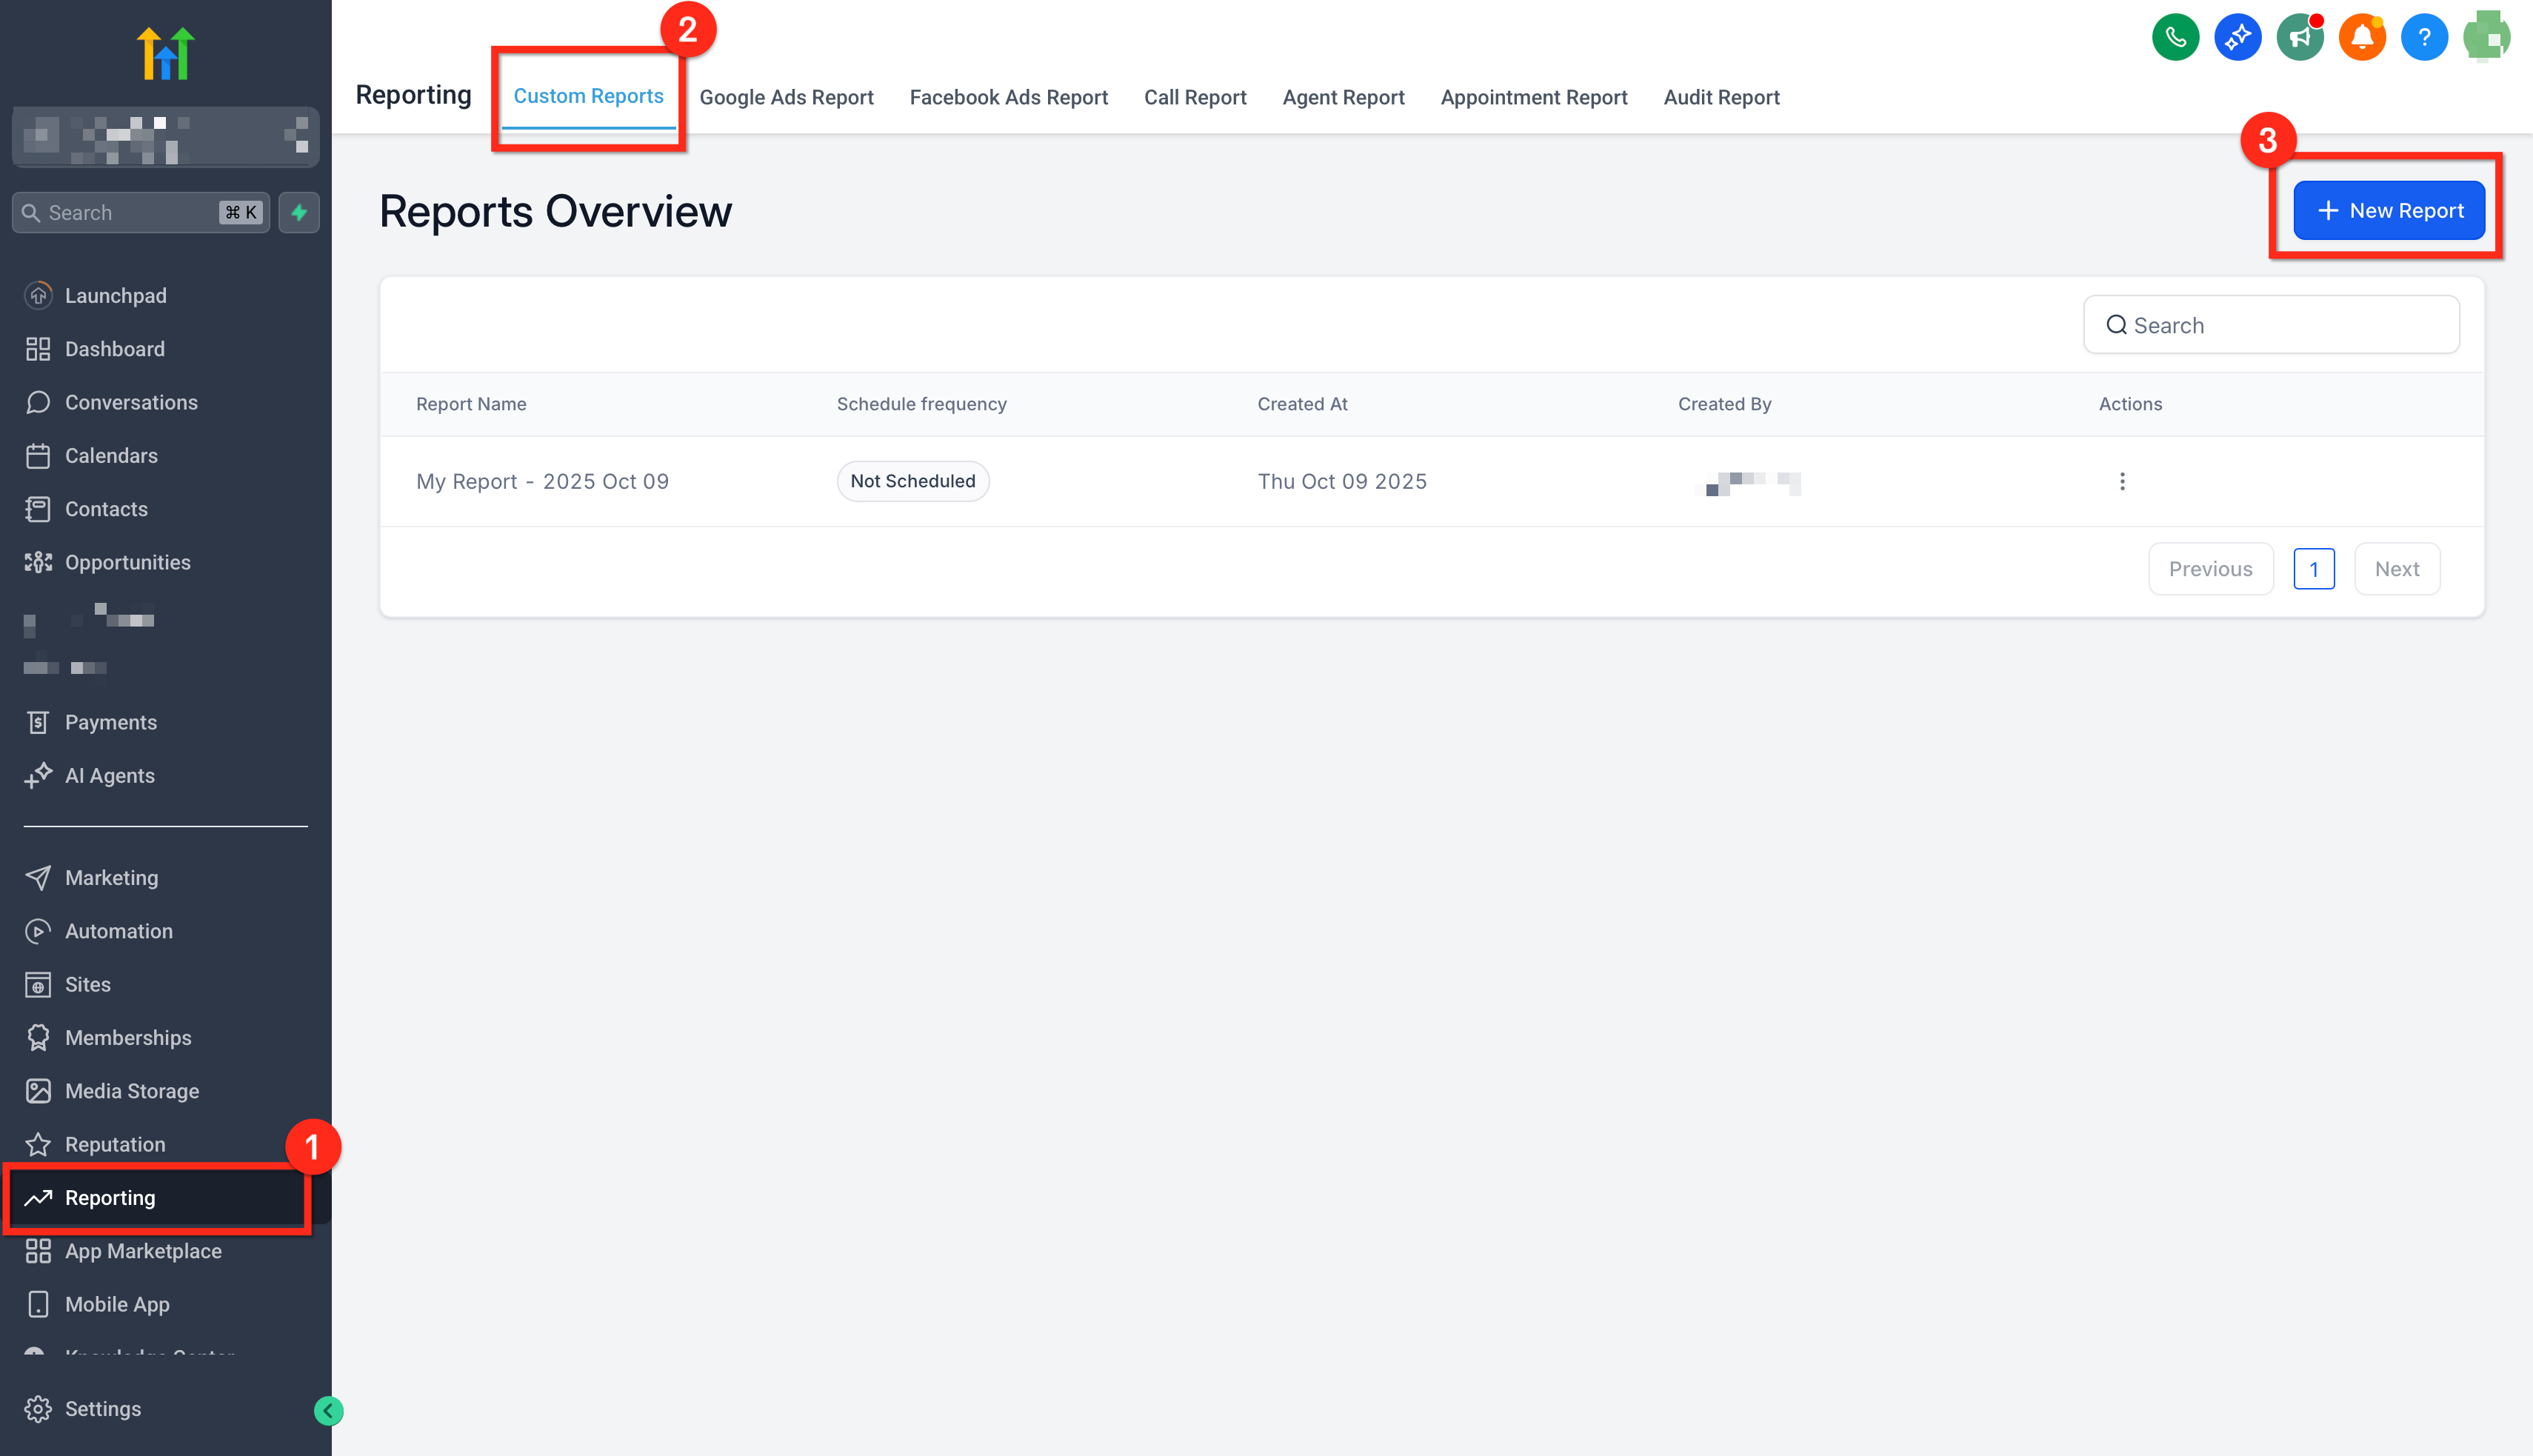
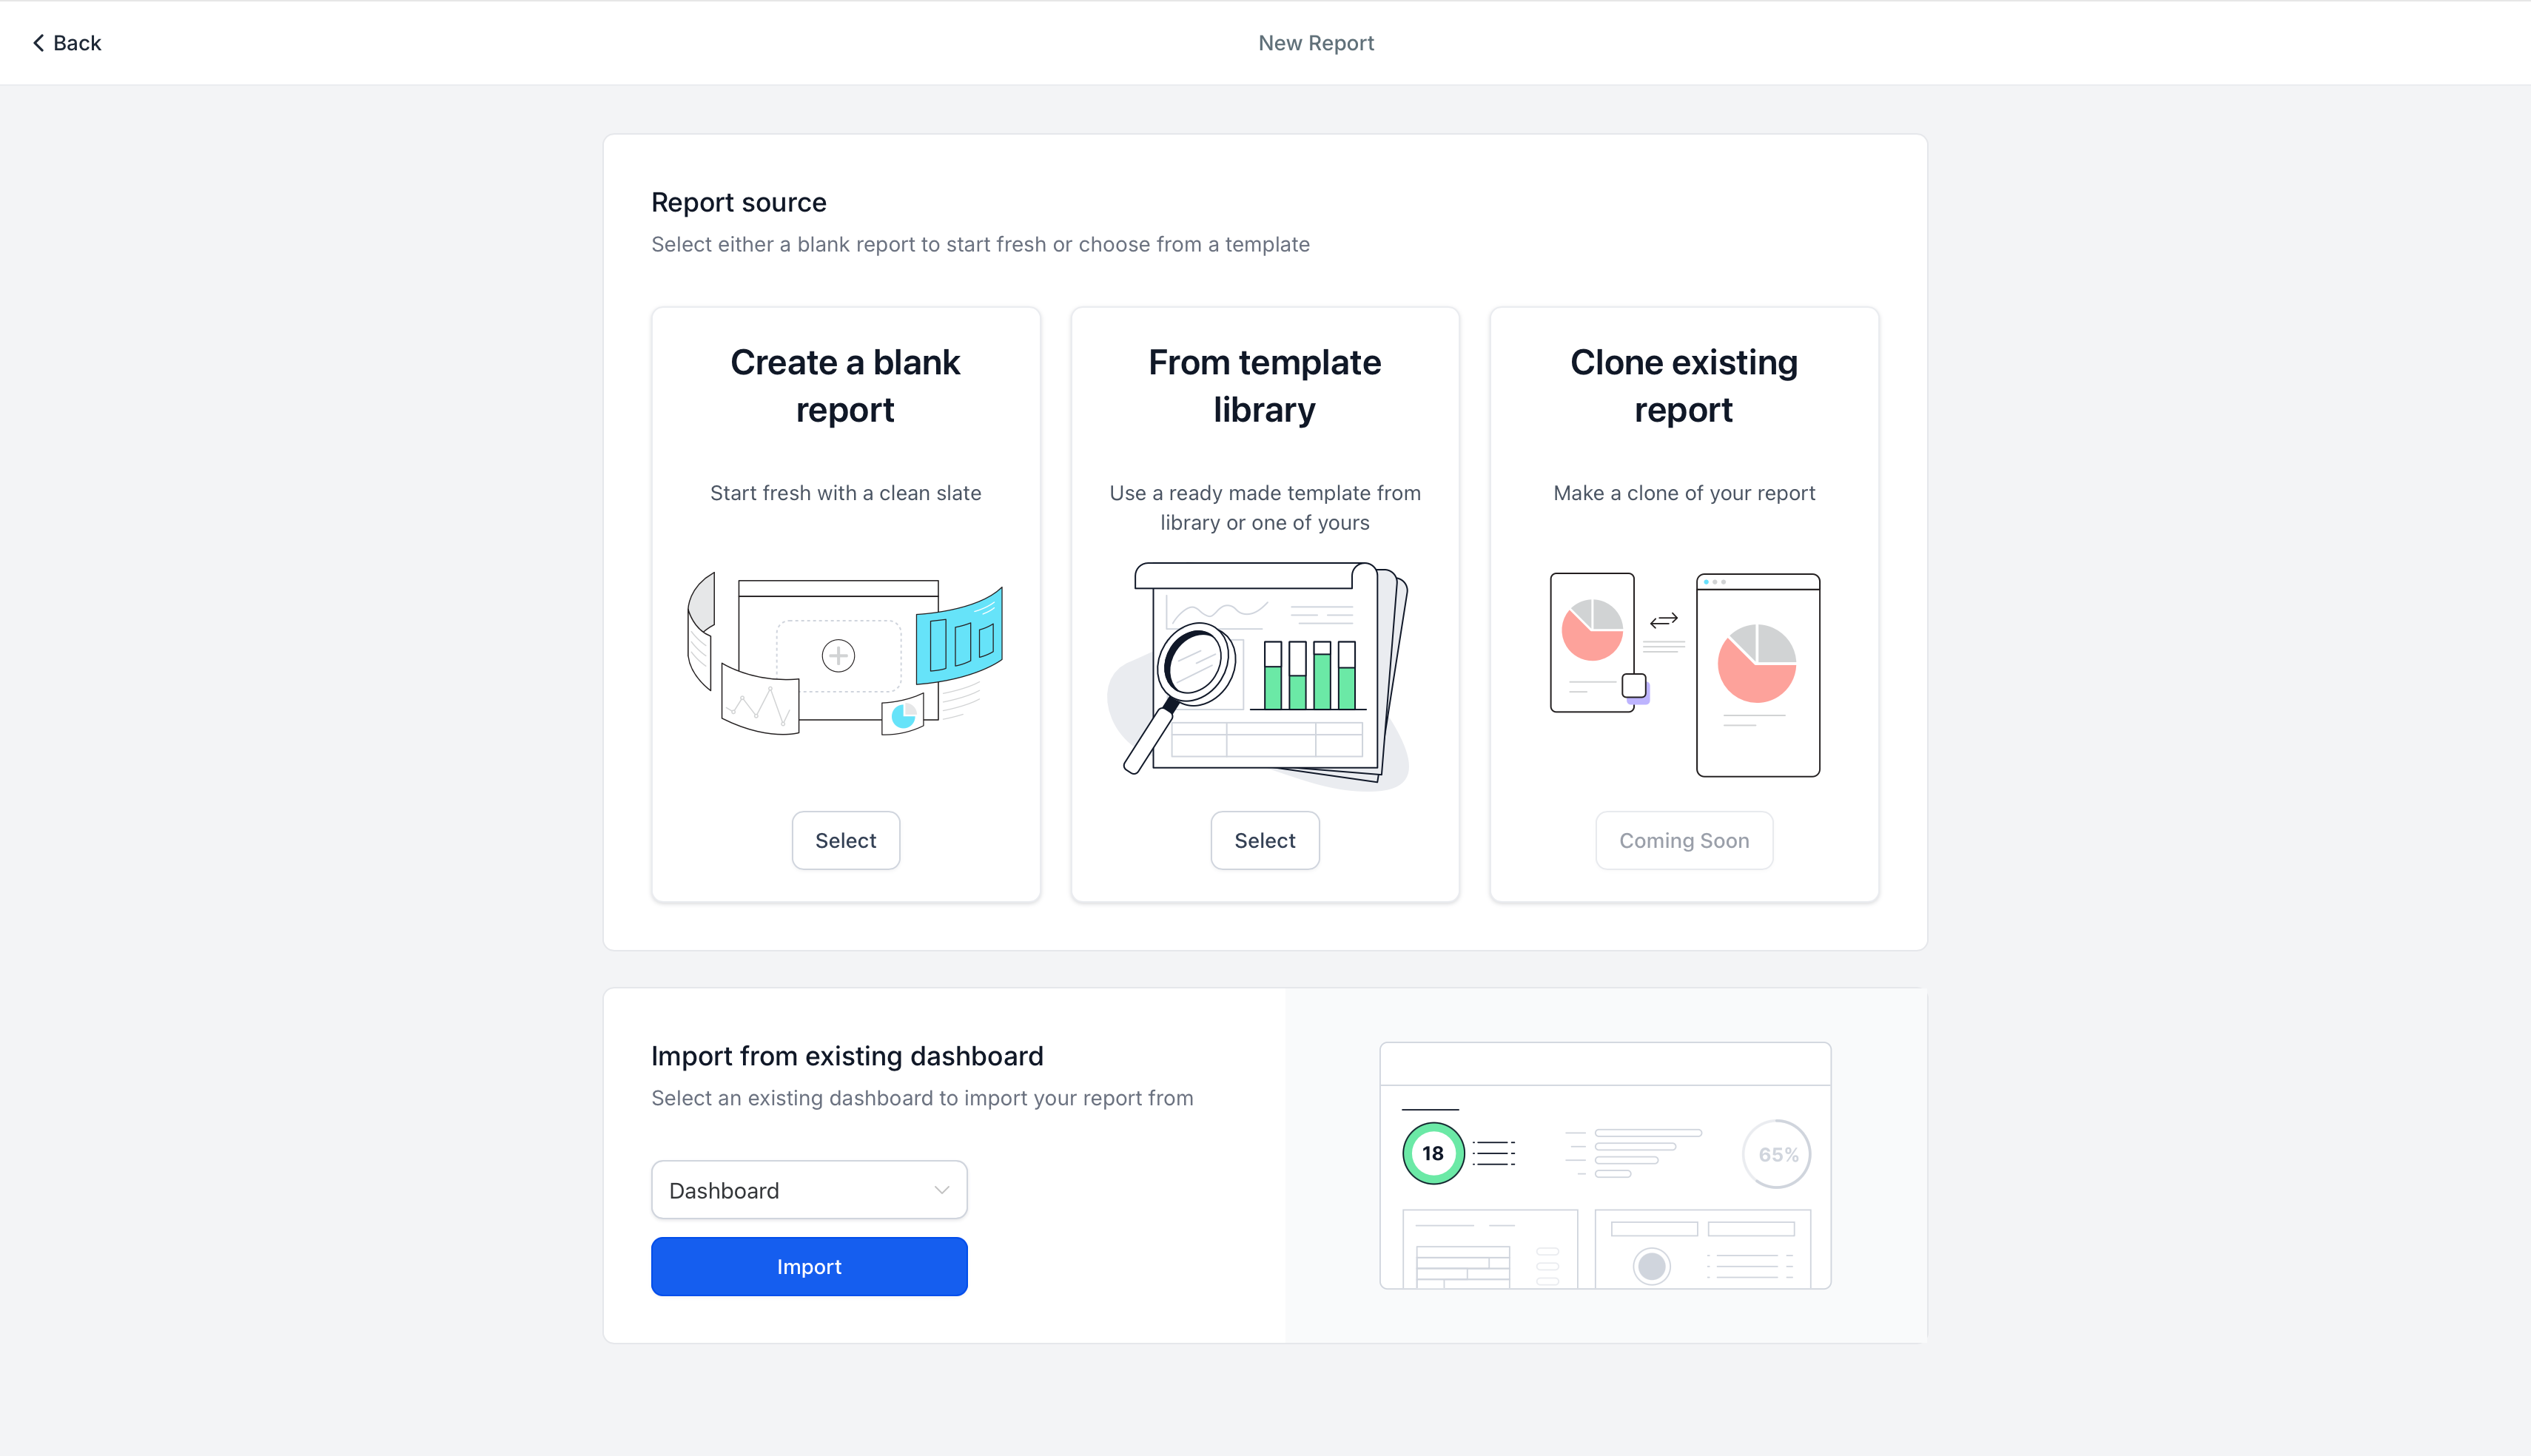
- In the Subaccount, navigate to Reports > Custom Reports and open an existing report or click Create Report.
- Choose a blank canvas, a template, or import a dashboard layout to start.
- Select Add Widget/Element at the top left, locate the Custom Objects widgets, and drag the required ones onto the canvas.
- Configure each widget’s chart type, filters and theme, then click Save.
- Use Send or Schedule to define an email schedule for automatic report delivery.
07What it looks like in HighLevel
08Settings that matter
- Dashboard VIEW/EDIT/FULL/NO ACCESS roles. These roles determine whether a user can only view, edit, fully manage, or have no access to a dashboard and its Custom Object Widgets.
09Things to know before you rely on it
- You can create up to ten Custom Objects per location (subaccount).
- Custom Objects, Dashboards and Custom Reports are available on all HighLevel plans.
- A recommended chart type is pre selected when adding a widget, but you can change it at any time.
10If something goes wrong
- Widget shows “No data”. Verify that the Custom Object contains records, ensure an eligible metric or field is selected, confirm the date range includes data, and check that filters or Quick Filters are not excluding all records.
11How it connects to the rest of HighLevel
- Add and customize dashboard widgets in HighLevel Dashboard widgets guide
- Create and add dashboard widgets in HighLevel Add widgets tutorial
- Manage dashboard permissions in HighLevel Permission settings
- HighLevel pricing and plans Pricing page
Michael's take

Custom object widgets feel like a small convenience that can become a real shift for teams that constantly juggle data outside the standard CRM. Turning niche records into live charts lets you see the numbers that truly matter.
A property management firm, for example, can plot total rent collected per building and average lease length side by side with opportunity pipelines. If I were setting it up, I’d verify the custom object fields are ready for metrics and then drop the first widget onto a dashboard to confirm the data streams as expected.