
01Who this is for
- Founders building automated sales funnels, they can verify that triggers enroll the right leads without opening each filter.
- Marketing managers overseeing large workflow canvases, they gain a quick overview of which triggers drive the most activity.
- Support teams troubleshooting enrollment issues, they can spot mismatched data or missing fields directly in the stats panel.
02Workflow trigger narration and statistics, explained
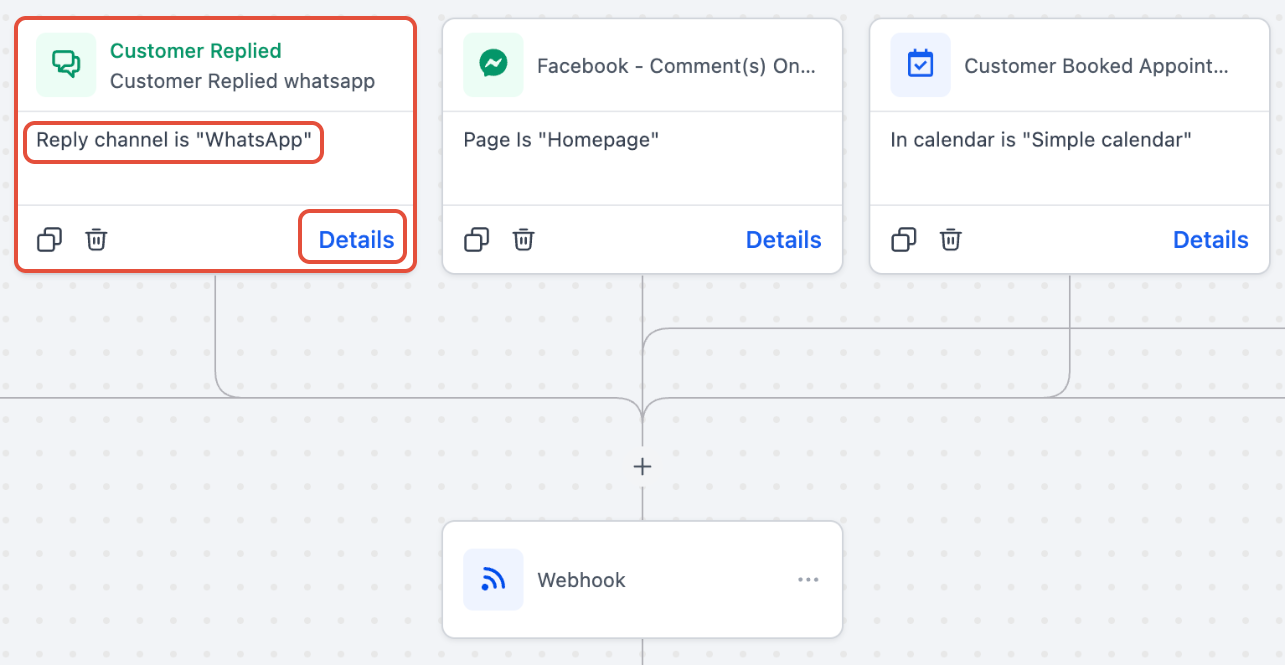
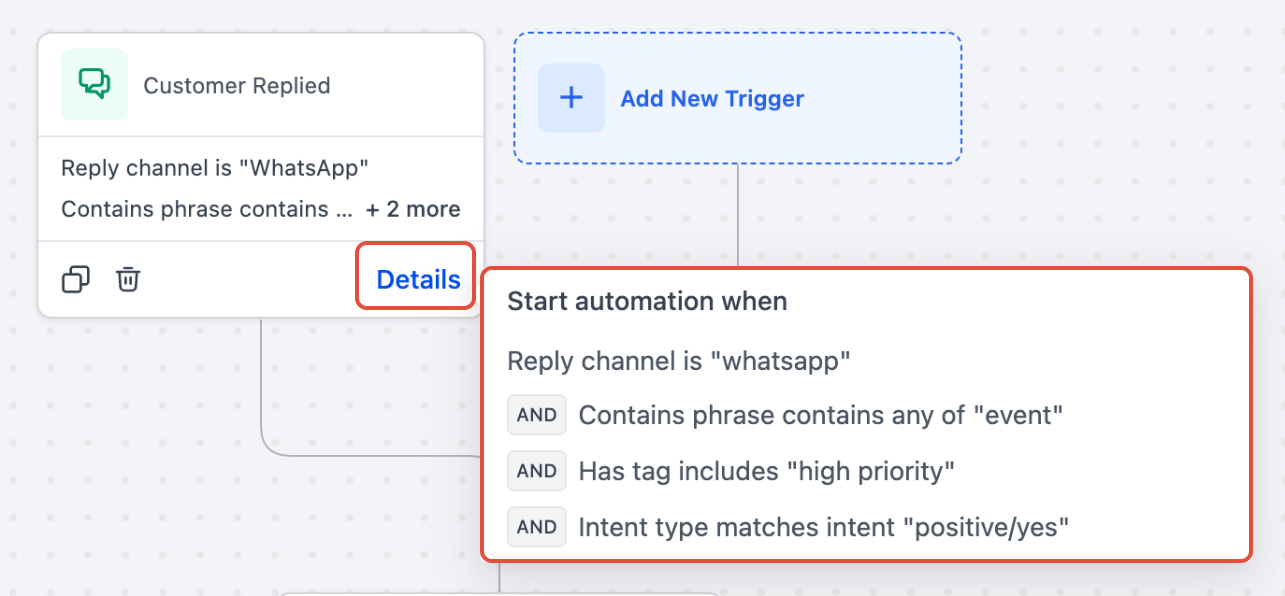
Trigger Narration appears on every trigger card inside the Workflow Builder. It prints a short, human readable sentence that describes the filters attached to that trigger. If the trigger has many filters, a compact view shows a "+X more" link that expands to show the full list when you click Details.
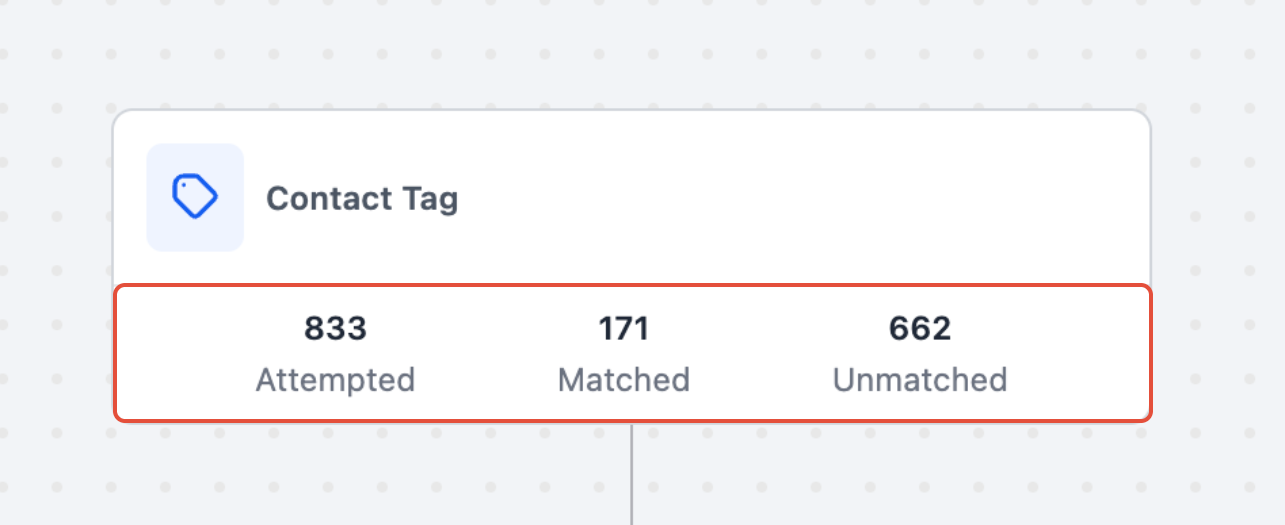
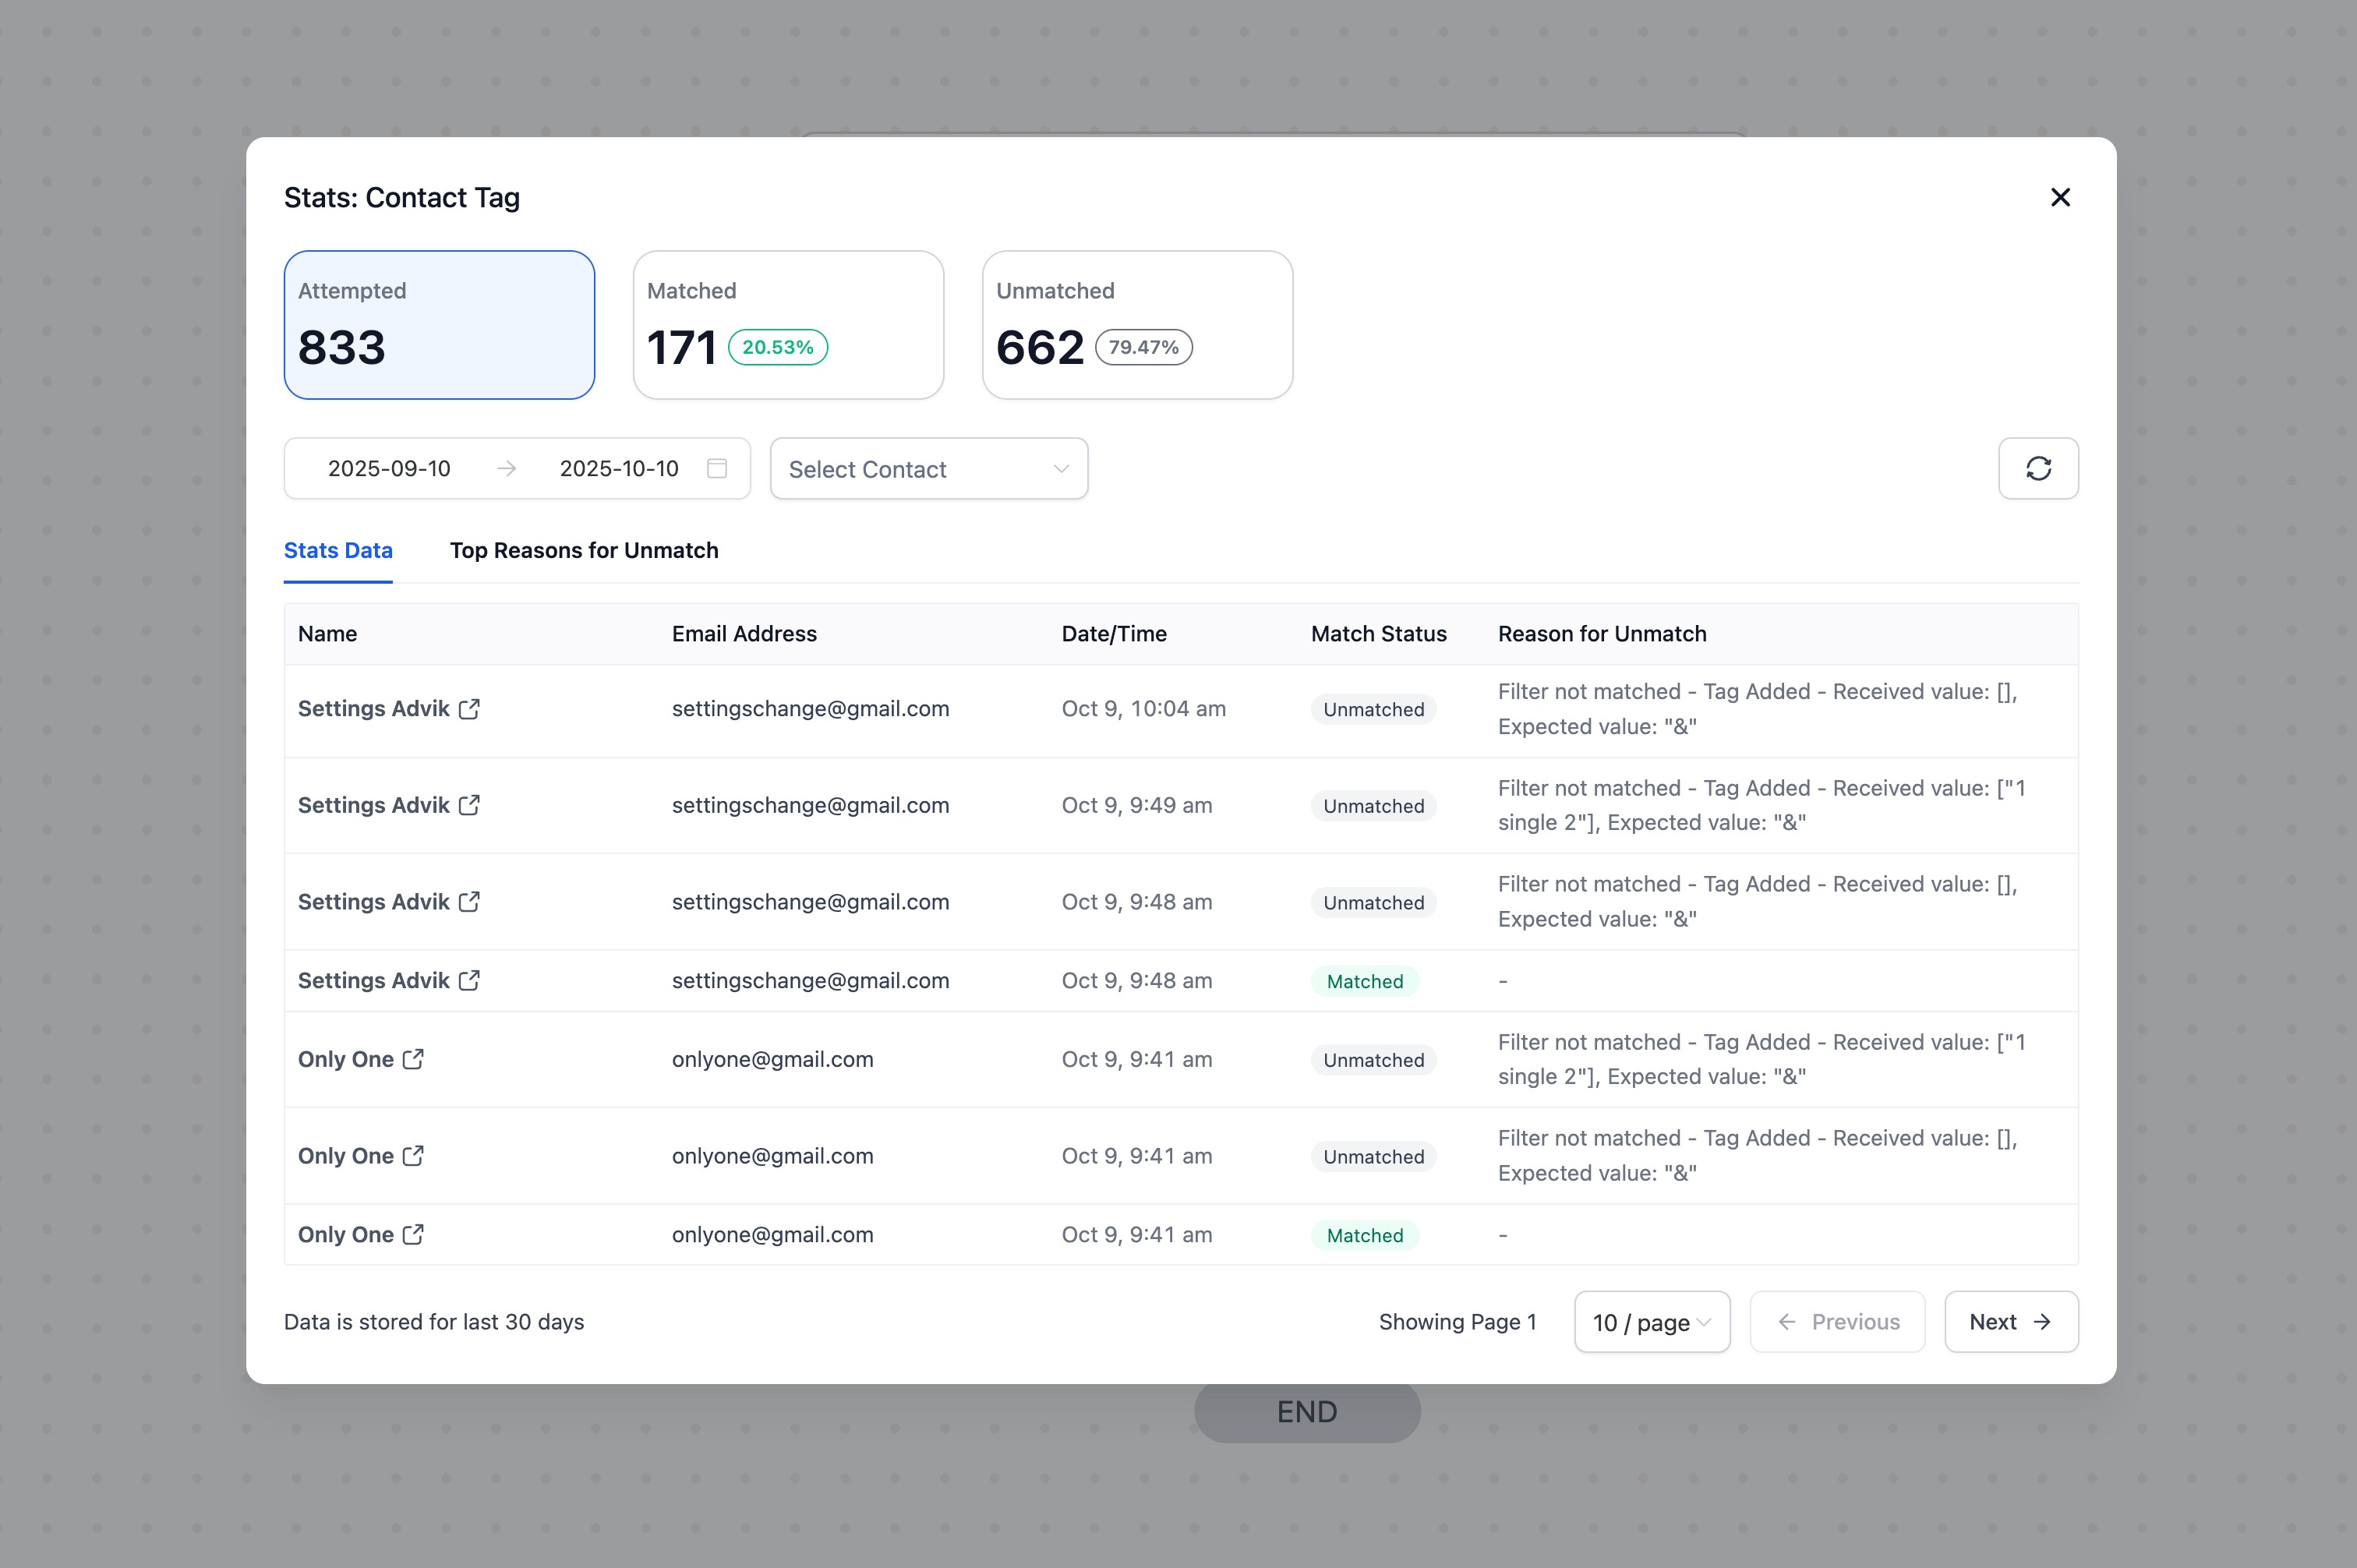
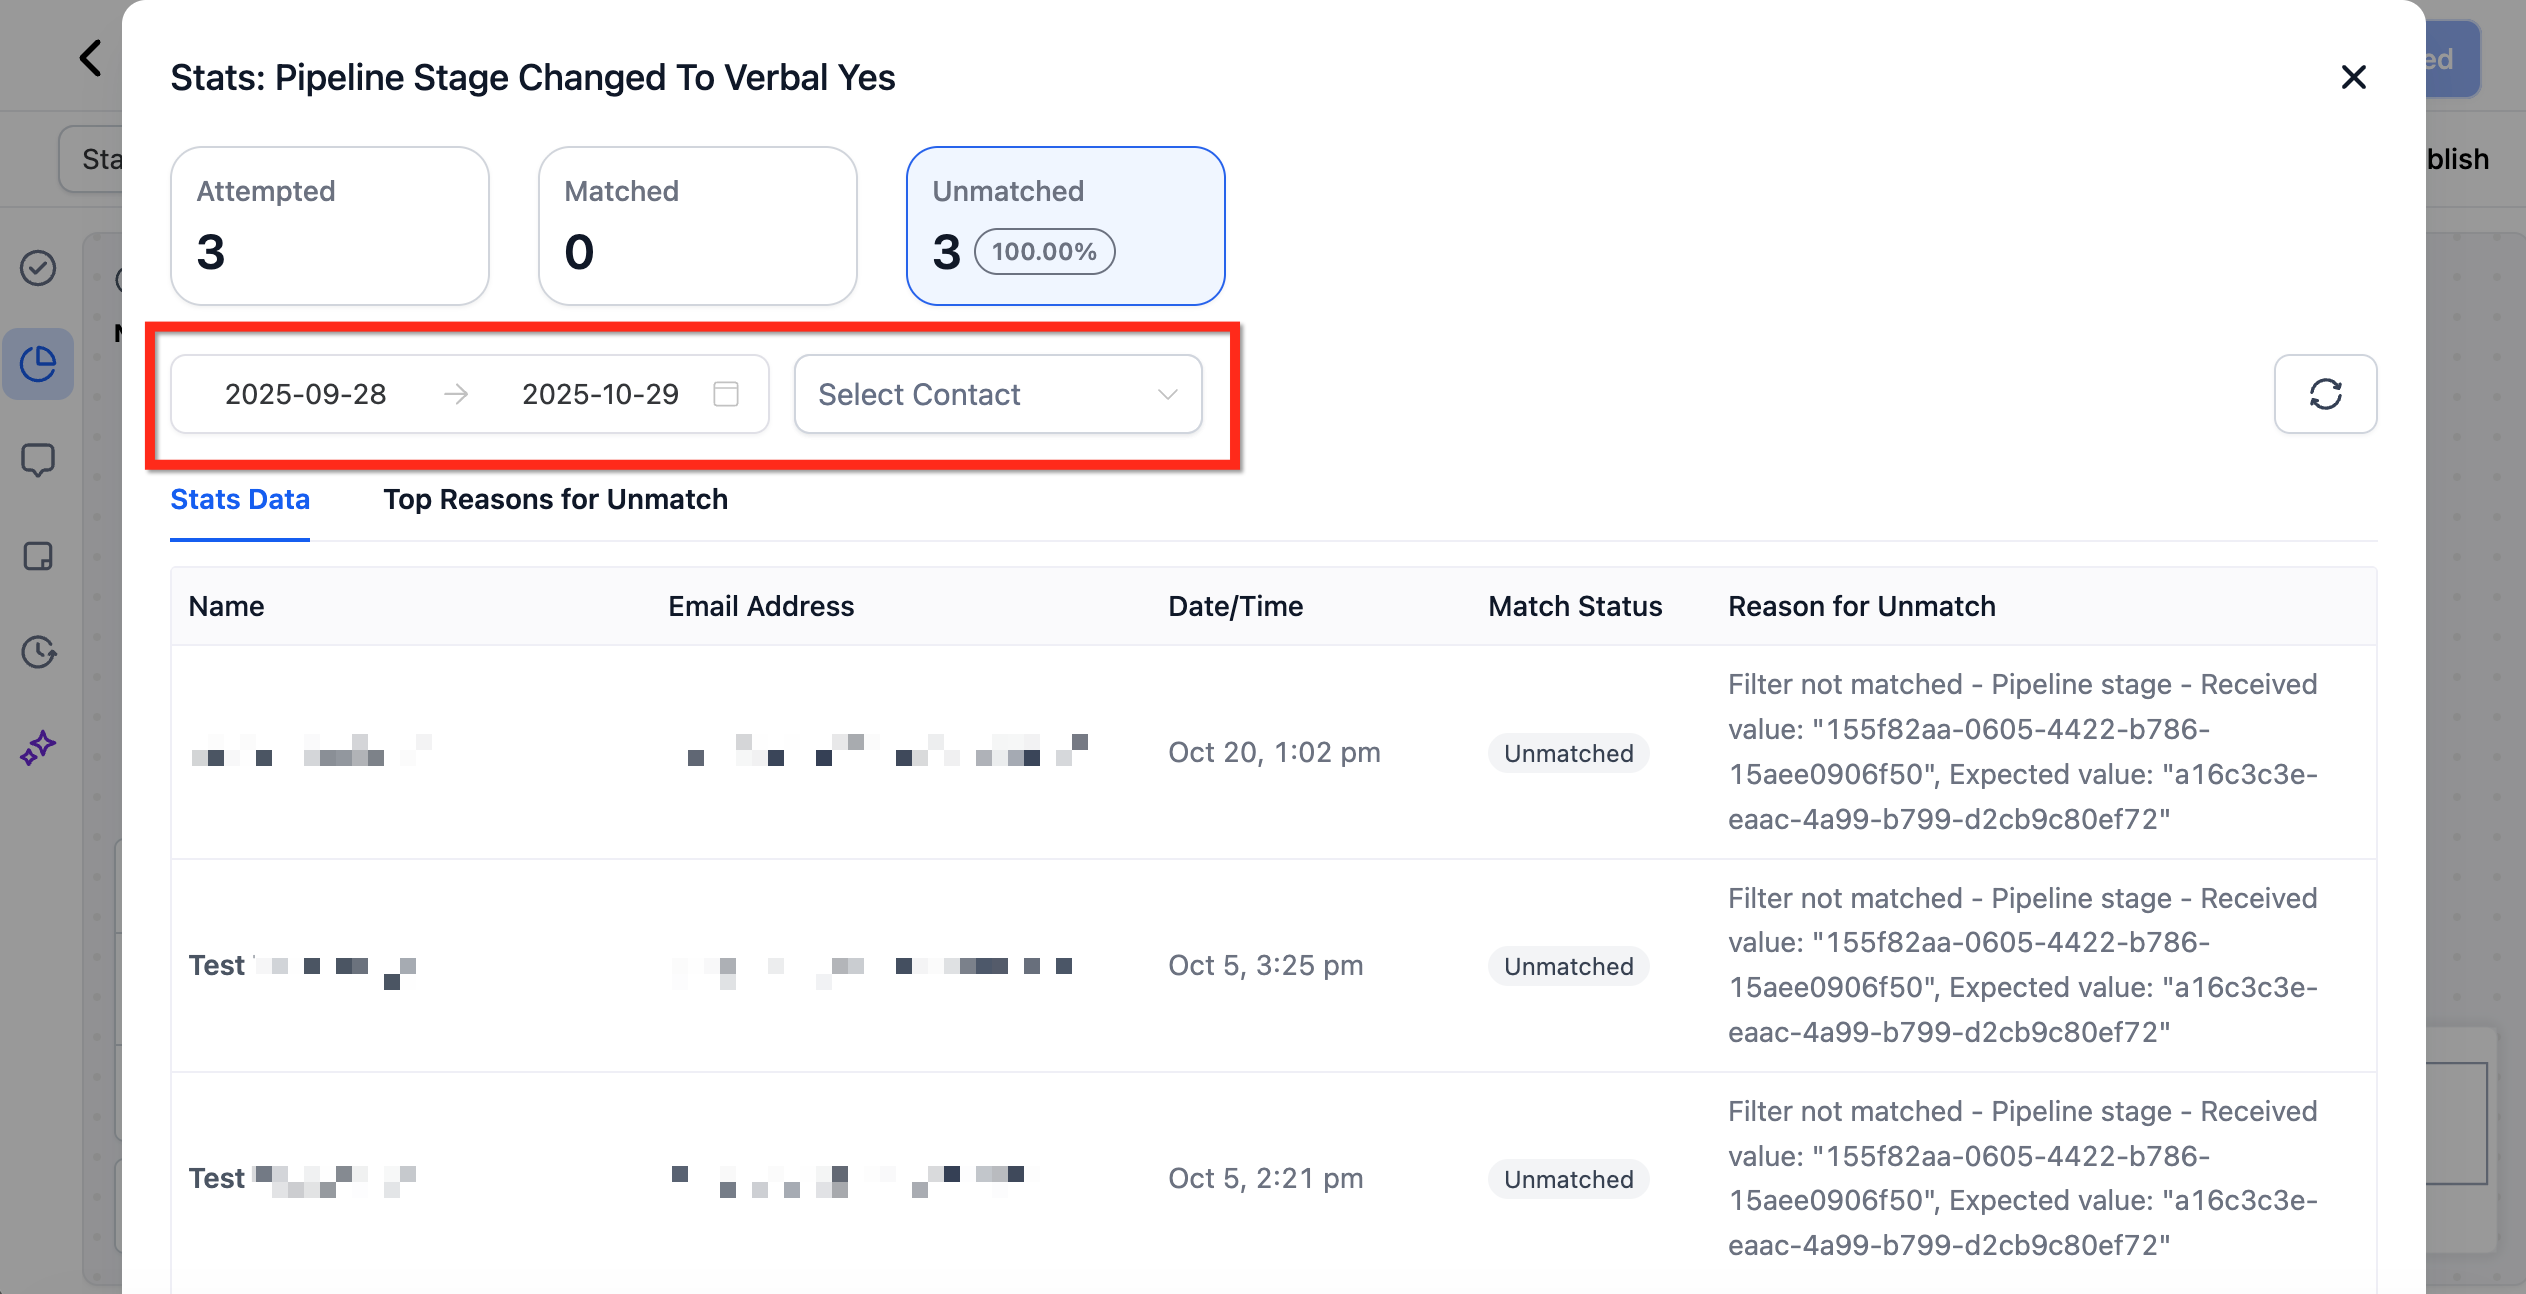
Trigger Stats is a diagnostic view that lives inside the builder. It displays three totals for each trigger: Attempted, Matched and Unmatched. Clicking any total opens the Trigger Stats Panel, where you see each contact evaluated, the match status, and the specific reason a contact did not match (for example a missing field). The panel includes date range and contact search filters, and the data refreshes in real time. Stats are read only and only retain the most recent 30 days of activity. The view works in both the Standard and Advanced Workflow Builders.
03How businesses use workflow trigger narration and statistics
- Digital marketing agency. Open a client’s workflow, view the narration on each trigger card to confirm the targeting criteria, then check the stats panel for any high unmatched counts that may indicate data gaps.
- Ecommerce store. Within a post purchase automation, inspect the trigger stats to see how many shoppers entered the workflow after a purchase event, and drill into unmatched reasons to correct filter settings.
- Coaching business. When setting up a new lead capture workflow, use the narration to verify that the trigger includes the correct form fields, and monitor the attempted versus matched numbers to ensure leads are enrolling as intended.
04The numbers and rules that matter
- Stats are only available for the last 30 days.
05How to set up and use workflow trigger narration and statistics in HighLevel
View trigger narration
- Open the workflow containing the trigger you want to inspect.
- Locate the trigger card on the canvas; the narration appears directly below the trigger name.
- If the trigger has many filters, click the "+X more" link to expand the summary.
- Select the Details button to open a panel that lists the full filter set in readable form.
View trigger stats
- Enter the workflow and switch to Stats View using the view selector.
- Click on the trigger whose performance you wish to examine.
- Read the Attempted, Matched and Unmatched numbers shown on the trigger card.
- Click any of the three numbers to open the Trigger Stats Panel for detailed contact information.
- Use the date range selector or contact search field inside the panel to focus on specific records.
06What it looks like in HighLevel
07Things to know before you rely on it
- Trigger Stats only retain data for the last 30 days.
- The Stats view is read only; you cannot edit the workflow while in this mode.
- Stats are available in both the Standard and Advanced Workflow Builders.
08How it connects to the rest of HighLevel
- Learn about all workflow trigger types Triggers Overview
- Step by step guide to building workflows with triggers, filters, and actions Workflow creation guide
- Basics of setting up workflow automation in HighLevel Workflow automation basics
Michael's take

Workflow trigger narration and statistics give a small business a clear view into why automations start and how often they succeed.
Don’t overlook the 30 day data limit when you’re trying to diagnose long term trends.