
01Who this is for
- Agency admins who need to present clear performance metrics to clients, because the reports break down spend, clicks and ROI.
- Ecommerce owners who track sales and cost per acquisition to gauge ad efficiency.
- Local service providers who monitor leads and cost per lead to manage marketing budgets.
02Facebook ad reporting terminology, explained
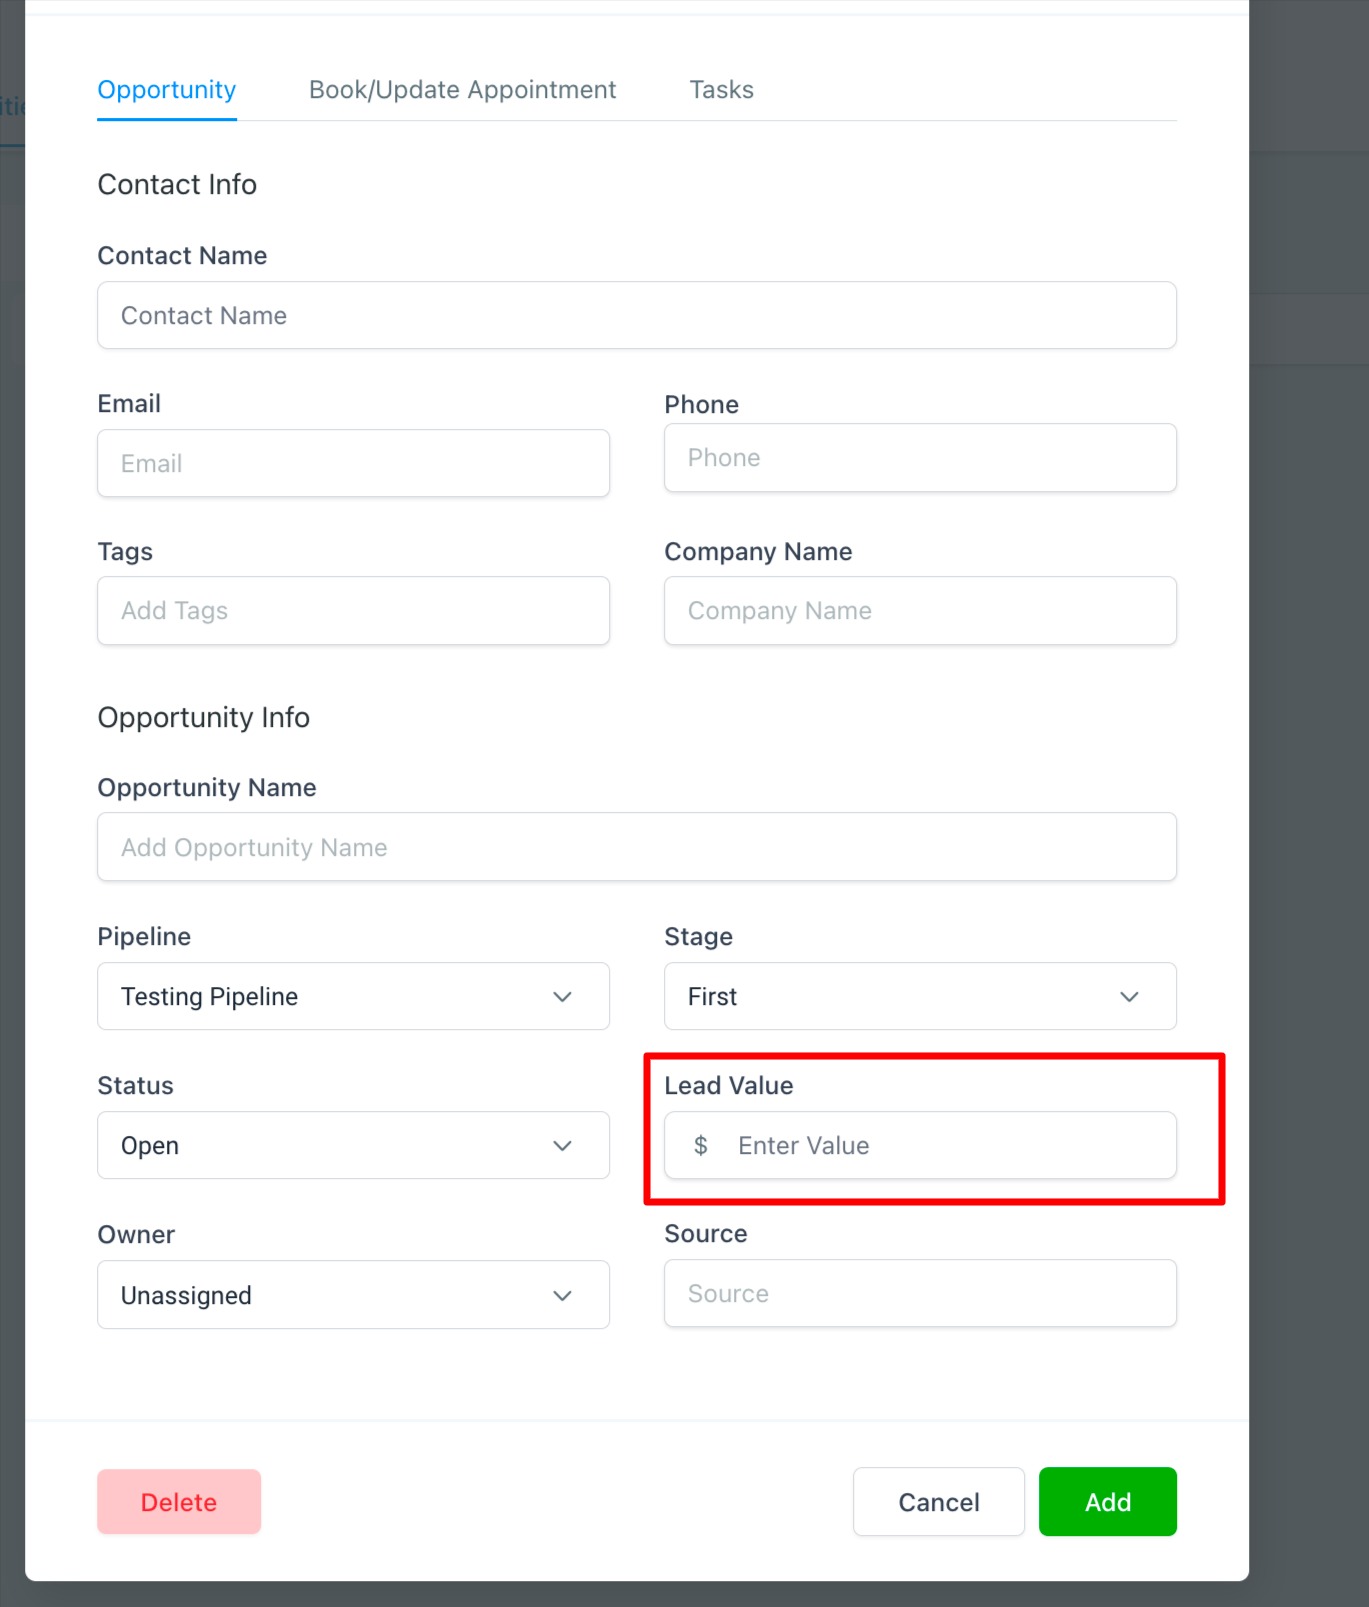
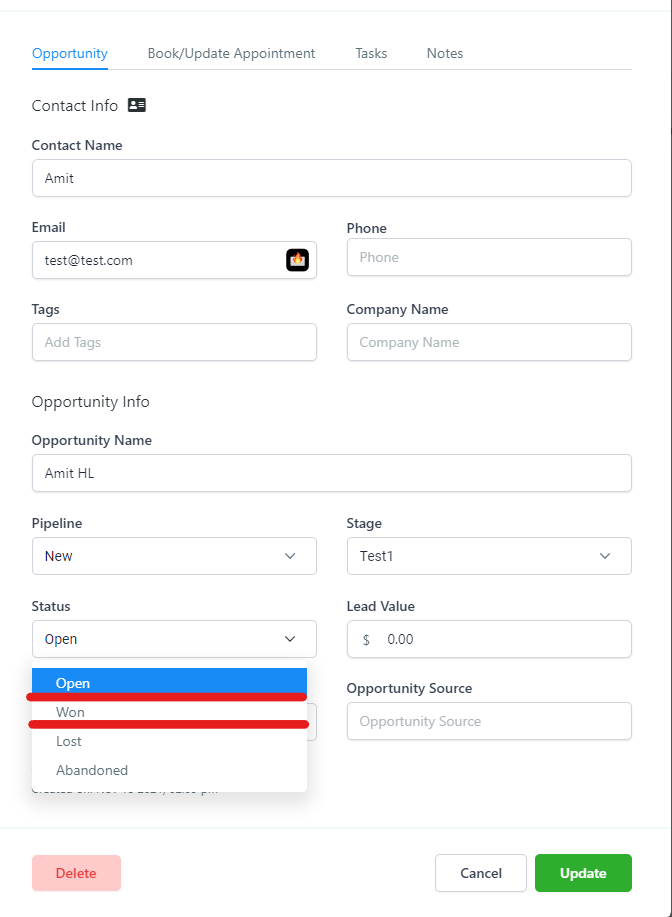
Facebook Ad Reporting gives a real time view of a client’s ad campaign within the HighLevel reporting area. The dashboard lists metrics such as impressions, clicks, conversions, client spend, average CPC, CPA, conversion rate, revenue, ROI, sales, CPS, leads and CPL. Each metric is derived from the data that Facebook supplies and from values entered in HighLevel, for example lead values on won opportunities. Client spend is visible only to Agency Admin and Agency User roles.
03How businesses use Facebook ad reporting terminology
- Digital marketing agency. The agency reviews the Facebook Ad Reporting dashboard to see total impressions, clicks and CPA for each client campaign. It uses the ROI figure to discuss performance with the client and to adjust budgeting.
- Ecommerce store. The store owner checks the revenue and CPS numbers in the report to compare ad spend against sales generated. The CPL metric helps assess the cost of acquiring new newsletter sign ups.
- Local service business. A plumber looks at the leads and CPL values to understand how many service requests came from Facebook ads and the cost of each request, informing future ad spend decisions.
04What it looks like in HighLevel
05How it connects to the rest of HighLevel
- Adding UTM parameters to Facebook ads ensures the reporting dashboard captures source data correctly. UTM parameters guide
- Understanding attribution sources helps explain which campaigns contributed to conversions shown in the report. Attribution sources
- Custom reports can be built, scheduled and exported to share Facebook ad performance with stakeholders. Custom report guide
Michael's take

I would begin with matching revenue and lead values to each campaign, then watch how CPA, CPL and ROI move as you tweak spend.
If I were setting up a new client, I would pull the live reporting into a dashboard, label each metric clearly, and compare the cost per result against the client’s profit margins.