
01Who this is for
- Marketing managers can spot local hotspots and direct spend where visitors are most concentrated.
- Local business owners gain a clear picture of which cities drive the most site traffic for targeted promotions.
- Digital advertisers use the drilldown to compare performance across states and adjust campaigns in real time.
02Geographic analytics (state & city drilldown), explained
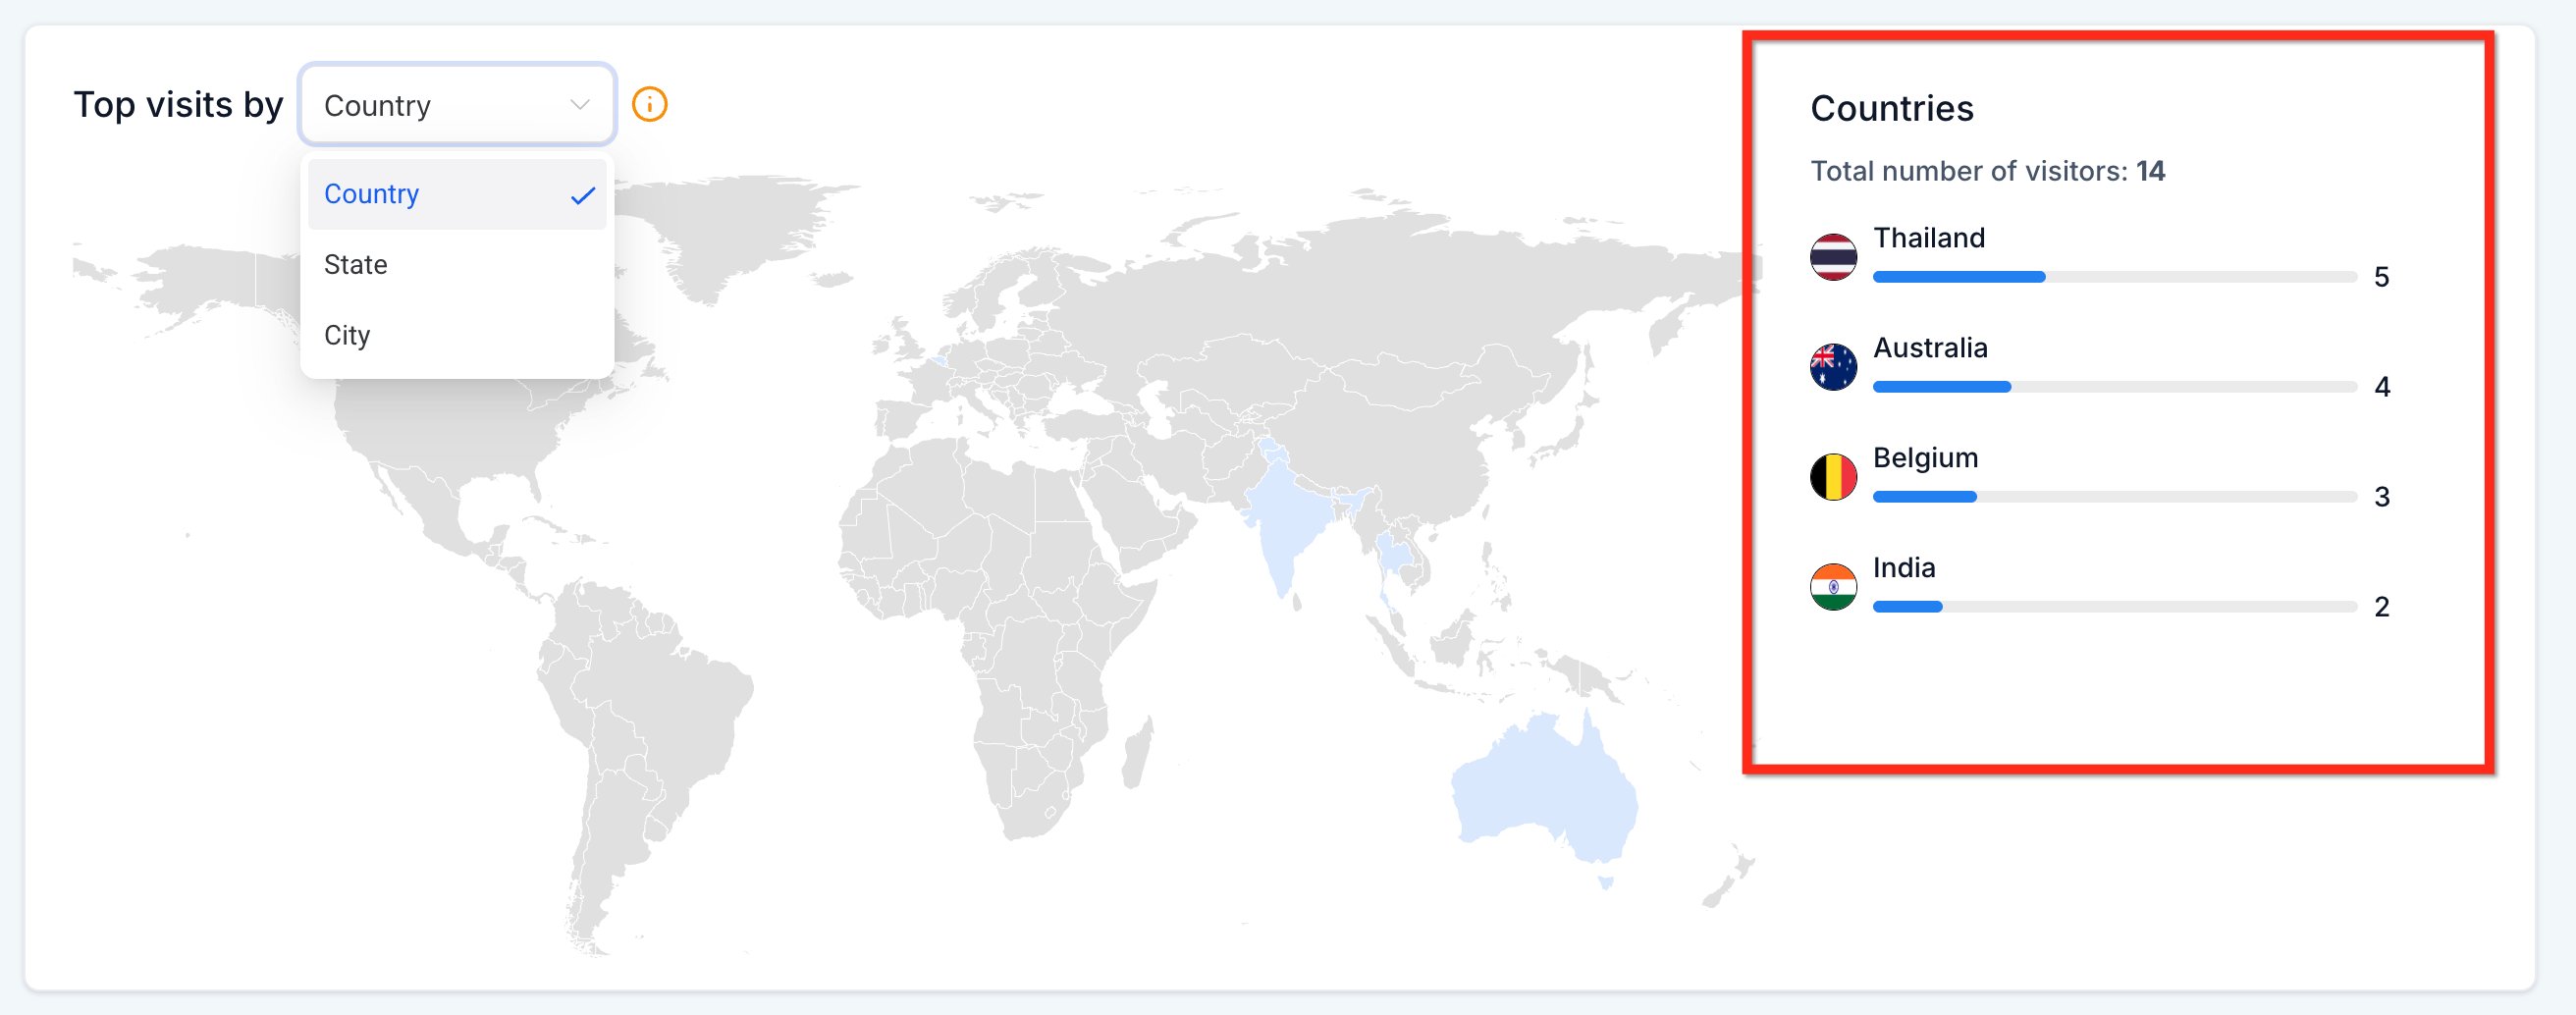
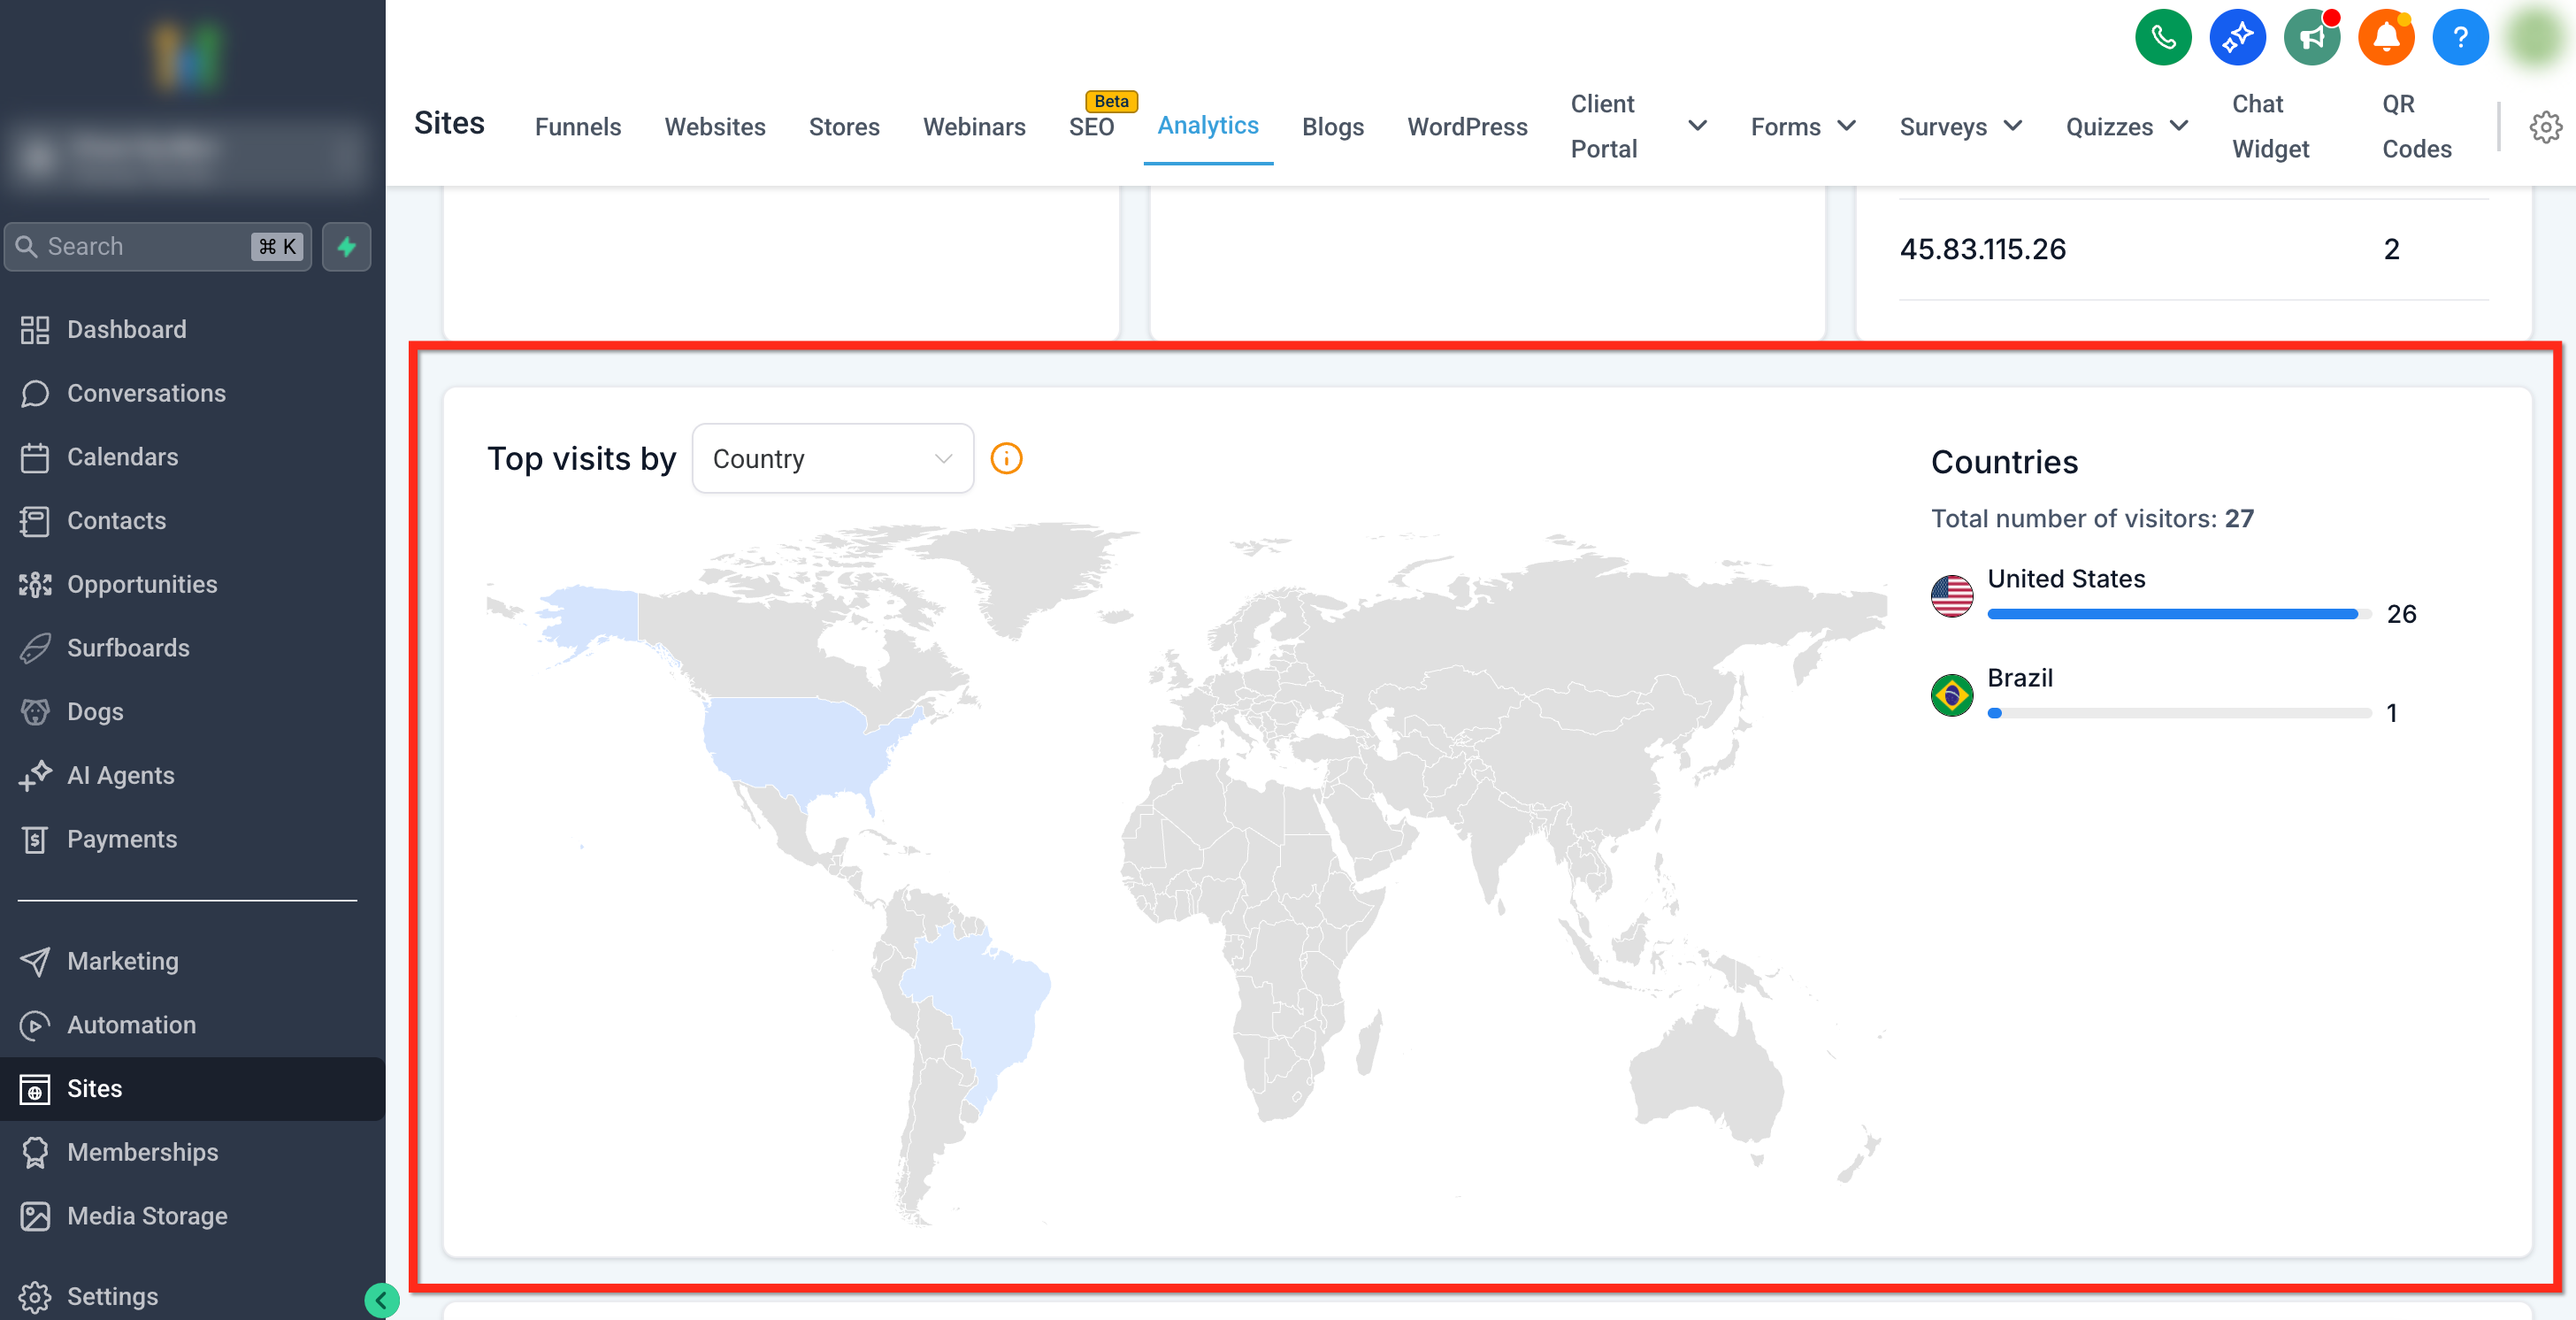
Geographic Analytics appears inside the Sites Analytics page as a heat map card. It visualizes traffic from the country level down to individual cities, shading regions darker as visit counts rise. A side panel lists the top locations in rank order and updates automatically when the map view changes.
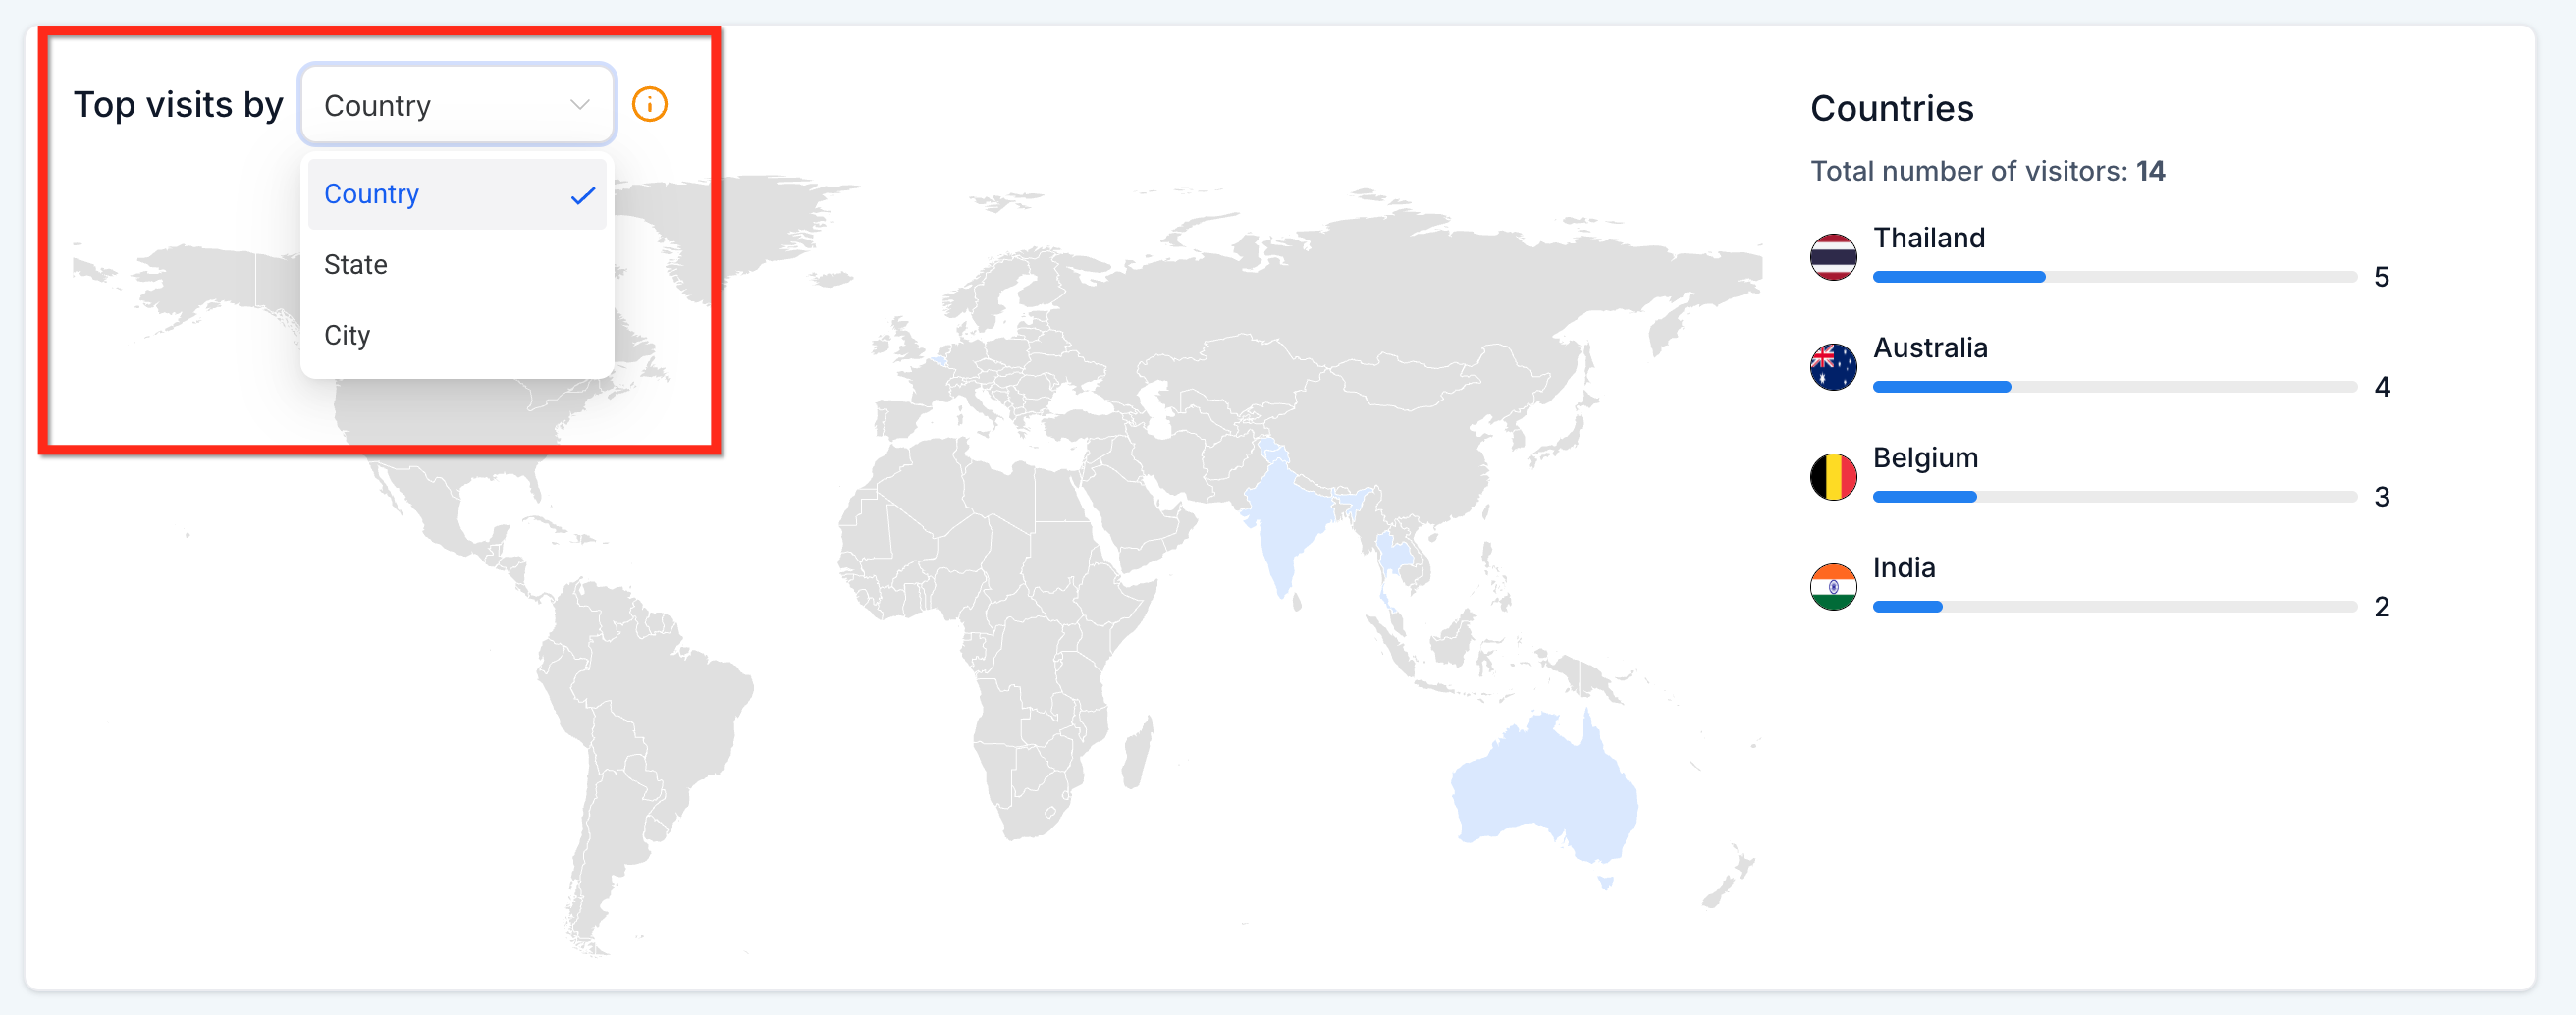
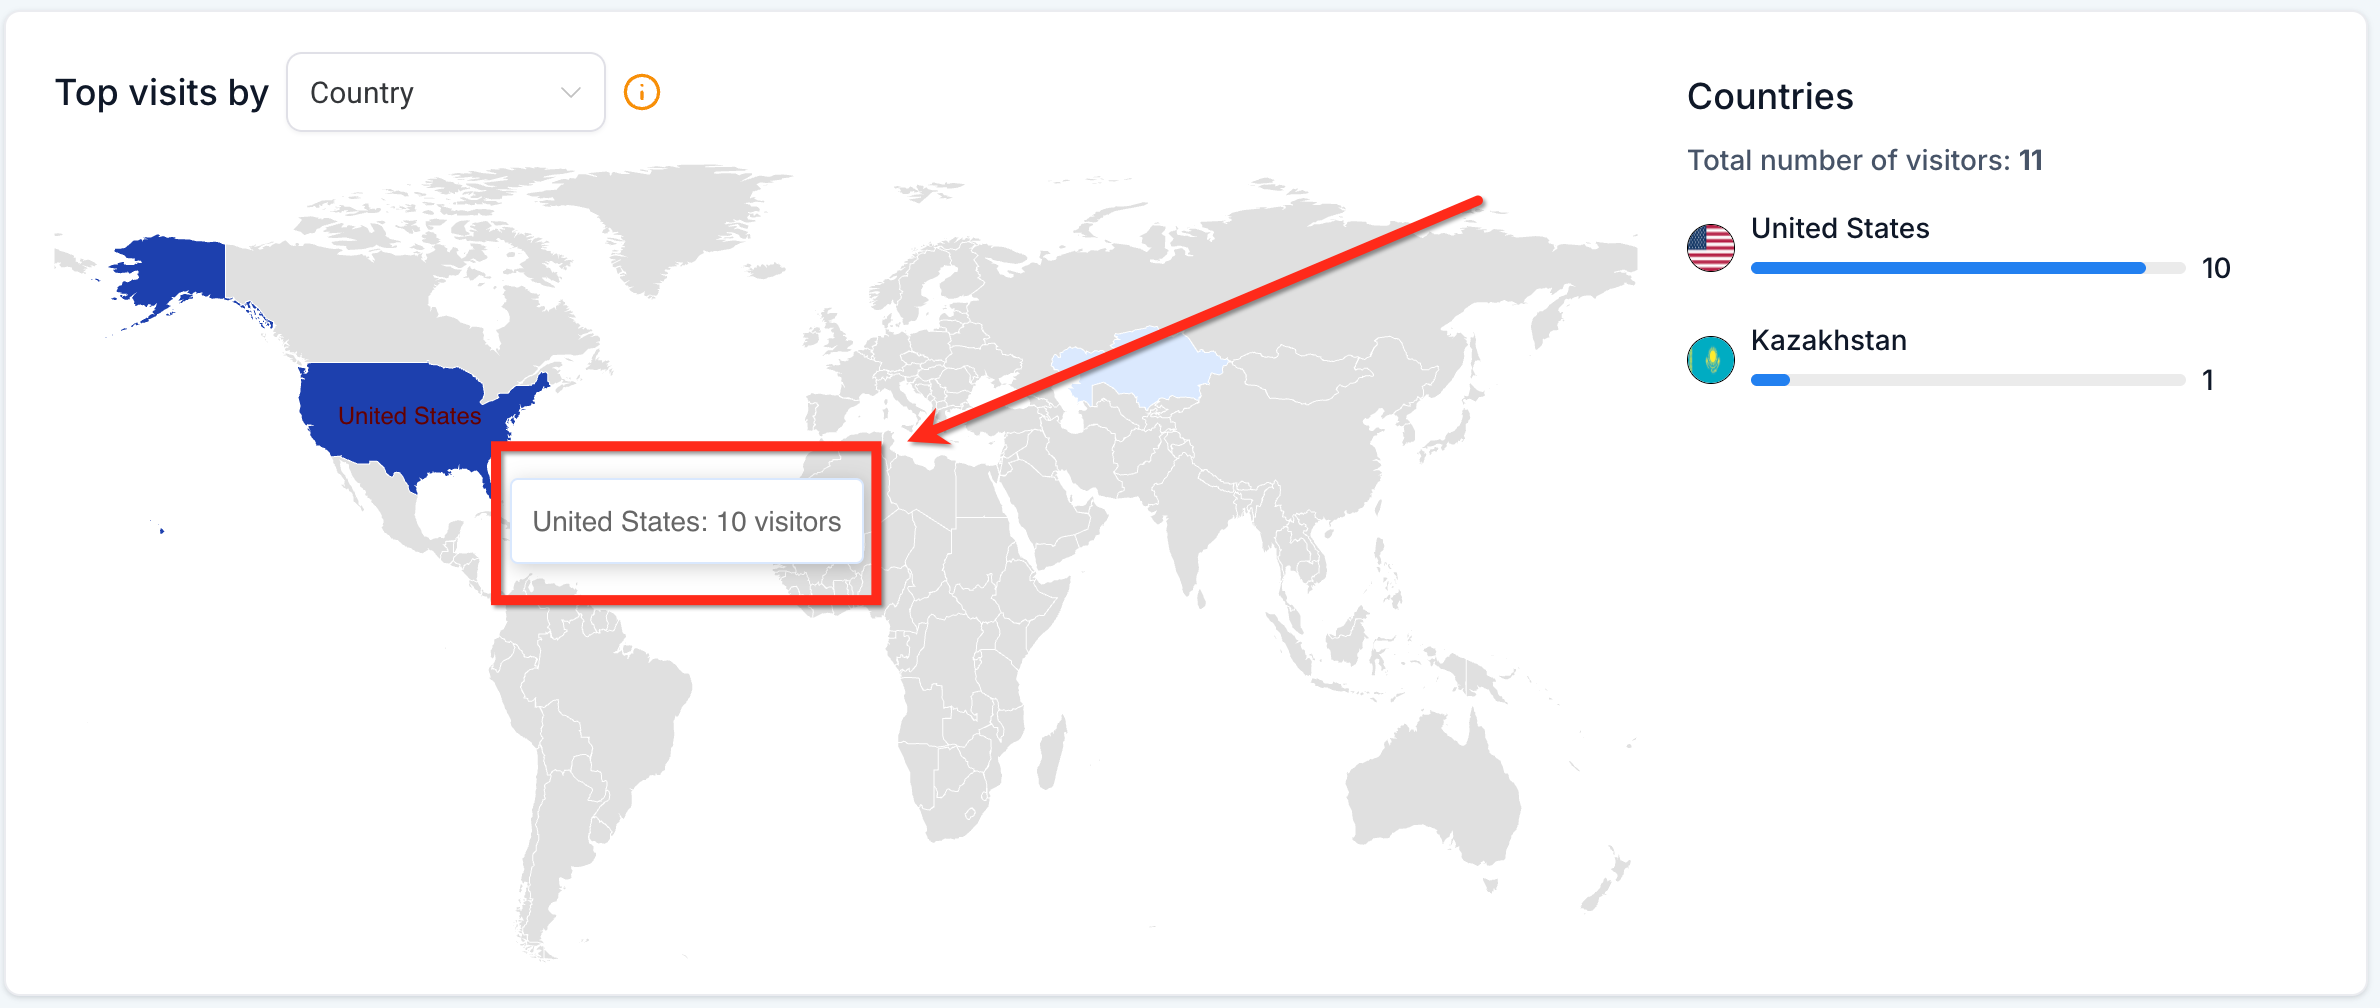
The dropdown above the map lets you switch between country, state and city displays. Selecting a new level right away redraws the map and refreshes the ranked list without reloading the page. Hovering any shaded area shows a tooltip with the exact number of visitors for that region.
03How businesses use geographic analytics (state & city drilldown)
- Real estate agency. Open the Geographic Analytics card, choose the city level, and note the cities with the highest visitor counts. Use that information to launch localized ad campaigns for those neighborhoods.
- Regional restaurant chain. Select the state view on the heat map, review the ranked list of states, and allocate promotional budgets to the states that show the most traffic.
- Ecommerce retailer. Switch to the city drilldown, hover over each city to see precise visitor numbers, and create city specific landing pages within HighLevel based on the data.
04Before you start
- Page view tracking must already be active in Sites Analytics for the site or funnel you want to examine.
05How to set up and use geographic analytics (state & city drilldown) in HighLevel
Access geographic analytics
- Log into the subaccount dashboard.
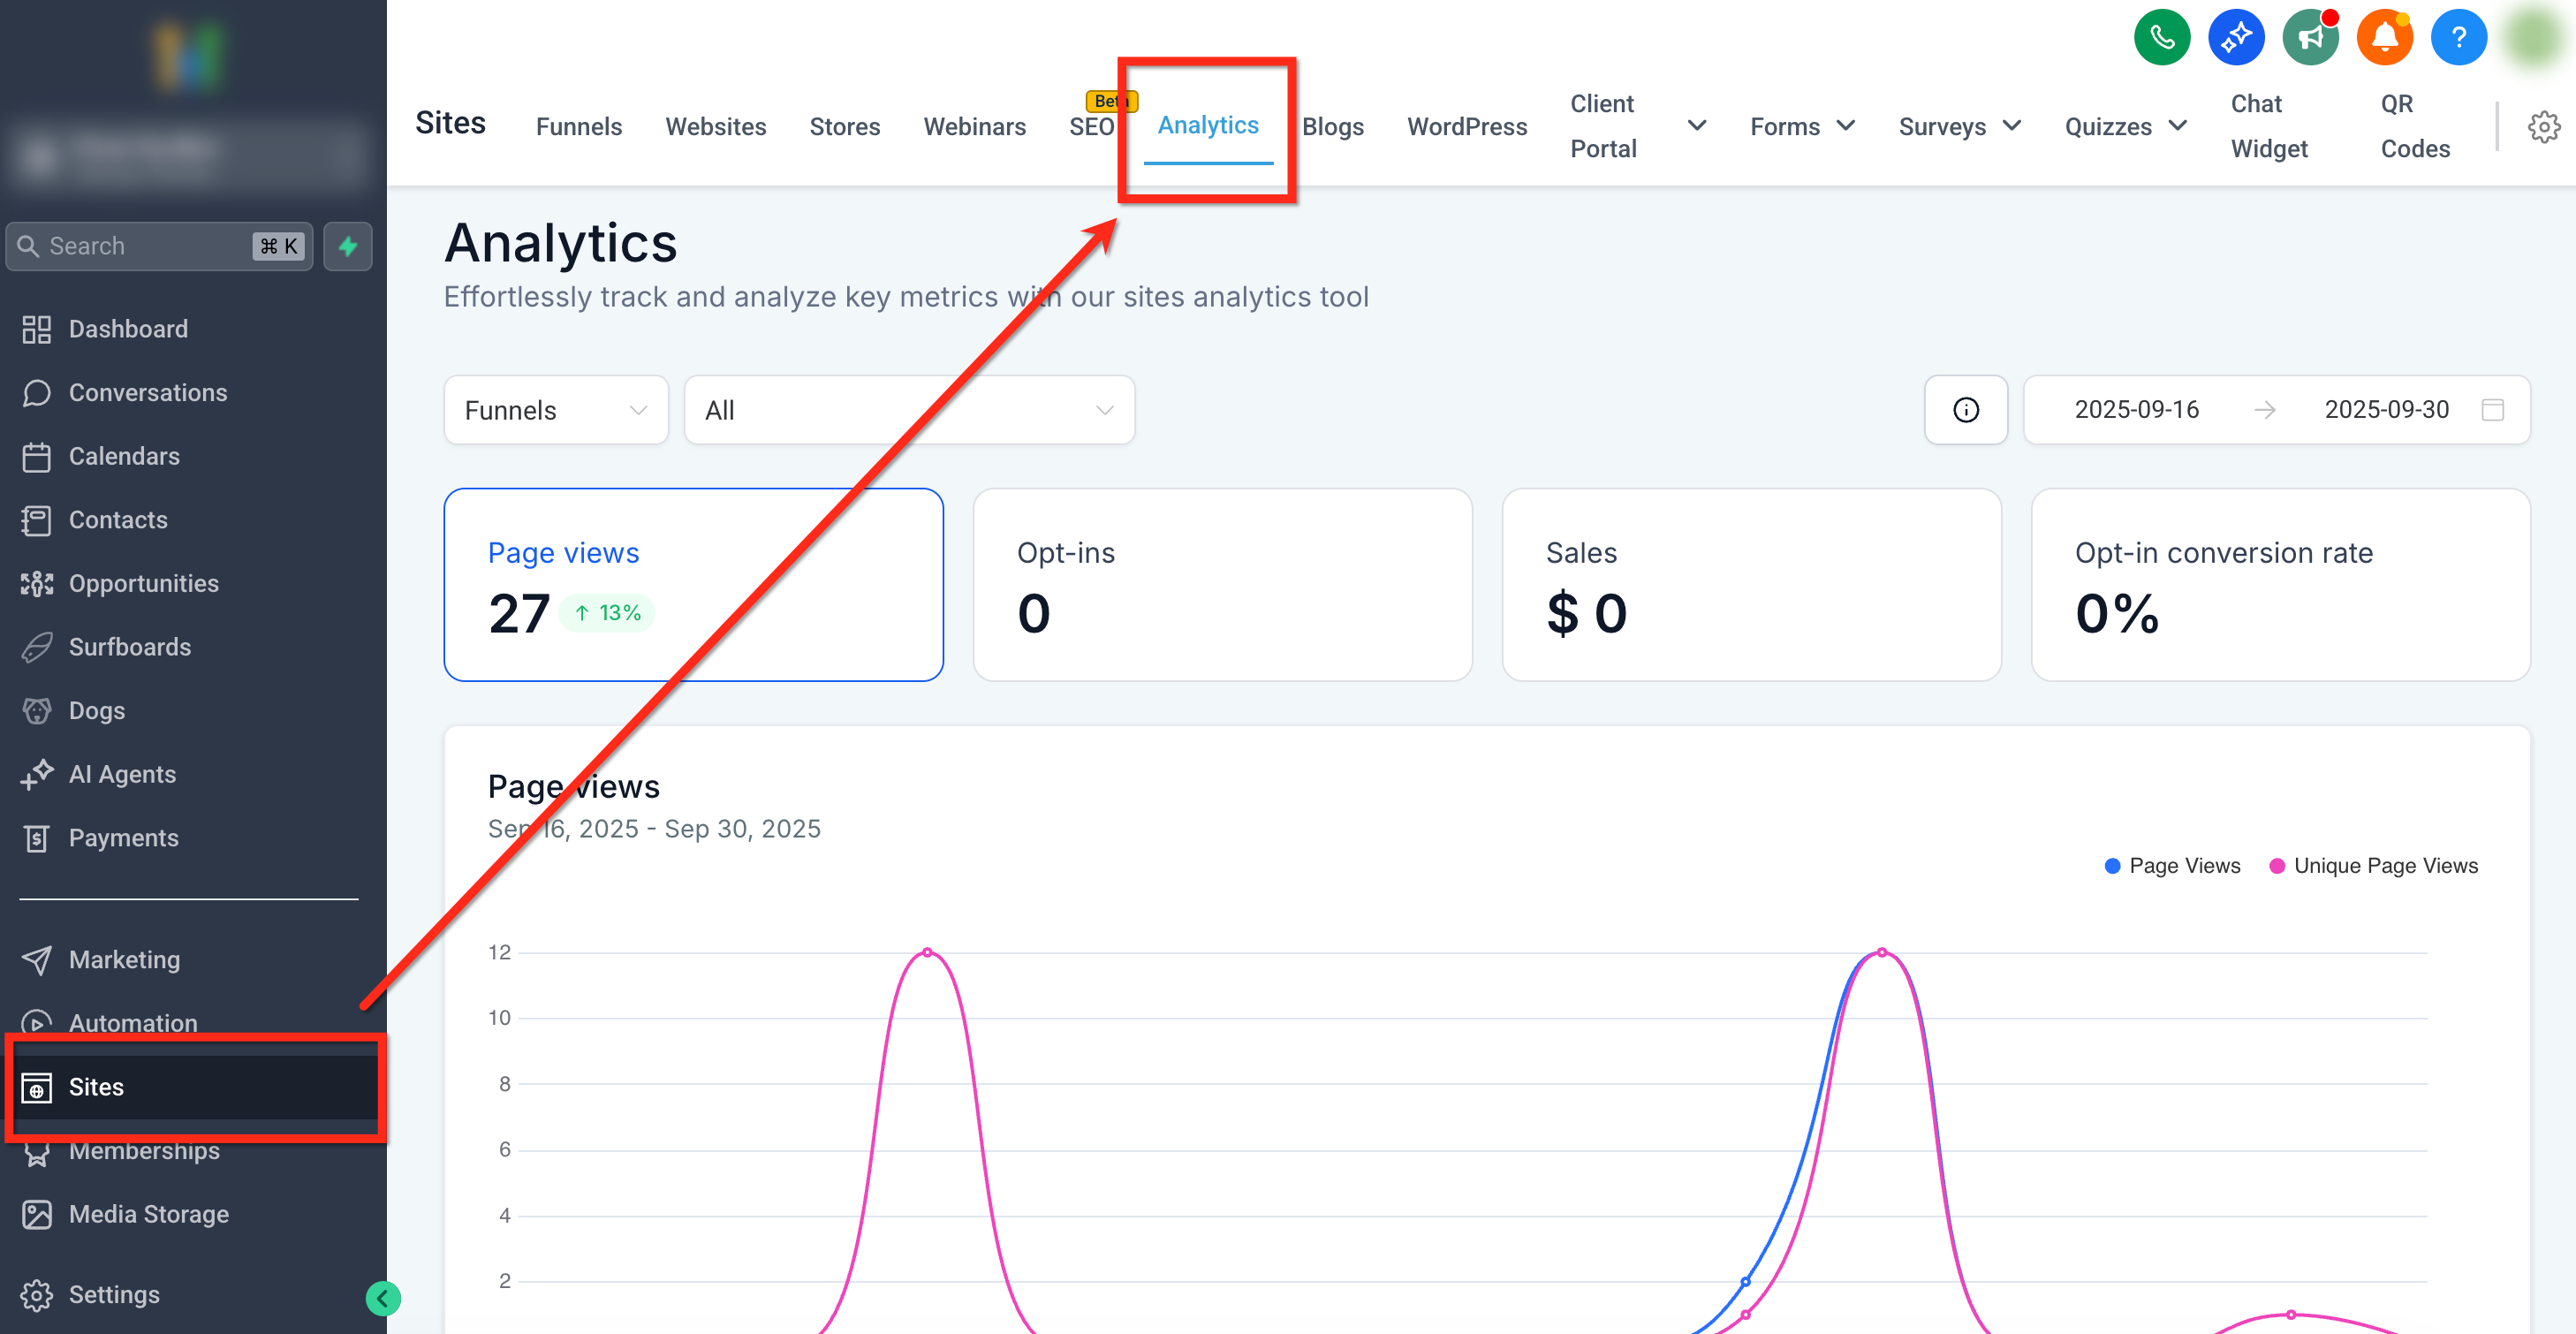
- Click the Sites item in the left navigation menu.
- Select the Analytics tab from the top ribbon.
- Scroll down until the Geographic Analytics card appears.
- Pick Country, State, or City from the dropdown above the map.
- Hover a shaded region or read the right hand list to see visitor totals.
06What it looks like in HighLevel
07Settings that matter
- Geographic Dropdown. Controls which geographic level, country, state, or city, is displayed on the heat map and ranked list.
08Things to know before you rely on it
- The map only reflects data that Sites Analytics has already recorded for the chosen date range and scope.
- It works for both funnels and websites, depending on the context selected on the Analytics page.
09How it connects to the rest of HighLevel
- Read more about using site and funnel analytics together Site & Funnel Analytics
- Explore all reporting tools available in HighLevel All Reporting Features
Michael's take

How can I quickly see which cities are driving the most traffic to my site? The heat map in Geographic Analytics lets you drill from country to state to city fast, showing live visitor counts and a ranked list on the side. It’s a handy way to spot hot spots when you’re planning location specific ads or landing pages.
If I were a Founder trying to tighten ad spend, I’d open the Geographic Analytics card, drop the selector to City, and fast see the top performing areas. From there I could reallocate budget or create localized offers. The live refresh means you don’t have to wait for a report to load. The data updates as sessions happen.