
01Who this is for
- Marketing managers can monitor ad performance across multiple levels to guide optimization.
- Small business owners can quickly spot under performing ads and adjust budgets without external tools.
- Digital agencies can generate reports for client campaigns directly from HighLevel.
02Google ad campaign statistics, explained
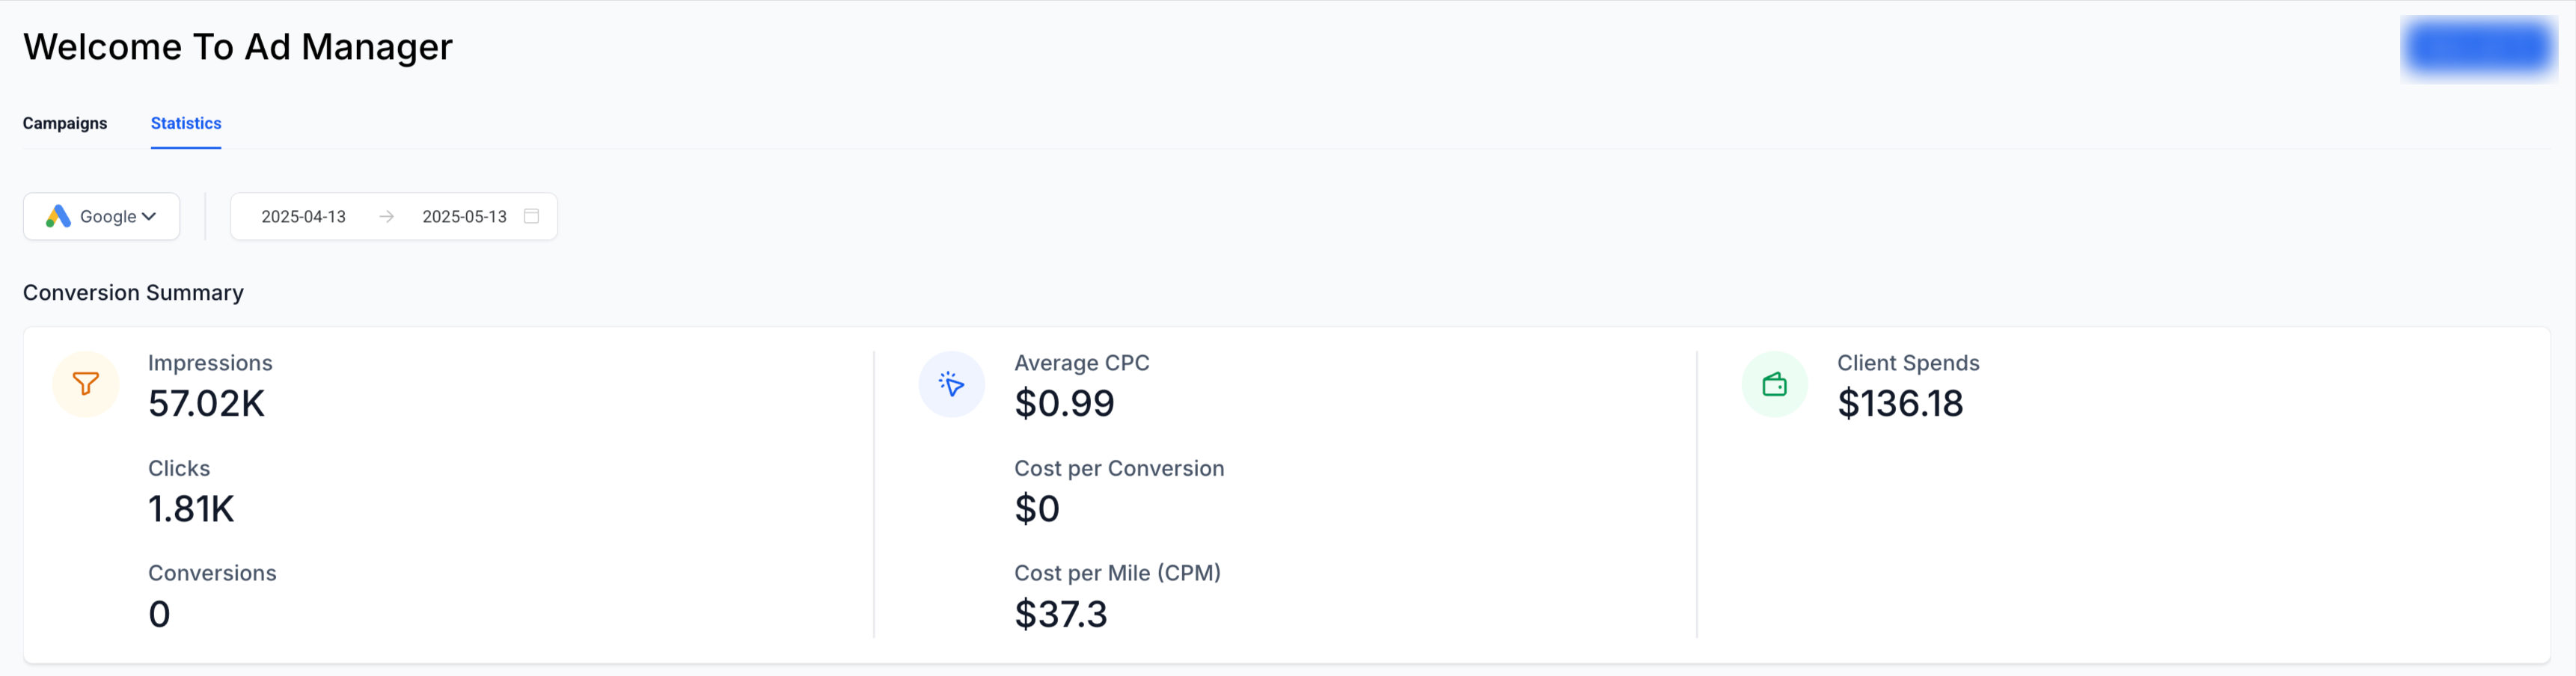
The Statistics tab in Ad Manager consolidates data from your linked Google Ads account. After selecting Google as the platform and setting a date range, the view presents a high level conversion summary and visual performance graphs.
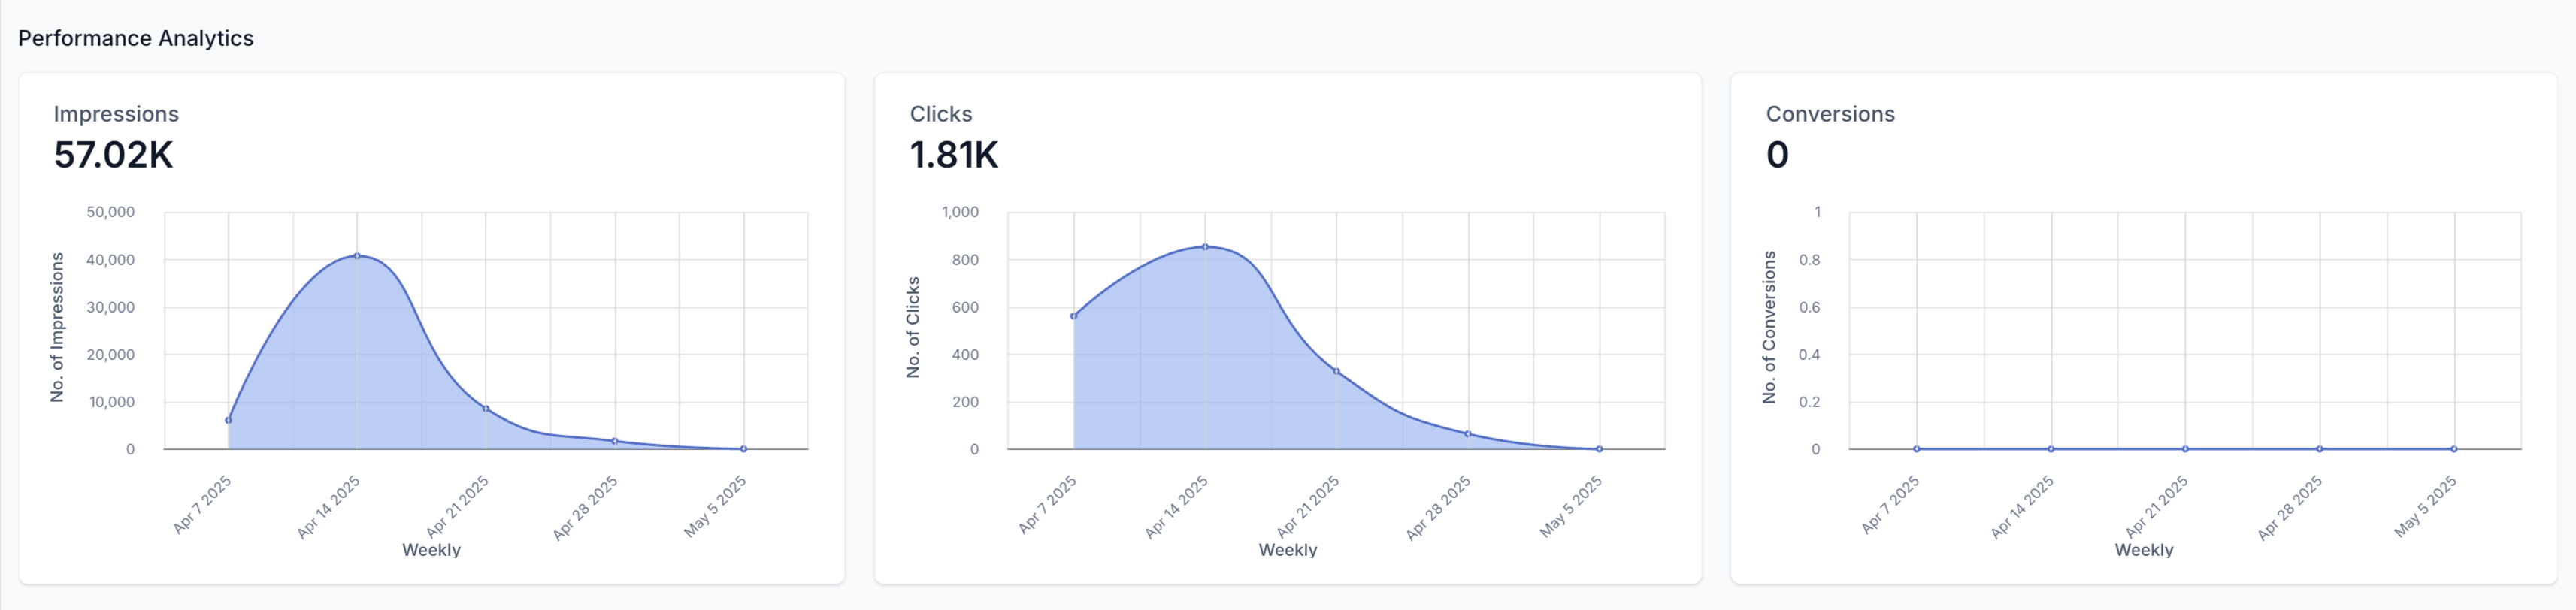
Below the summary, a graph section visualizes impressions, clicks and conversions over time, helping you spot trends. Scrolling further reveals a Campaign Details table that lists metrics such as clicks, CTR, CPC, impressions, sales, revenue, ROI%, leads, CPL and CPS for each campaign.
All of these tools reside inside the Ad Manager area of HighLevel, accessible via the top level Statistics tab.
03How businesses use Google ad campaign statistics
- Ecommerce store. The owner opens the Statistics tab, filters for the last month, and checks the conversion summary to see overall sales generated from Google ads. Then they drill into the campaign list to find the best performing ad groups and adjust budgets accordingly.
- Digital marketing agency. A media buyer selects Google in the platform dropdown, reviews the performance graphs for client campaigns, and uses the campaign level table to export metrics for reporting. They also examine keyword performance within each campaign to advise clients.
- Local service business. The manager clicks a specific campaign name, opens the ad group view, and identifies low click ad groups. They pause those groups directly in the dashboard and focus on the ads and keywords that drive the most leads.
04The numbers and rules that matter
- Average CPC: Average cost per click.
- Cost per Conversion: Calculated cost to acquire one conversion.
- CPM: Cost per thousand impressions.
05How to set up and use Google ad campaign statistics in HighLevel
Access the Statistics tab to begin viewing Google Ads data
- Open the Ad Manager area in HighLevel.
- Click the Statistics tab located at the top of the interface.
- Choose Google from the platform selector dropdown.
- Set the desired date range to filter the displayed data.
View campaign level metrics in the Campaign Details table
- Scroll down until the Campaign Details table appears.
- Observe the listed metrics such as clicks, CTR, CPC, impressions, sales, revenue, ROI%, leads, CPL and CPS.
- Use the search bar to locate a specific campaign, then export or customize the columns as needed.
Drill into an individual campaign for deeper insights
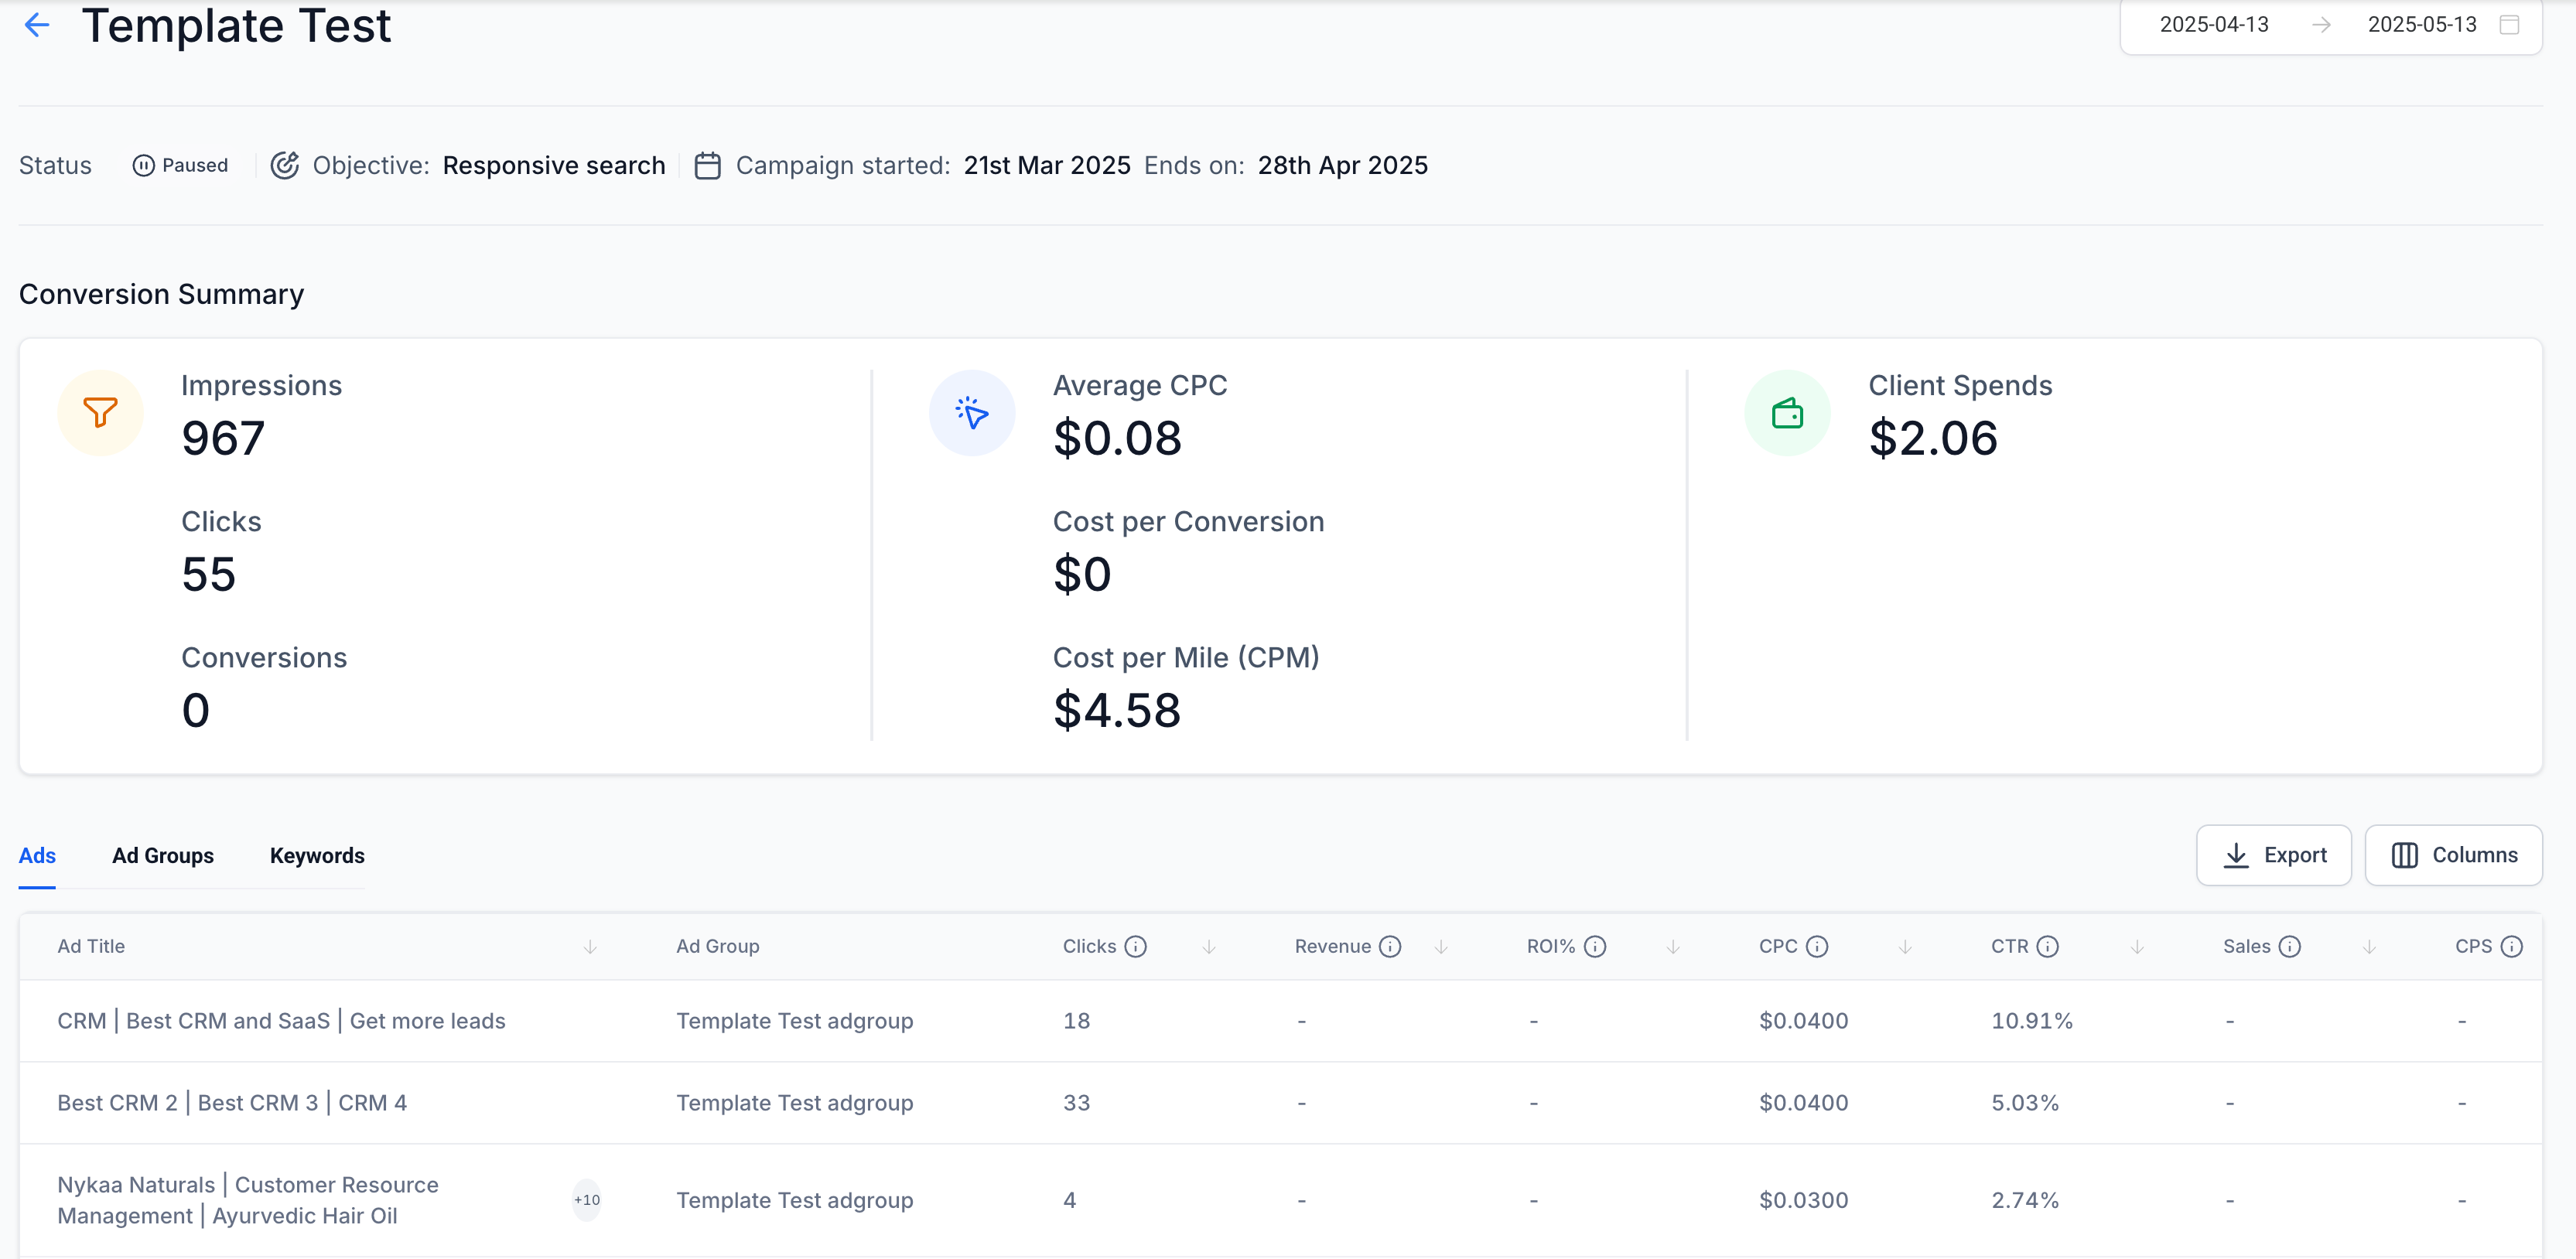
- From the list of campaigns, click the name of the campaign you want to examine.
- In the opened dashboard, select the Ad Group Performance view to see clicks, impressions and conversions per ad group.
- Switch to the Ad Performance view to evaluate each creative’s results within the ad groups.
- Open the Keyword Performance section to identify which keywords are delivering conversions or lagging.
06What it looks like in HighLevel


07Things to know before you rely on it
- Data updates only at intervals, so recent changes may not appear right away.
- Zero conversions can signal a tracking or landing page problem.
- Consistent date ranges are needed for accurate side by side comparisons.
08If something goes wrong
- Metrics are not appearing after a new campaign is published.. Allow time for the data to refresh as the system updates periodically.
- Conversion numbers show zero even though actions were taken.. Check that conversion tracking is correctly set up and that the landing page records the events.
09How it connects to the rest of HighLevel
- Enable Ad Manager and link your Google Ads account Connect Google Ads
- Create a Google Search campaign within Ad Manager Build Search Campaign
- Manage multiple ad groups and ads for Google Ads Multiple Ad Groups
Michael's take

People often jump straight to the campaign list and start tweaking budgets without first checking the overall trends. I’d start by opening the Statistics tab, selecting Google, and reviewing the conversion summary and graphs to see where the account is moving.
Once the big picture is clear, I’d drill into a specific campaign, look at ad group and keyword performance, and pause the laggards.