
01Who this is for
- Agency owners who need to show clients SLA compliance without leaving the platform.
- Support managers who want to track individual team member performance against response targets.
- Marketing teams that require channel specific SLA insights for SMS, email, and social messaging.
02SLA widgets, explained
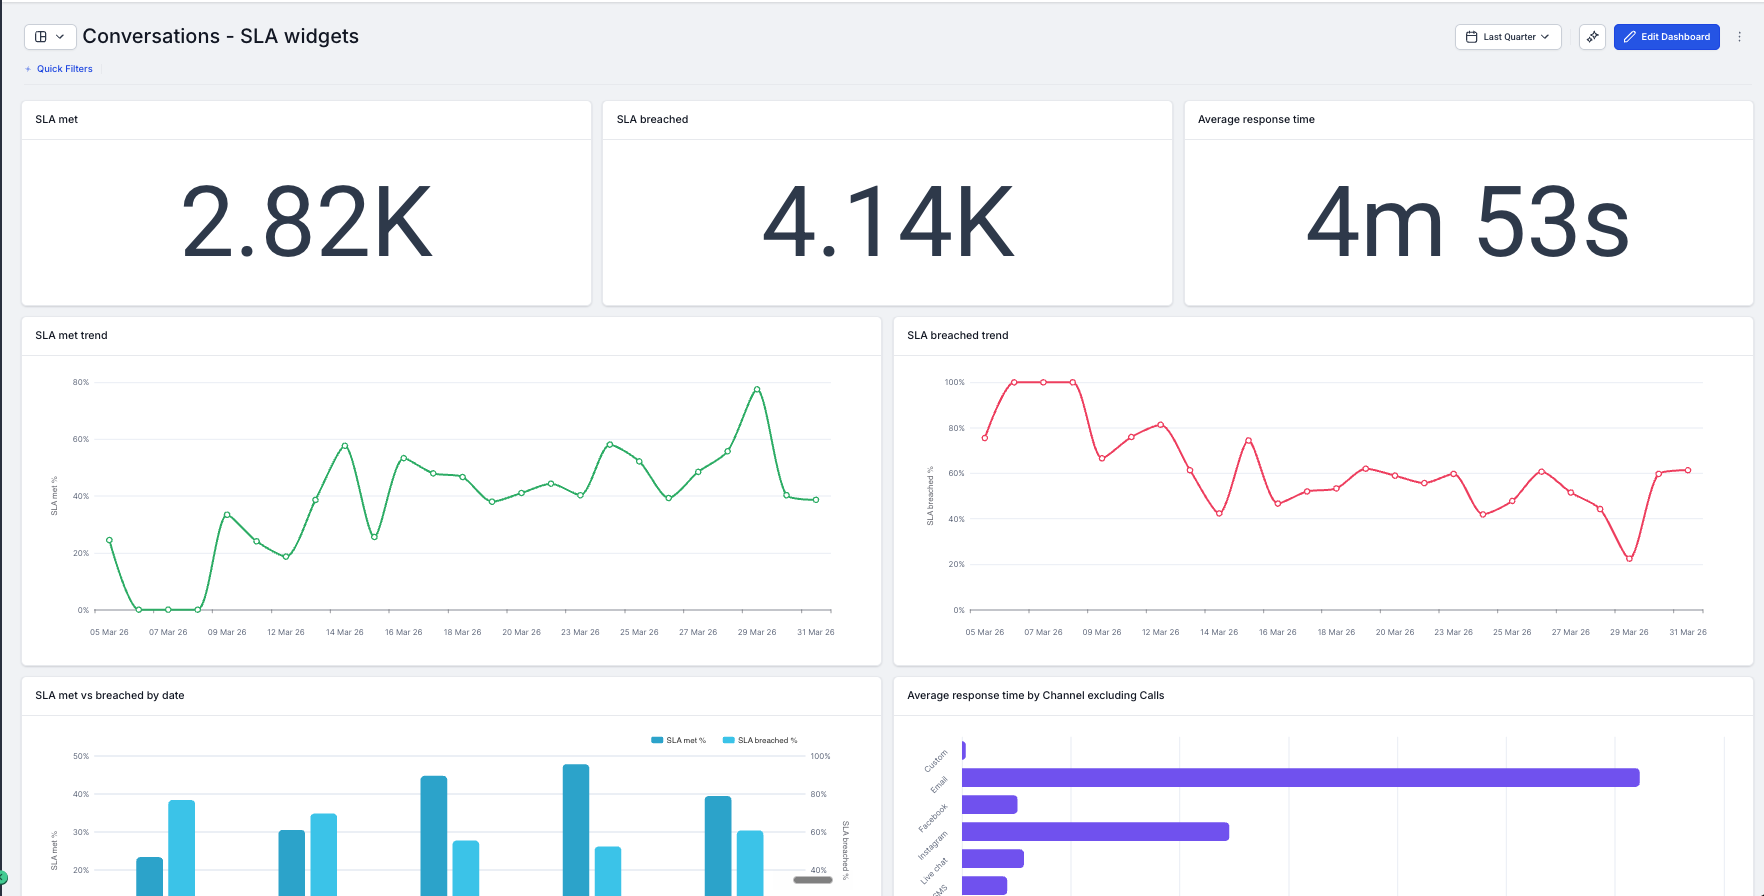
SLA widgets pull data from the SLA settings in the Conversations module and render it as numeric KPIs, trend lines or tables. Four widget types cover met trends, breach trends, average response time, and performance by user or channel. The widgets appear in the Conversations section of any dashboard or report layout.
Each widget can be customized through Configure, Conditions and Themes tabs. Configure controls the chart type, metric, grouping and date range. Conditions add filters such as assigned user or message channel. Themes let you match colors to the dashboard style. Widgets respect the dashboard's top level date range, limited to a one year span.
The widgets are available wherever Dashboards & Reporting access is granted. They can be placed alongside existing conversation widgets and scheduled in custom reports for automatic email delivery.
03How businesses use SLA widgets
- Digital marketing agency. The agency adds SLA met trend and SLA breached trend widgets to a client’s dashboard. It configures the widgets to show percentages by message channel and saves the layout. The client can view SLA health at a glance whenever they open the dashboard.
- Customer support center. The support manager creates a custom report that includes the average response time trend widget. After setting the date range to the past month, the manager schedules the report to email the operations team weekly. The report delivers up to date response time trends automatically.
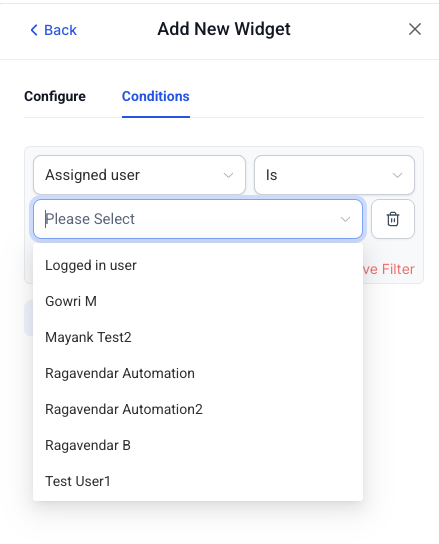
- Ecommerce business. The ecommerce team adds the SLA performance widget to a dashboard and filters it by the Assigned user condition. They rename the widget to display each agent’s SLA metric. The dashboard now shows who meets response targets, enabling quick internal reviews.
04The numbers and rules that matter
- Widgets are limited to a 1 year date range.
- Maximum date range for widgets is 1 year.
- Metrics available: SLA met %, SLA breached %, Average response time, SLA met (count), SLA breached (count).
- Message channels filterable: Call, SMS, Email, Web chat, Facebook, GMB, Instagram.
05Before you start
- User must have Dashboards & Reports permission in the subaccount.
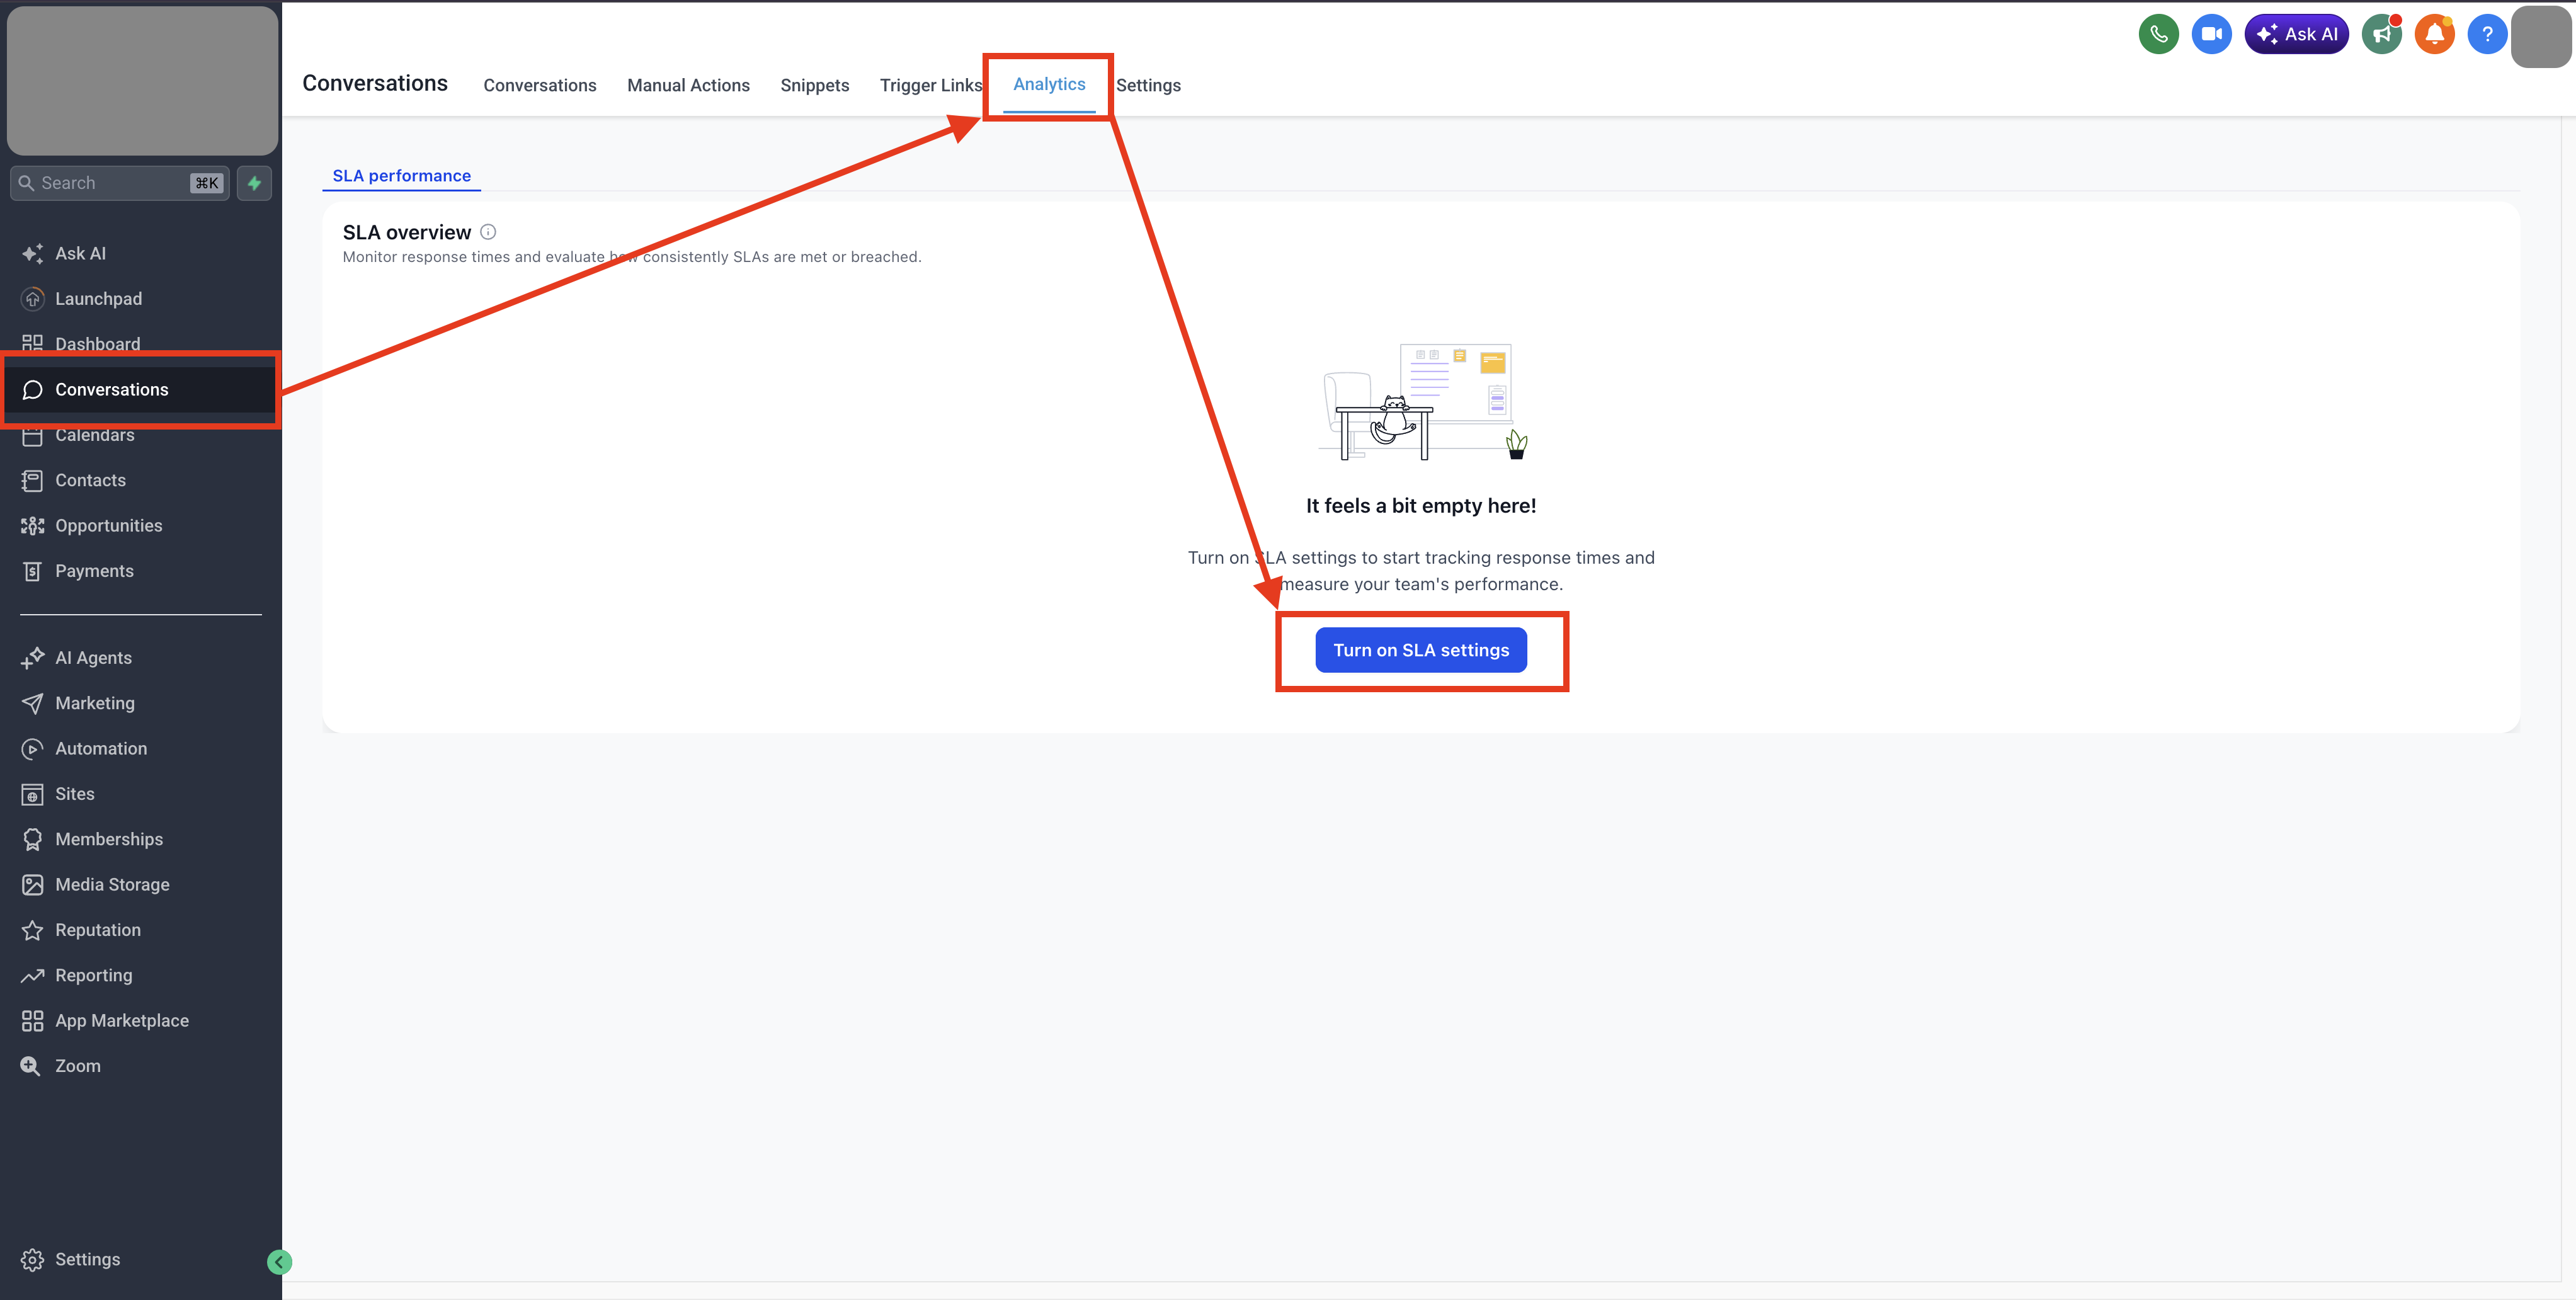
- SLA must be enabled in the subaccount via Conversations > Settings > SLA.
06How to set up and use SLA widgets in HighLevel
Add SLA widgets to a dashboard
- Open the subaccount, go to Dashboards and select the dashboard to edit or create a new one.
- Click Edit Dashboard in the top right corner.
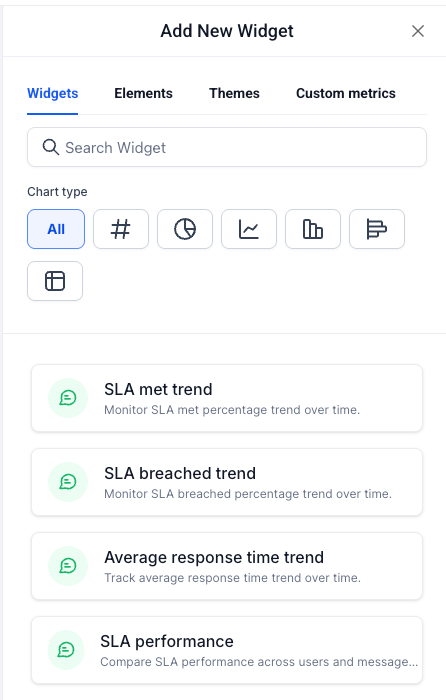
- Press the + Add Widget button to open the widget panel.
- Scroll to the Conversations section; the SLA widgets appear at the bottom.
- Select the desired SLA widget; it is placed on the dashboard canvas.
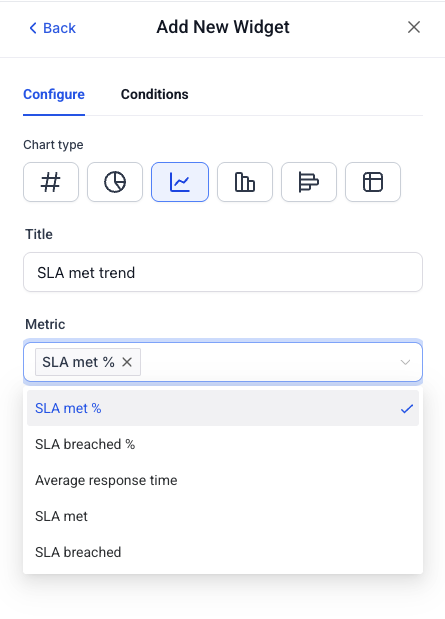
- Adjust the widget using the Configure and Conditions tabs as needed.
- Click Save Changes to publish the widget on the dashboard.
Add SLA widgets to a custom report
- In the subaccount, navigate to Reporting > Custom Reports and open an existing report or start a New Report.
- Choose a blank canvas, a template, or import a dashboard layout.
- Click Add Widget / Element at the top left of the report builder.
- Scroll to the Conversations section and drag the desired SLA widgets into the layout.
- Configure each widget with the Configure and Conditions tabs.
- Click Save to store the report design.
- Select Send or Schedule to set up automatic email delivery of the report.
07What it looks like in HighLevel
08Settings that matter
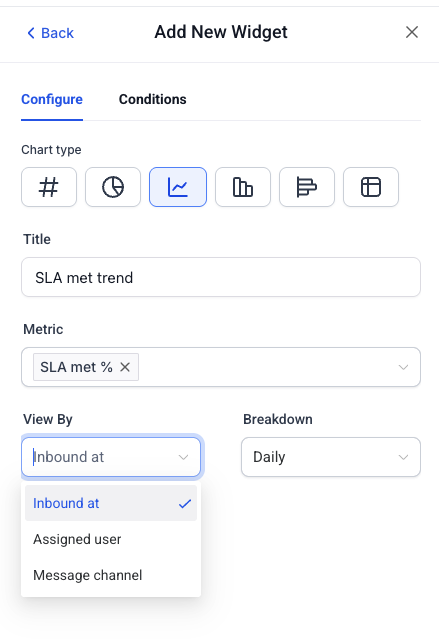
- Chart type. Selects the visual style such as Numeric, Donut, Line, Bar, Horizontal Bar, or Table.
- Title. Sets a custom name that appears above the widget.
- Metric. Chooses the data displayed, like SLA met %, SLA breached %, Average response time, SLA met count, or SLA breached count.
- View By. Determines the primary grouping dimension: Inbound at, Assigned user, or Message channel.
- Breakdown. Defines the time granularity for trend widgets: Daily, Weekly, or Monthly.
- Date range. Sets the period of data shown; defaults to the dashboard date range and cannot exceed one year.
- Assigned user. Filters data to a specific team member or to the logged in user.
- Message channel. Filters data by channel such as Call, SMS, Email, Web chat, Facebook, GMB, or Instagram.
- Theme. Applies a preset or custom color scheme to match the dashboard or client branding.
09Things to know before you rely on it
- Widgets support a maximum date range of one year.
- All widgets use the Dashboard Date Range set at the top of the page.
- If SLA is not enabled, widgets return zero and display no data.
- SLA widgets are available on any plan that includes Dashboards & Reporting.
10If something goes wrong
- SLA widget shows no data. Enable SLA in Conversations > Settings > SLA, ensure the selected date range is within one year, and verify that filters are not overly restrictive.
11How it connects to the rest of HighLevel
- Learn how to add and customize dashboard widgets in HighLevel. Dashboard widgets guide
- Step by step instructions for creating and adding dashboard widgets. Add dashboard widgets
- See which plans include Dashboards & Reporting and SLA widgets. Pricing and plans
Michael's take

SLA widgets give you a quick, visual way to prove you’re keeping response promises. Something every agency needs to show clients without hunting through raw data. I’d drop the met and breached trend widgets side by side on a client dashboard and let the numbers do the talking.
Don’t forget to turn on SLA in the Conversations settings first, or you’ll just see empty charts.