
01Who this is for
- Sales managers who need real time visibility of win rates and revenue trends across their team.
- Marketing analysts who track attribution sources and lost reasons to improve campaign performance.
02Opportunities widgets, explained
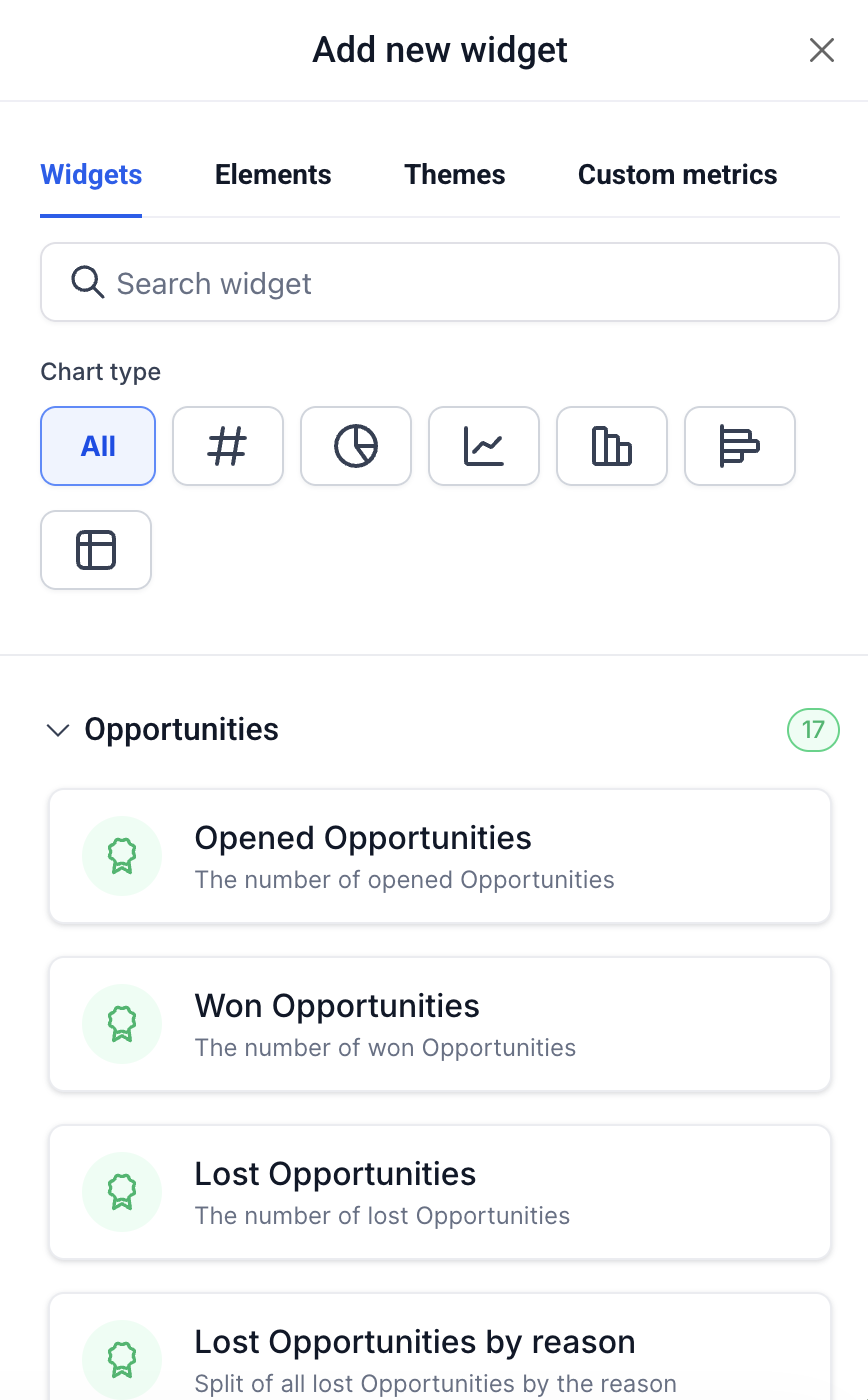
Opportunities Widgets let you visualize pipeline data directly on dashboards or inside scheduled reports. Each of the 17 widgets starts with a default chart but you can swap it for any supported type, Number, Donut, Bar, Line, Horizontal Bar, or Table. The widgets pull data based on a chosen date property such as Created On, Updated On, or Status Change.
You can narrow a widget’s data with Conditions. Standard filters include Status, Assigned User, Pipeline, Stage and more. Attribution filters let you focus on first or latest touchpoints and any UTM parameters. Group By options are available on four widgets, allowing breakdowns by status, assignee, source, pipeline, stage, lost reason, and several attribution fields.
All widgets are accessible from the dashboard editing screen and from the custom report builder. They work with dashboard level Quick Filters and inherit the global date range unless a widget uses a fixed scope like the “This Month” widgets.
03How businesses use opportunities widgets
- SaaS subscription business. Add the Won Opportunity Value widget to a dashboard, set the date property to Created On, and filter by the subscription pipeline. The widget shows total revenue from new sign ups for any selected date range.
- Real estate agency. Place the Lost Opportunities By Reason donut on a custom report, group by Lost Reason, and add a pipeline condition for the sales pipeline. The report reveals why deals fall off, helping agents focus on common objections.
- Digital marketing firm. Use an Opportunities widget with Attribution filters. Choose First Attribution, set Medium to Facebook, and group by Session Source. The dashboard shows how many opportunities originated from Facebook traffic and their current status.
04The numbers and rules that matter
- There are 17 Opportunities Widgets.
- Widgets #15, #16, and #17 use a fixed date scope (This Month).
- Widgets #15 and #17 are "For You" widgets scoped to the logged in user.
- Supported chart types: Number, Donut, Bar, Line, Horizontal Bar, Table.
- Group By is available on widgets #8, #12, #13, and #14.
- 24 condition fields are available, split into standard and attribution fields.
05How to set up and use opportunities widgets in HighLevel
Understand the purpose of Opportunities Widgets
- Read the overview that explains they display pipeline metrics on dashboards and reports.
Select a widget type
- Choose from the 17 available widgets, each with a default chart type.
Change chart type
- In widget settings, switch the default chart to any supported chart type.
Apply Group By when supported
- For widgets #8, #12, #13, and #14, pick a Group By field such as Status, Stage, or Source.
Set the date property
- Select Created On, Updated On, or Status Change to define which timestamp the dashboard date range uses.
Add condition filters
- Open the Conditions panel and add standard or attribution filters to narrow the widget data.
Use standard filters
- Select fields like Status, Assigned User, Pipeline, or Lost Reason and set operators to shape the data.
Use attribution filters
- Choose First Attribution or Latest Attribution, then set Medium, Session Source, and any UTM fields.
Modify fixed date scope if needed
- For widgets #15, #16, and #17, change the default "This Month" scope in Configure when a different period is required.
Place widget on a dashboard or report
- Add the configured widget to a dashboard for monitoring or to a custom report for scheduled delivery.
Check FAQs for common questions
- Review the Frequently Asked Questions to understand date property impacts and For You widget behavior.
06What it looks like in HighLevel
07Settings that matter
- Group By Options. Controls which dimension the widget uses to break down data, such as status or stage.
- Date Properties. Determines which timestamp (Created On, Updated On, or Status Change) the widget compares against the dashboard date range.
- Conditions. Filters applied inside the widget to limit results by fields like pipeline, status, or attribution.
- Standard Filters. Set of predefined fields such as Status, Assigned User, and Lost Reason that can be used in Conditions.
- Attribution Filters. Filters that depend on selecting First or Latest Attribution and then allow filtering by Medium, Session Source, or UTM parameters.
08Things to know before you rely on it
- Widgets 15, 16, and 17 use a fixed "This Month" date scope and do not follow the dashboard's global date range unless changed in Configure.
- For You widgets (15 and 17) automatically filter by the logged in user’s Assigned User value and show the report owner's data when scheduled.
- Status Change date reflects only the most recent status change; reopened opportunities reset this date, which can affect historical counts.
- Group By is only available on widgets #8, #12, #13, and #14.
- Stage can be selected only after a Pipeline is chosen; Lost Reason requires Status = Lost first.
- When using Session Source or Medium in Group By or View By, only one compound filter group is allowed and must include the Attribution Type.
09If something goes wrong
- Won/Lost numbers change when reviewing past months. Switch the date property to Created On and filter by Status instead of using Status Change.
- Cannot filter by Stage without selecting a Pipeline. Select a Pipeline first; the Stage field becomes available after the pipeline is chosen.
10How it connects to the rest of HighLevel
- Read how to add and customize dashboard widgets in HighLevel. Dashboard widgets guide
- Learn how to embed external content on a HighLevel dashboard. Embed external content
- Explore HighLevel dashboard permissions and user specific widget settings. Dashboard permissions FAQ
Michael's take

Most people assume the default date range will always give a stable picture of their pipeline, but the Status Change date can move retroactively when a deal is reopened. I prefer to lock the date property to Created On and then filter by the status I need, so my month overmonth reports stay consistent.
If I were setting up a new dashboard, I would start with the Opportunity Revenue Over Time widget, switch it to a line chart, and group by Source. That shows which channels are delivering revenue and lets me spot trends before I build deeper breakdowns.