
01Who this is for
- Founders who want a single view of how each chat widget contributes to lead generation.
- Marketing teams that need to spot where visitors stop interacting with the widget.
- Customer support managers looking to gauge visitor satisfaction from chat feedback.
02Chat widget analytics, explained
Insights lives in the Chat Widget section under Sites. It pulls event data already gathered by each widget and presents it as a conversion funnel, headline KPI cards, a widget by widget table, and charts for engagement and sentiment. The dashboard updates according to the date range and widget filters you select.
When you open Insights you can pick a reporting period, include specific widgets, and then explore the funnel that shows loads, opens and leads. Below the funnel you can sort and filter the performance table, drill into any metric to see the underlying contact records, and switch chart visualizations to see trends over time.
03How businesses use insights
- Dental practice. The practice opens Insights, selects the widget used on its appointment page, and reviews the conversion funnel to see how many visitors schedule appointments after opening the chat. It sorts the widget table by leads generated to identify which location’s widget performs best.
- Online retailer. The retailer filters Insights to the widget on the product pages, examines daily loaded & opened trend charts, and switches to the Stacked view to compare open versus not opened activity throughout a promotion period.
- Service based agency. The agency picks the widget linked to its contact form, checks the Customer sentiment chart to monitor satisfaction scores, and clicks a positive feedback count to open the record drawer and see the contacts who left the feedback.
04The numbers and rules that matter
- Widget performance table includes columns: Widget, Chat type, Loaded, Opened, Open rate, Leads generated, Positive, Negative, Satisfaction.
05Before you start
- You must be logged into a HighLevel subaccount and have at least one chat widget created.
06How to set up and use insights in HighLevel
Access insights dashboard
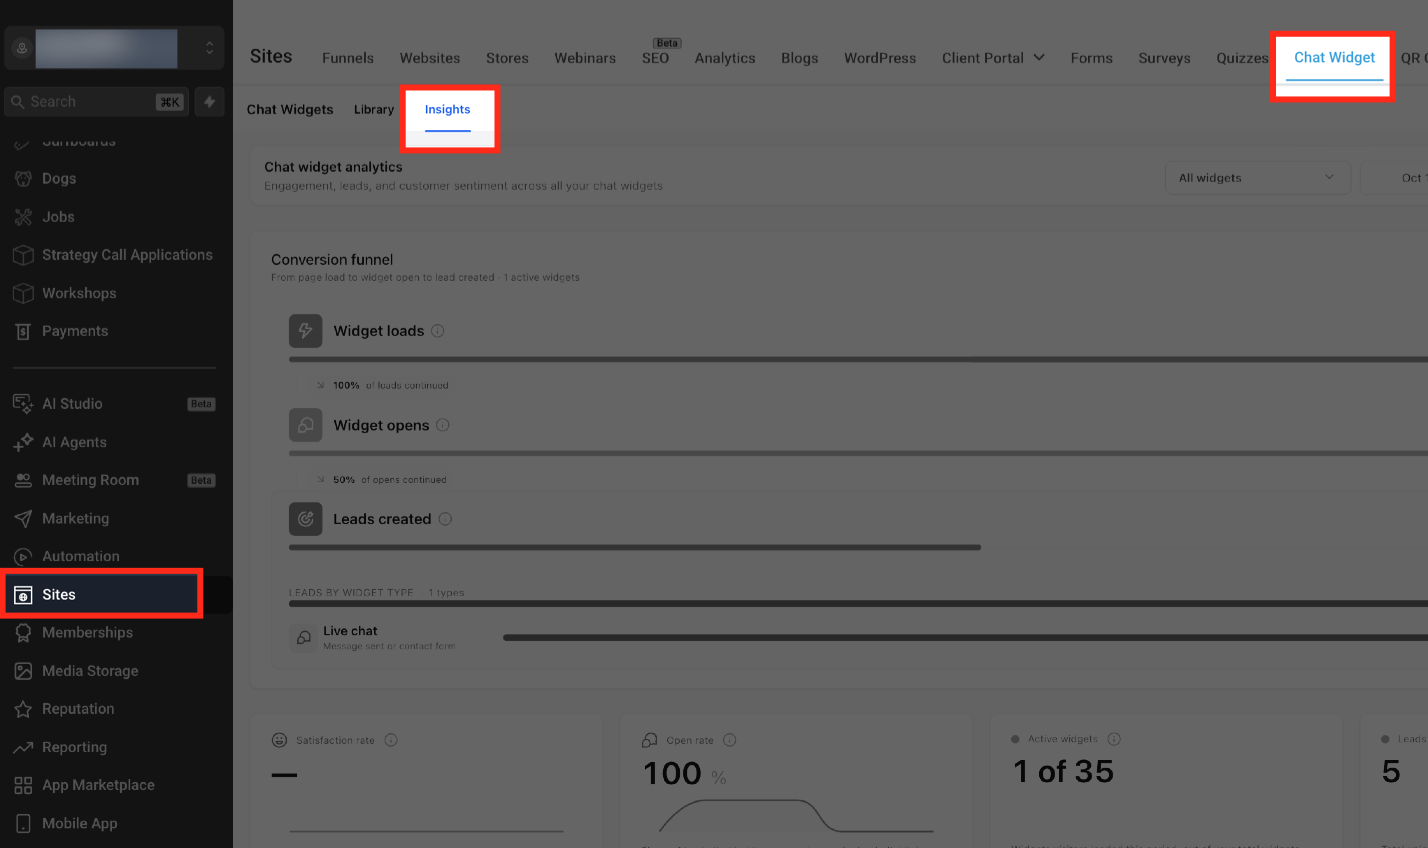
- From your HighLevel subaccount view, select Sites.
- In the Sites navigation, choose Chat Widget.
- Select the Insights tab to open the analytics dashboard.
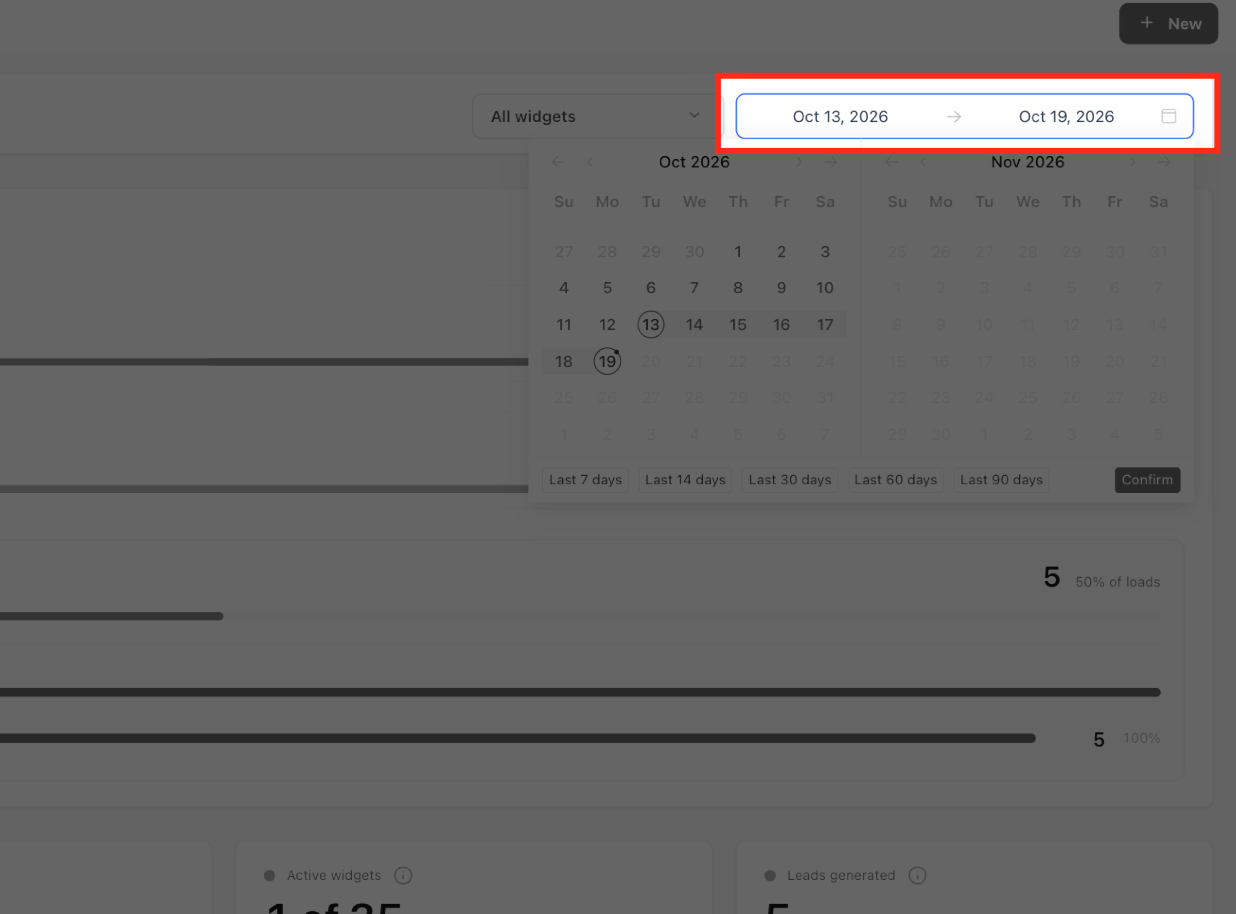
- In the upper right corner, open the date range picker and choose the period you want to analyze.
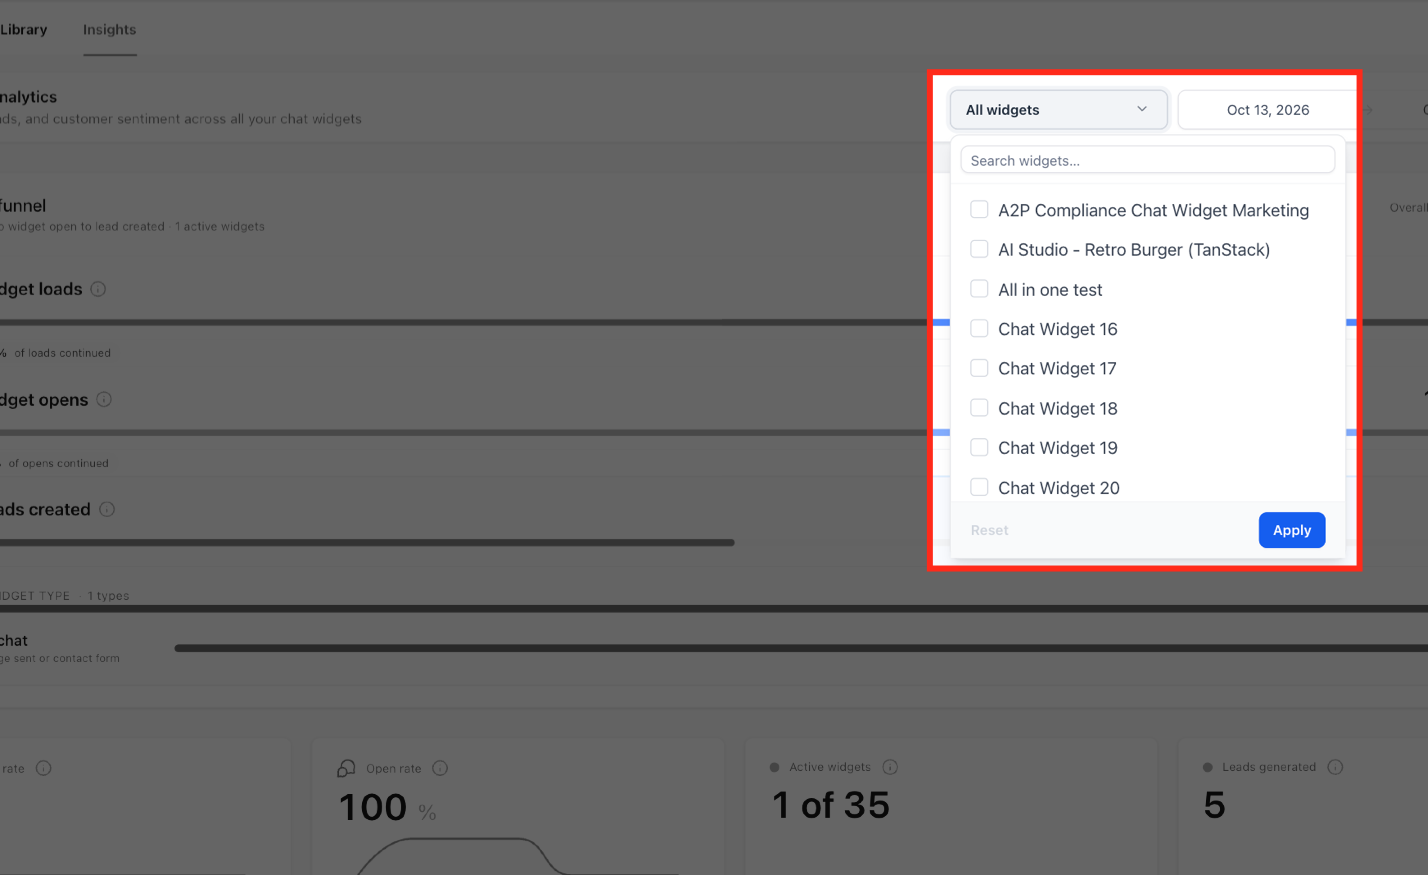
- Use the All widgets dropdown near the date range picker to pick the widgets you want included.
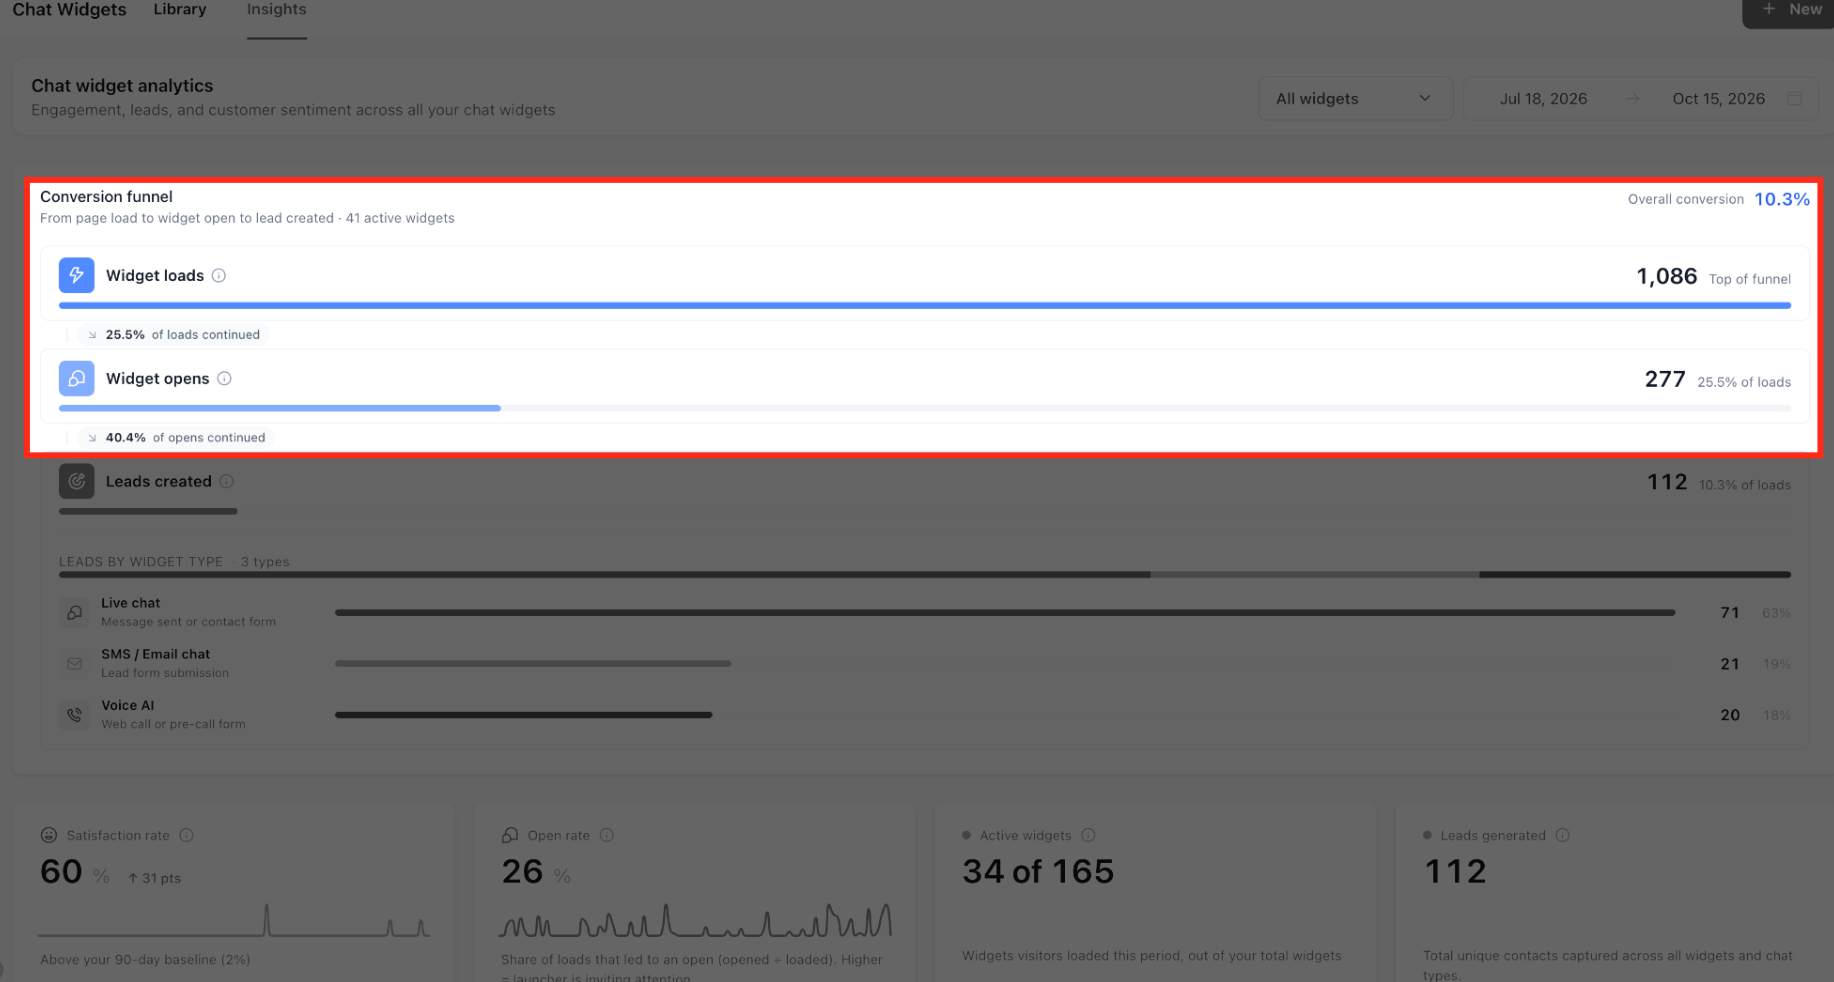
- Review the conversion funnel and the four headline KPI cards for open rate, active widgets, leads generated and satisfaction rate.
07What it looks like in HighLevel
08Settings that matter
- date, range picker. lets you define the start and end dates for the analytics data shown on the dashboard.
- All widgets dropdown. controls which chat widgets are included in the reports; you can select one, many, or all widgets.
- Filter widgets by name. field. filters the widget performance table to display only rows matching the entered widget name.
- column heading. clicking a column heading sorts the widget table by that metric, such as loaded count or leads generated.
- metric value (e.g., Leads generated number). selecting a numeric metric opens a drawer that shows the individual contact records behind that total.
- Daily loaded & opened trend chart view selector. switches the chart between Stacked, Paired or Drop off visualizations.
- Daily feedback trend chart view selector. changes the sentiment chart between Stacked, Paired or Net display modes.
09How it connects to the rest of HighLevel
- Set up a chat widget on your website first. Chat widget setup
- Learn how to customize the widget appearance. Widget customization
- Install the live chat widget and automate assignments. Live chat install
Michael's take

I would start with the date range picker to set the reporting period, which determines the data shown in the funnel and KPI cards.
After setting the date range, I would glance at the conversion funnel to see where the biggest drop off occurs and then examine the widget performance table to compare open rates.