
01Who this is for
- Marketing managers can see exactly where prospects stop watching, helping them improve calls to action.
- Event coordinators can compare registration counts to actual attendance to adjust promotion strategies.
- Content creators gain insight into which webinar topics retain viewers across a series.
02Webinar video analytics, explained
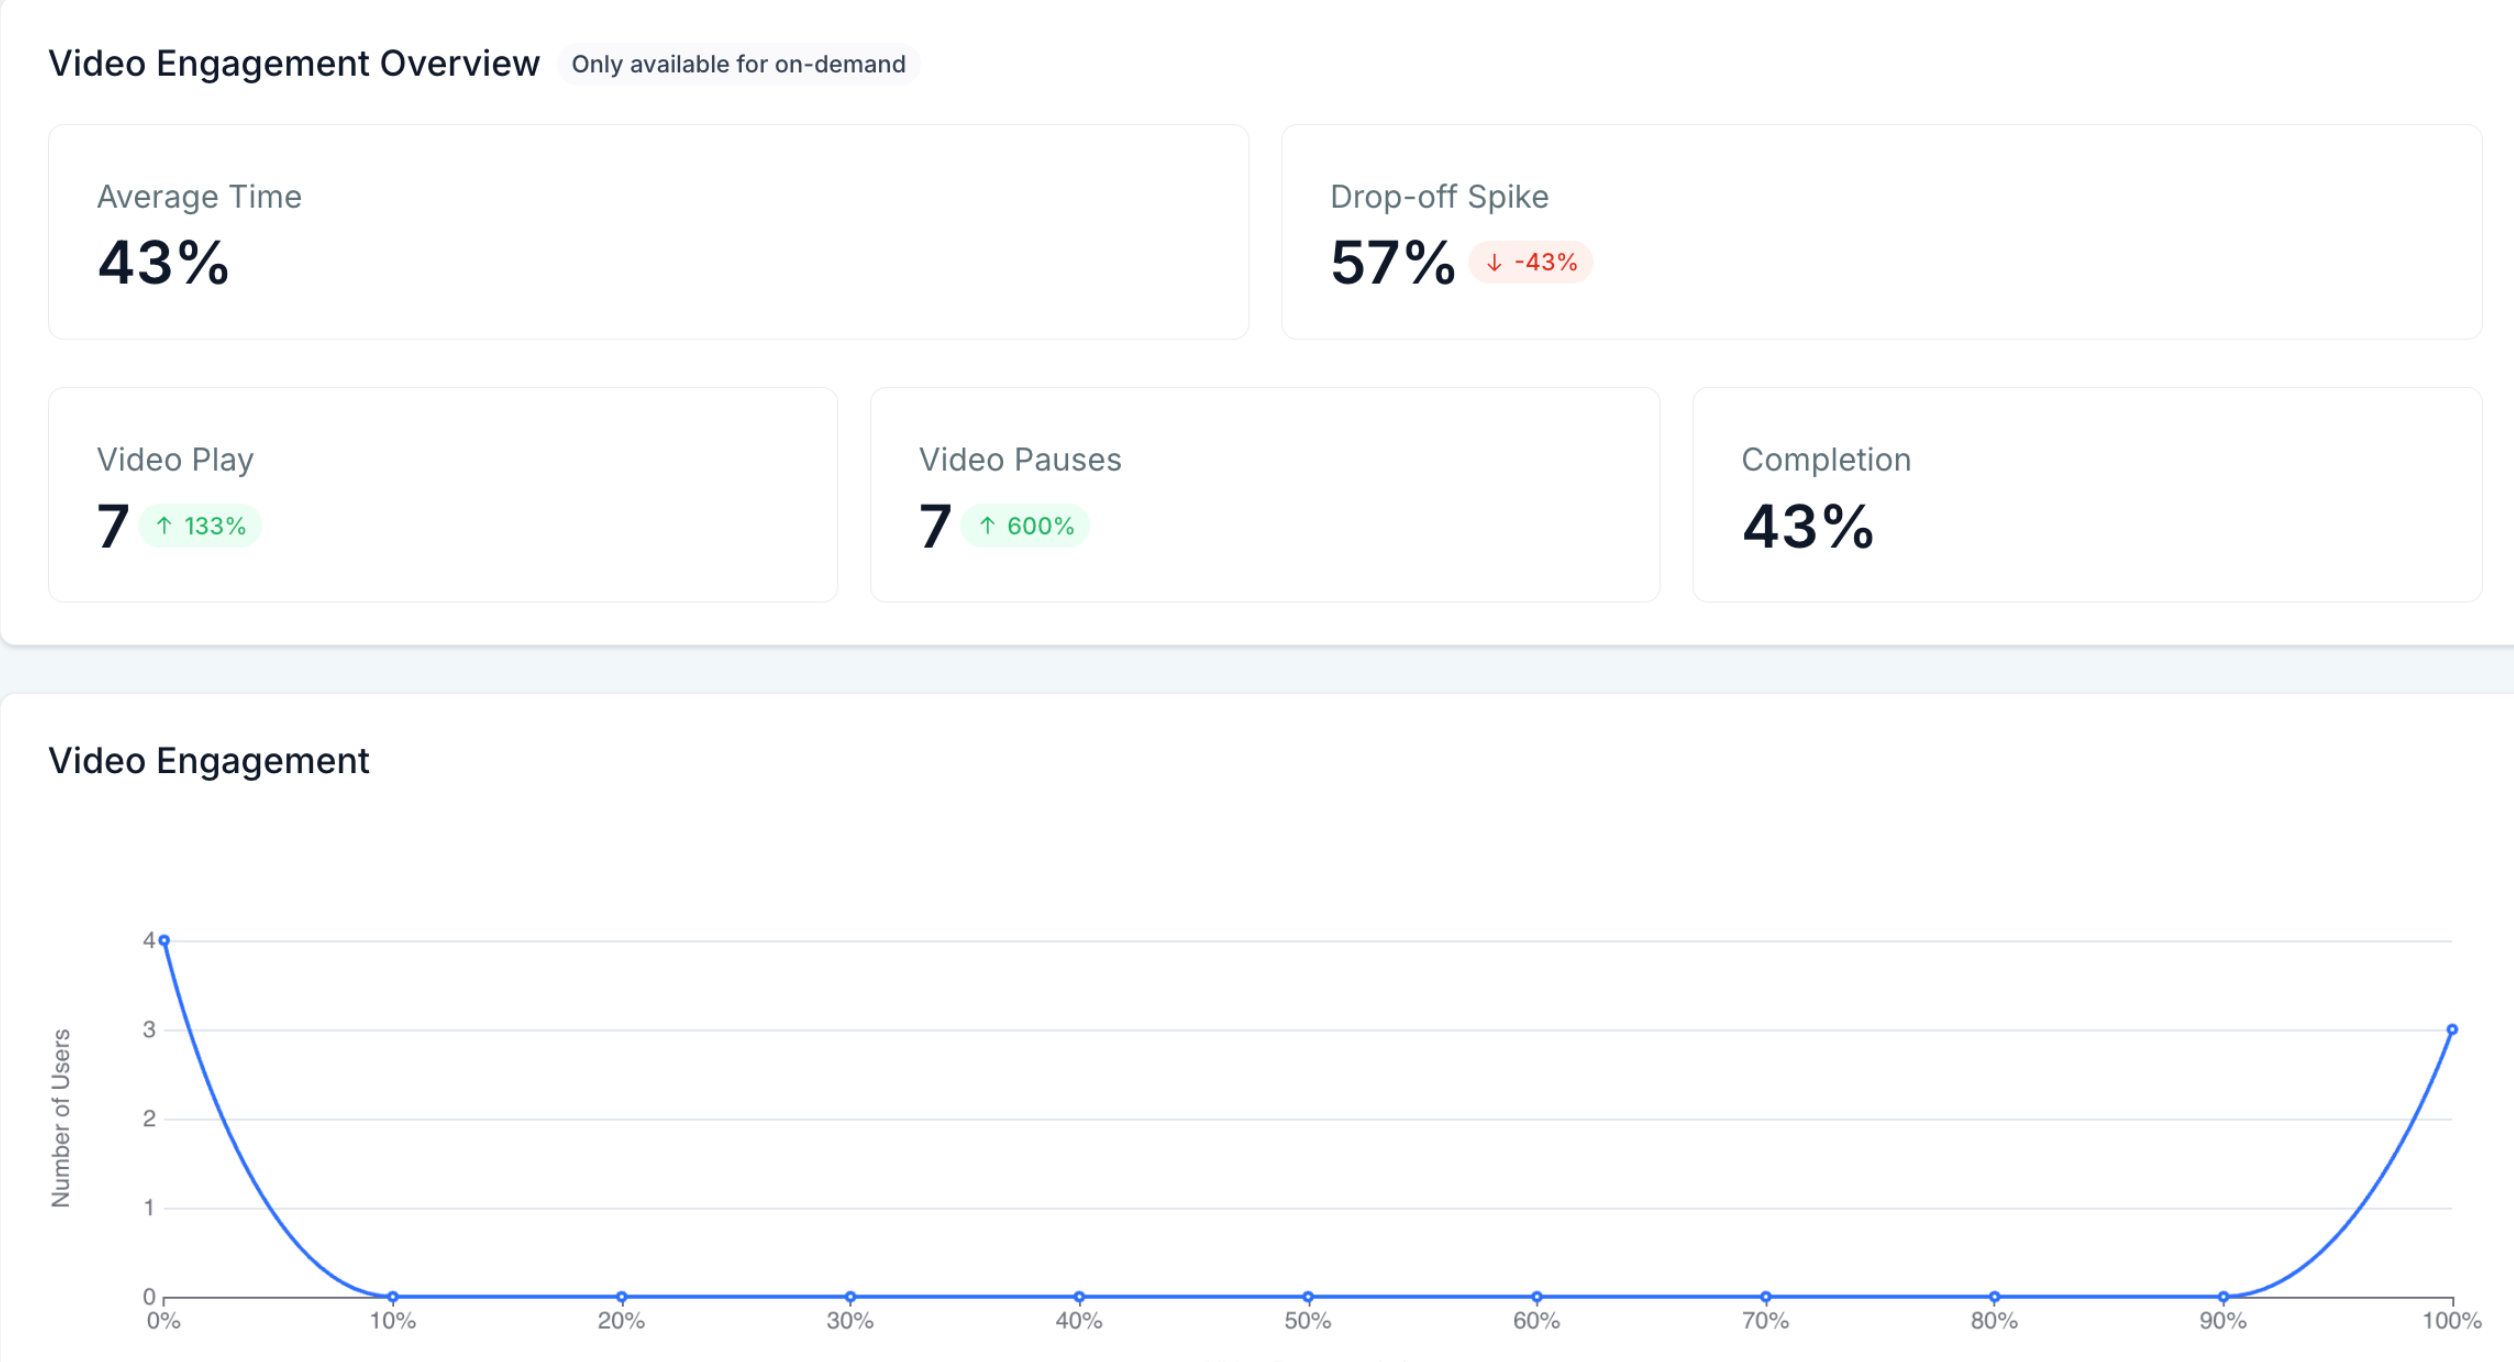
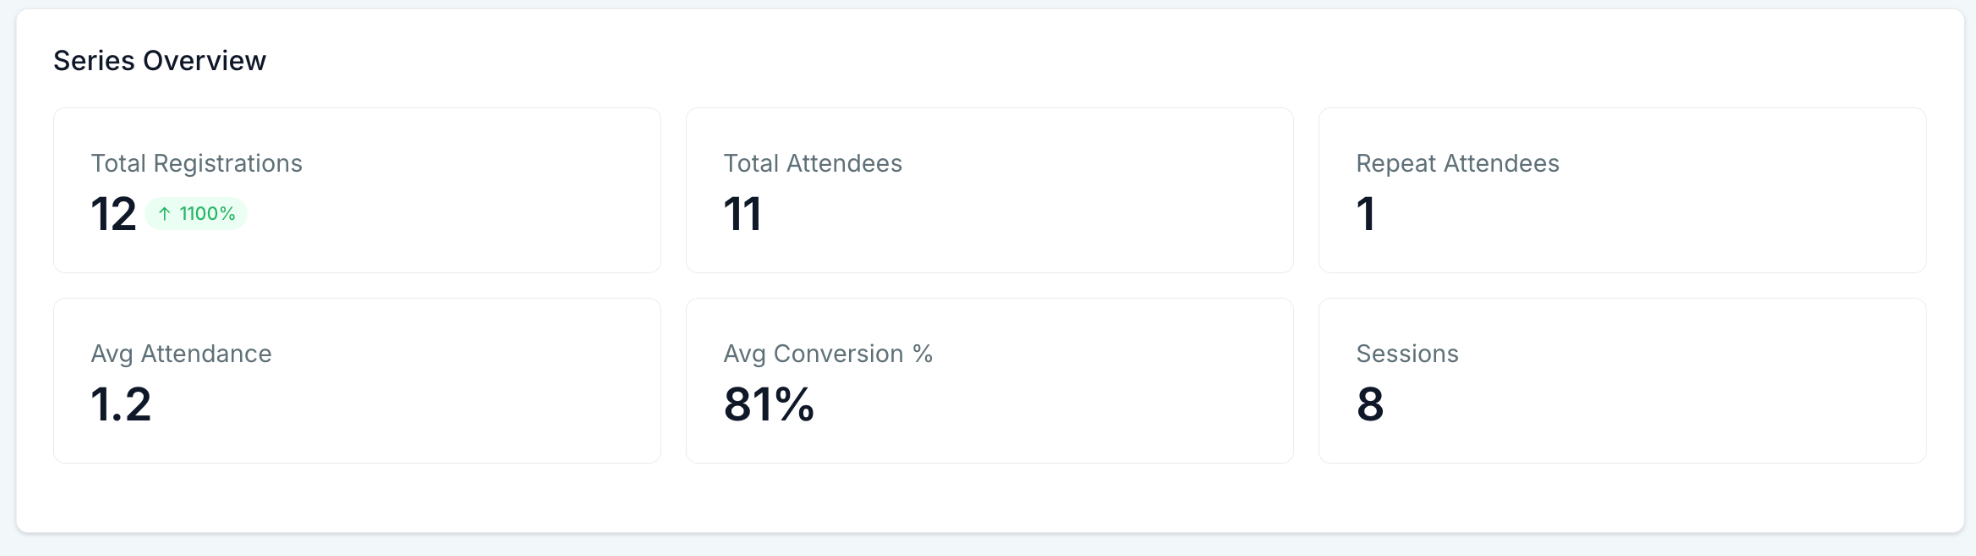
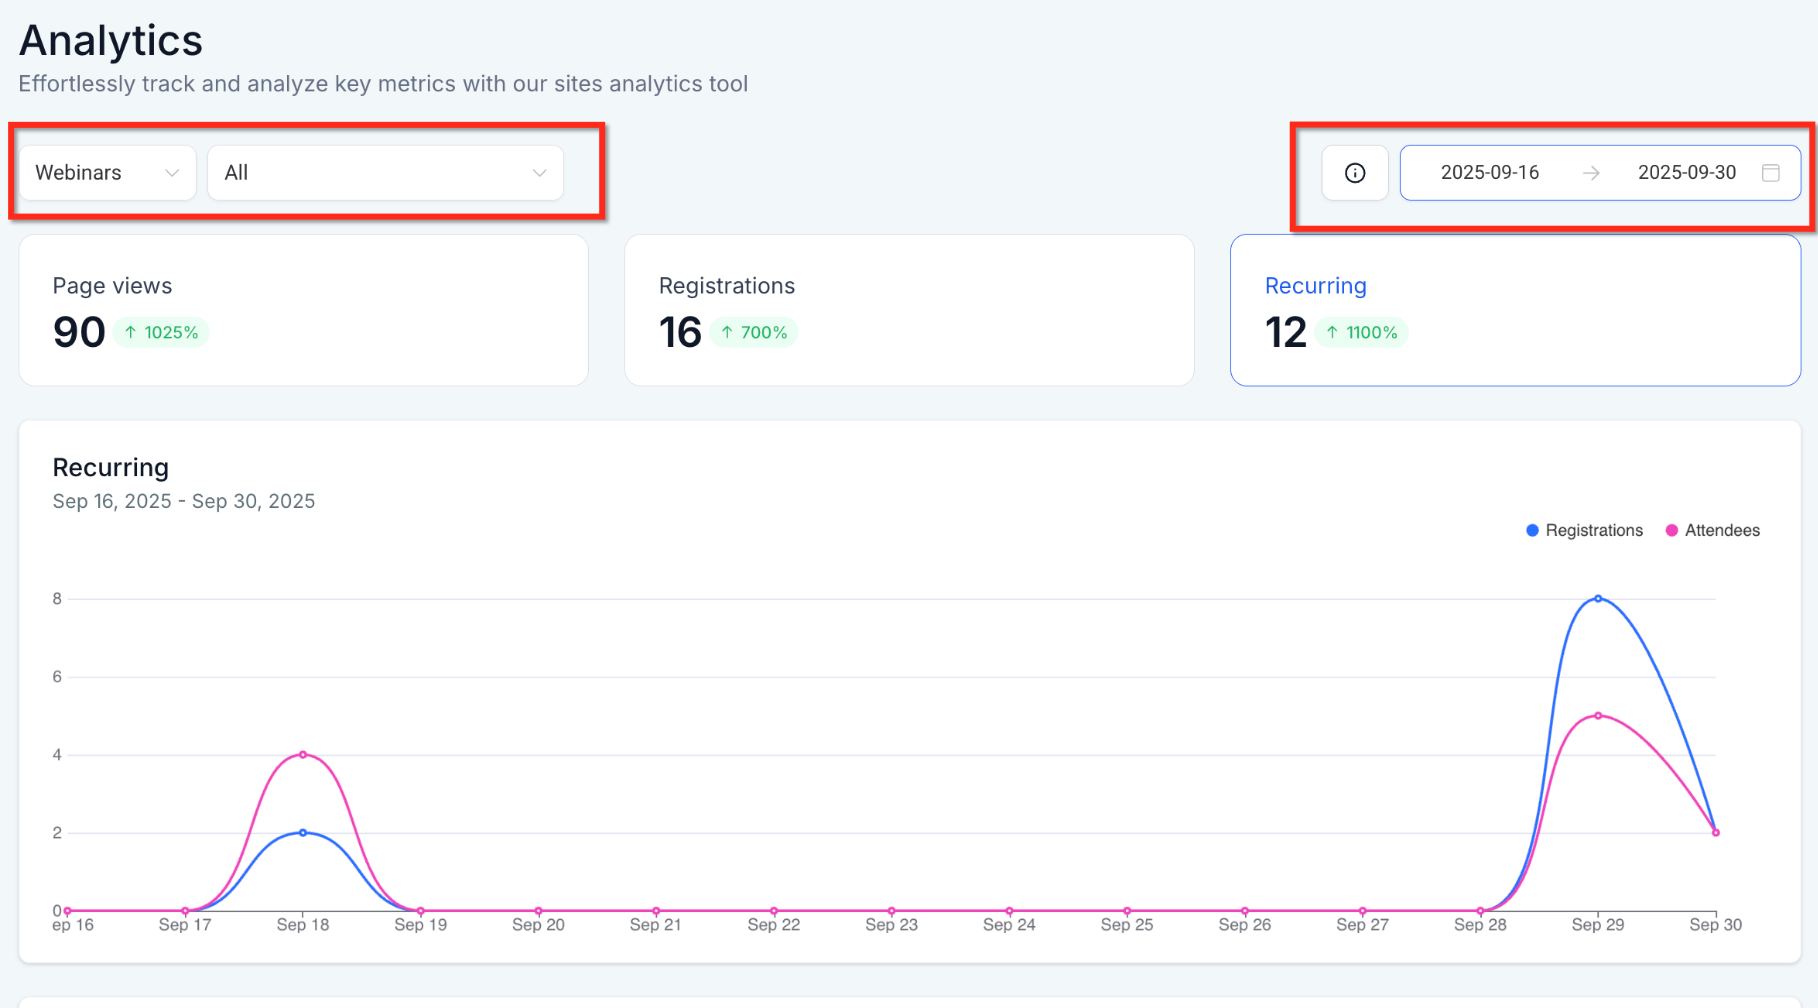
The feature creates a new dashboard inside Sites > Analytics > Webinars. Each webinar type, live, on demand, recurring, has its own tab with time based graphs and metric widgets. The widgets display totals, averages, and percentages for plays, pauses, completions, registrations, and repeat attendance.
Data is captured automatically when a webinar is published. The platform records every play, pause, and exit event and links the activity to contact records. Users can hover over graph points for precise numbers and apply quick filters for device, location, or UTM source without changing the underlying widget.
The analytics live under the Sites section of HighLevel, alongside other site performance reports. Users access them through the navigation path Sites > Analytics > Webinars, then select the appropriate format tab and date range.
03How businesses use webinar video analytics
- Coaching business. The coach creates a series of recurring webinars and views the Series Overview to see repeat attendee counts. This informs which topics attract loyal clients and how often to schedule new sessions.
- Software SaaS company. The SaaS team runs a live product demo webinar and checks the Total Registrations vs. Total Attendees widget to spot no show gaps. They then adjust reminder email timing based on the peak live viewers graph.
- Online education platform. The platform publishes on demand training videos and monitors the Drop off Analysis widget to identify the exact timestamp where most viewers leave, allowing them to place stronger calls to action before that point.
04The numbers and rules that matter
- Live webinar data populates in near real time; final counts and completion percentages are fully processed within 10, 15 minutes after the session ends.
05Before you start
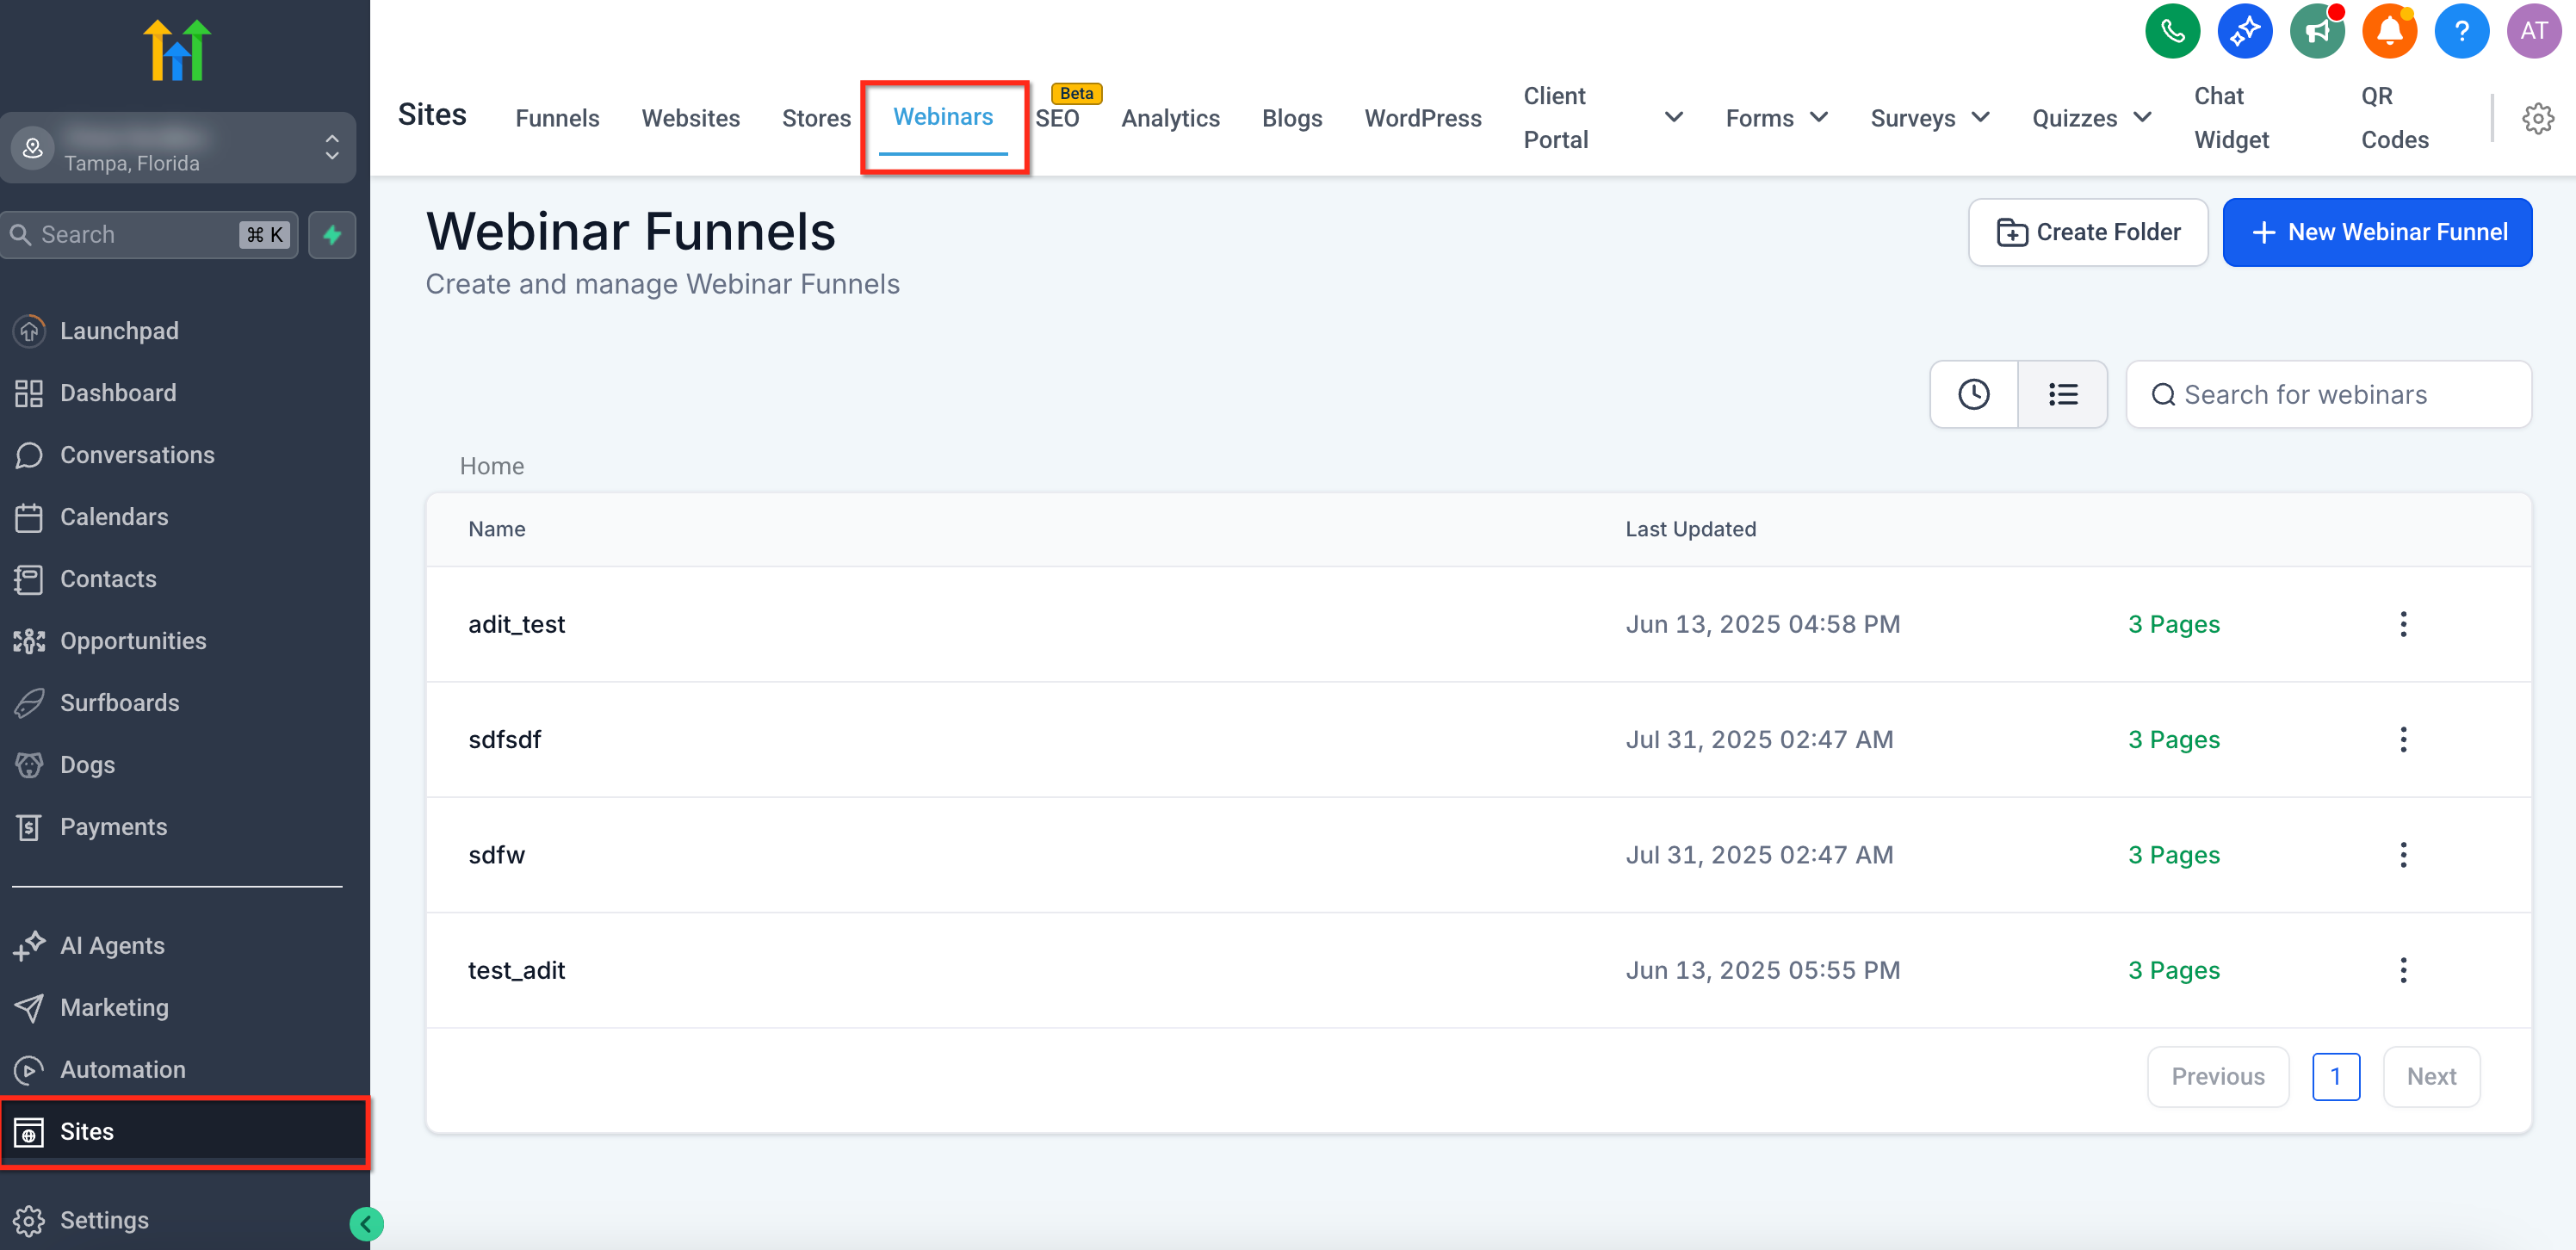
- Create or import the webinar under Sites > Webinars.
- Publish the registration page and ensure the form adds contacts to HighLevel.
06How to set up and use webinar video analytics in HighLevel
set up webinar video analytics
- Create or import the webinar (live, on demand, or recurring) via Sites > Webinars.
- Publish the registration page and verify that the form adds entries to Contacts.
- Run the live session or release the on demand video so the platform can start tracking activity.
- Open the analytics view by navigating to Sites > Analytics > Webinars.
- Select the appropriate tab, On Demand, Live, or Recurring, and set the desired date range using the filter in the upper right corner.
- Hover over any point on a graph to see the exact count and percentage for that moment.
- Apply Quick Filters such as device or location to narrow the data without changing the widget itself.
07What it looks like in HighLevel
08Settings that matter
- Quick Filters. Allows you to narrow the displayed analytics by criteria like device type, location, or UTM source while keeping the original widget intact.
- Video Tracking workflow trigger. Enables automation to fire when a contact reaches a specified watch percentage of a webinar video.
09Things to know before you rely on it
- Live webinar metrics appear in near real time; final counts and completion percentages are fully processed within 10 to 15 minutes after the session ends.
- Export options are limited to CSV or PDF files accessed through the three dot menu on each widget.
10How it connects to the rest of HighLevel
- Configure recurring webinar details Recurring Webinar Settings
- Set up pages, design, and domain for webinars HighLevel website setup
- Review plan eligibility and pricing for webinar features HighLevel pricing and plans
- Start a free trial to test analytics 30 day trial
- Learn about Founder level access for advanced reporting Founder Plan
Michael's take

Getting stuck on why a webinar that seemed popular in the promotion stage isn’t converting can be frustrating. The first thing I would get right is making sure the registration form is linked to Contacts so every view ties back to a record. Without that link the drop off data and repeat attendee counts lose their context.
Once the connection is solid, I’d watch the live and on demand dashboards side by side to see where viewers quit and which topics keep them coming back. That visual cue can help decide if a call to action or session timing needs adjustment.