
01Who this is for
- Content marketers who need a unified view of blog traffic to refine their editorial plans.
- Small business owners wanting to see which articles draw the most engagement from their audience.
- Agency Founders overseeing multiple client blogs and requiring quick performance comparisons.
02Blog analytics, explained
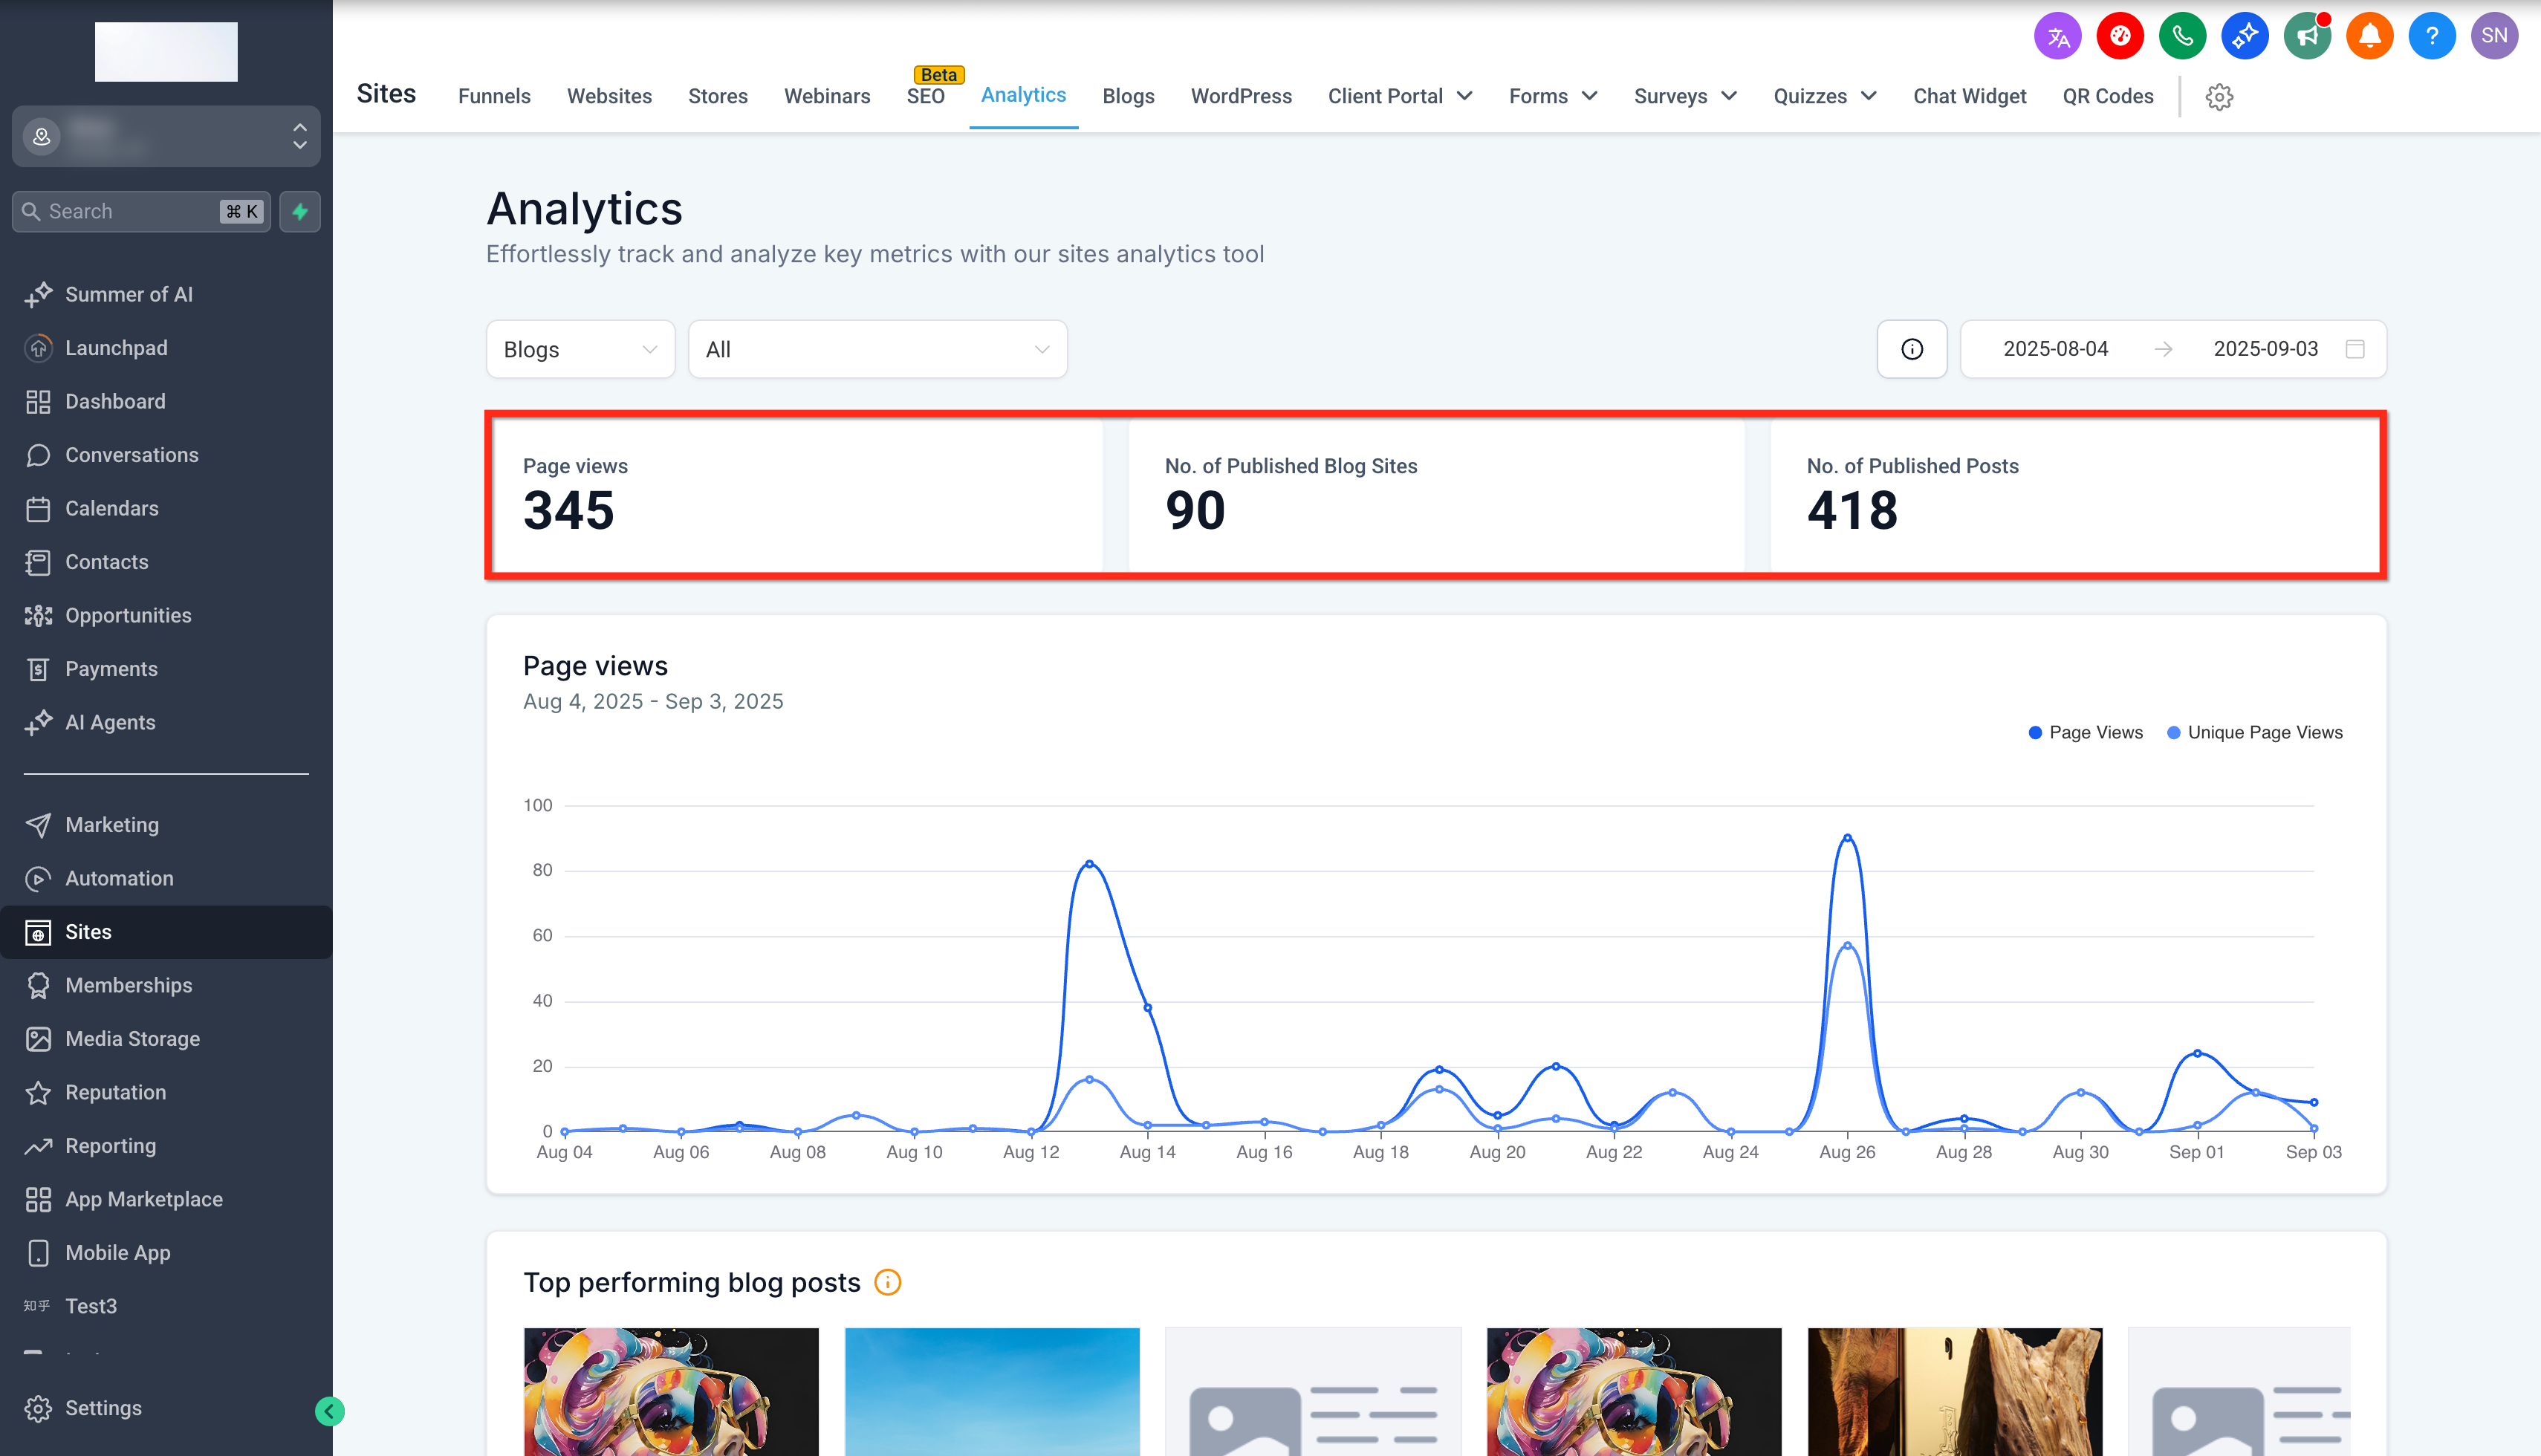
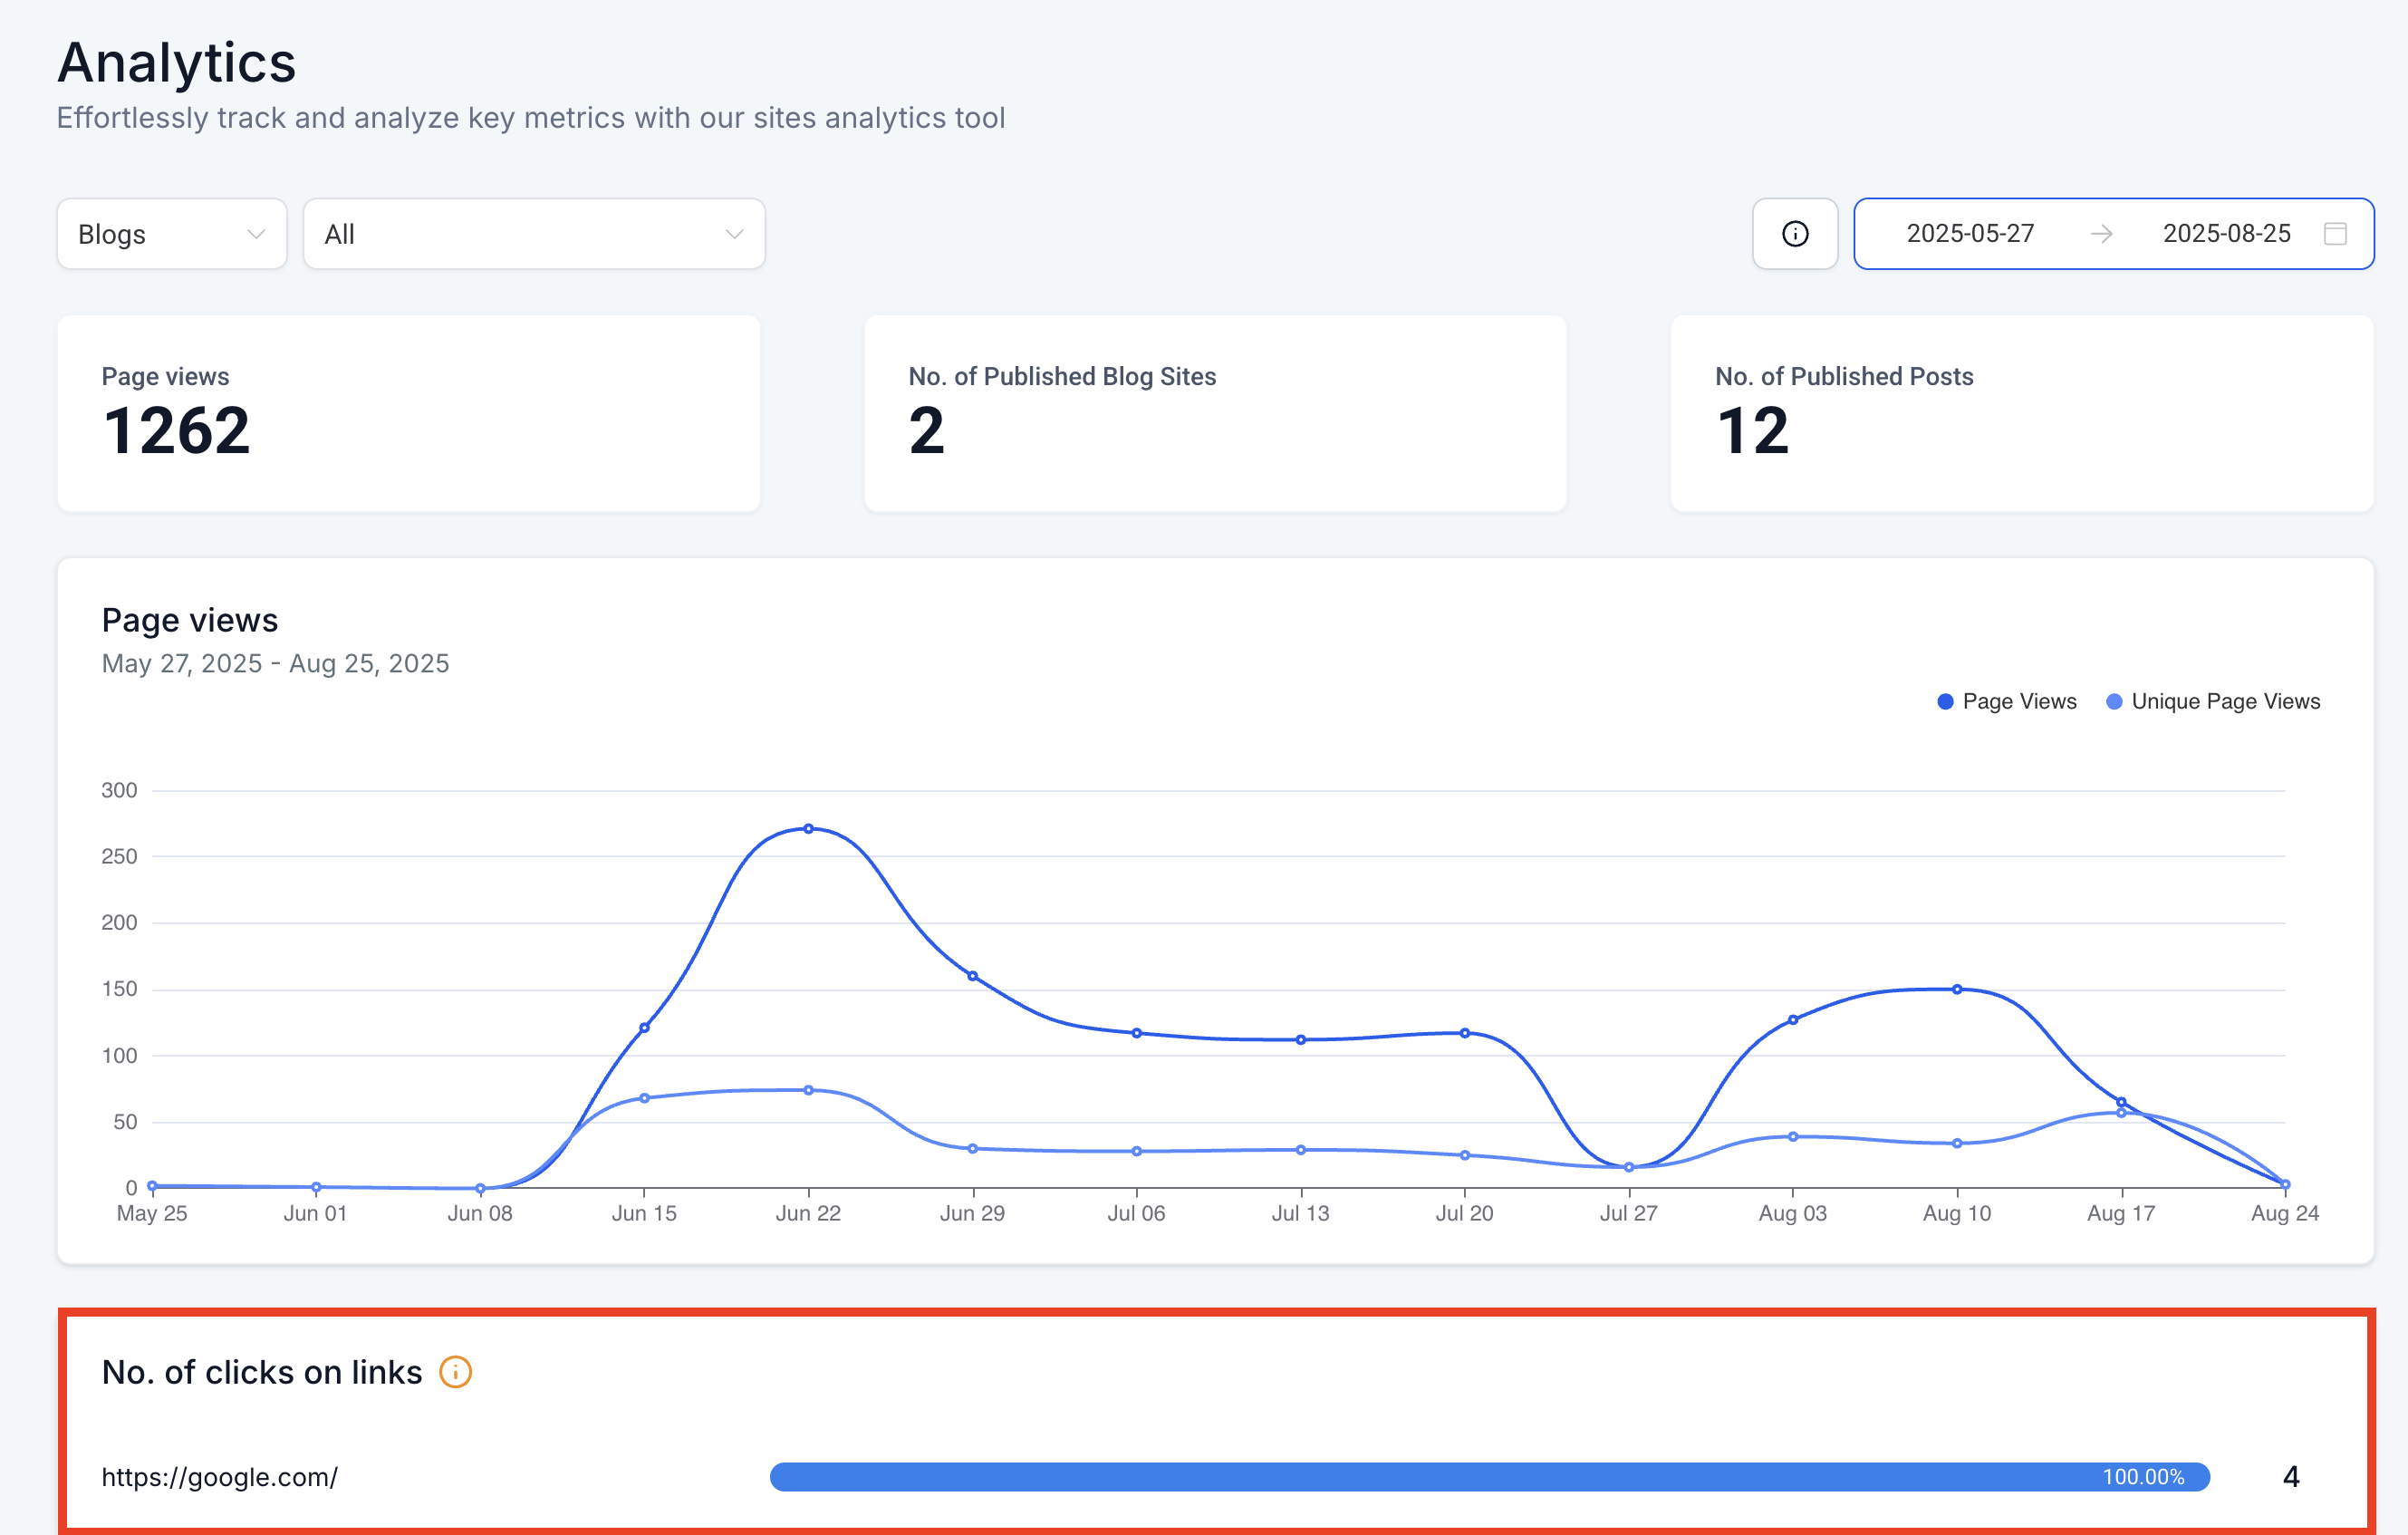
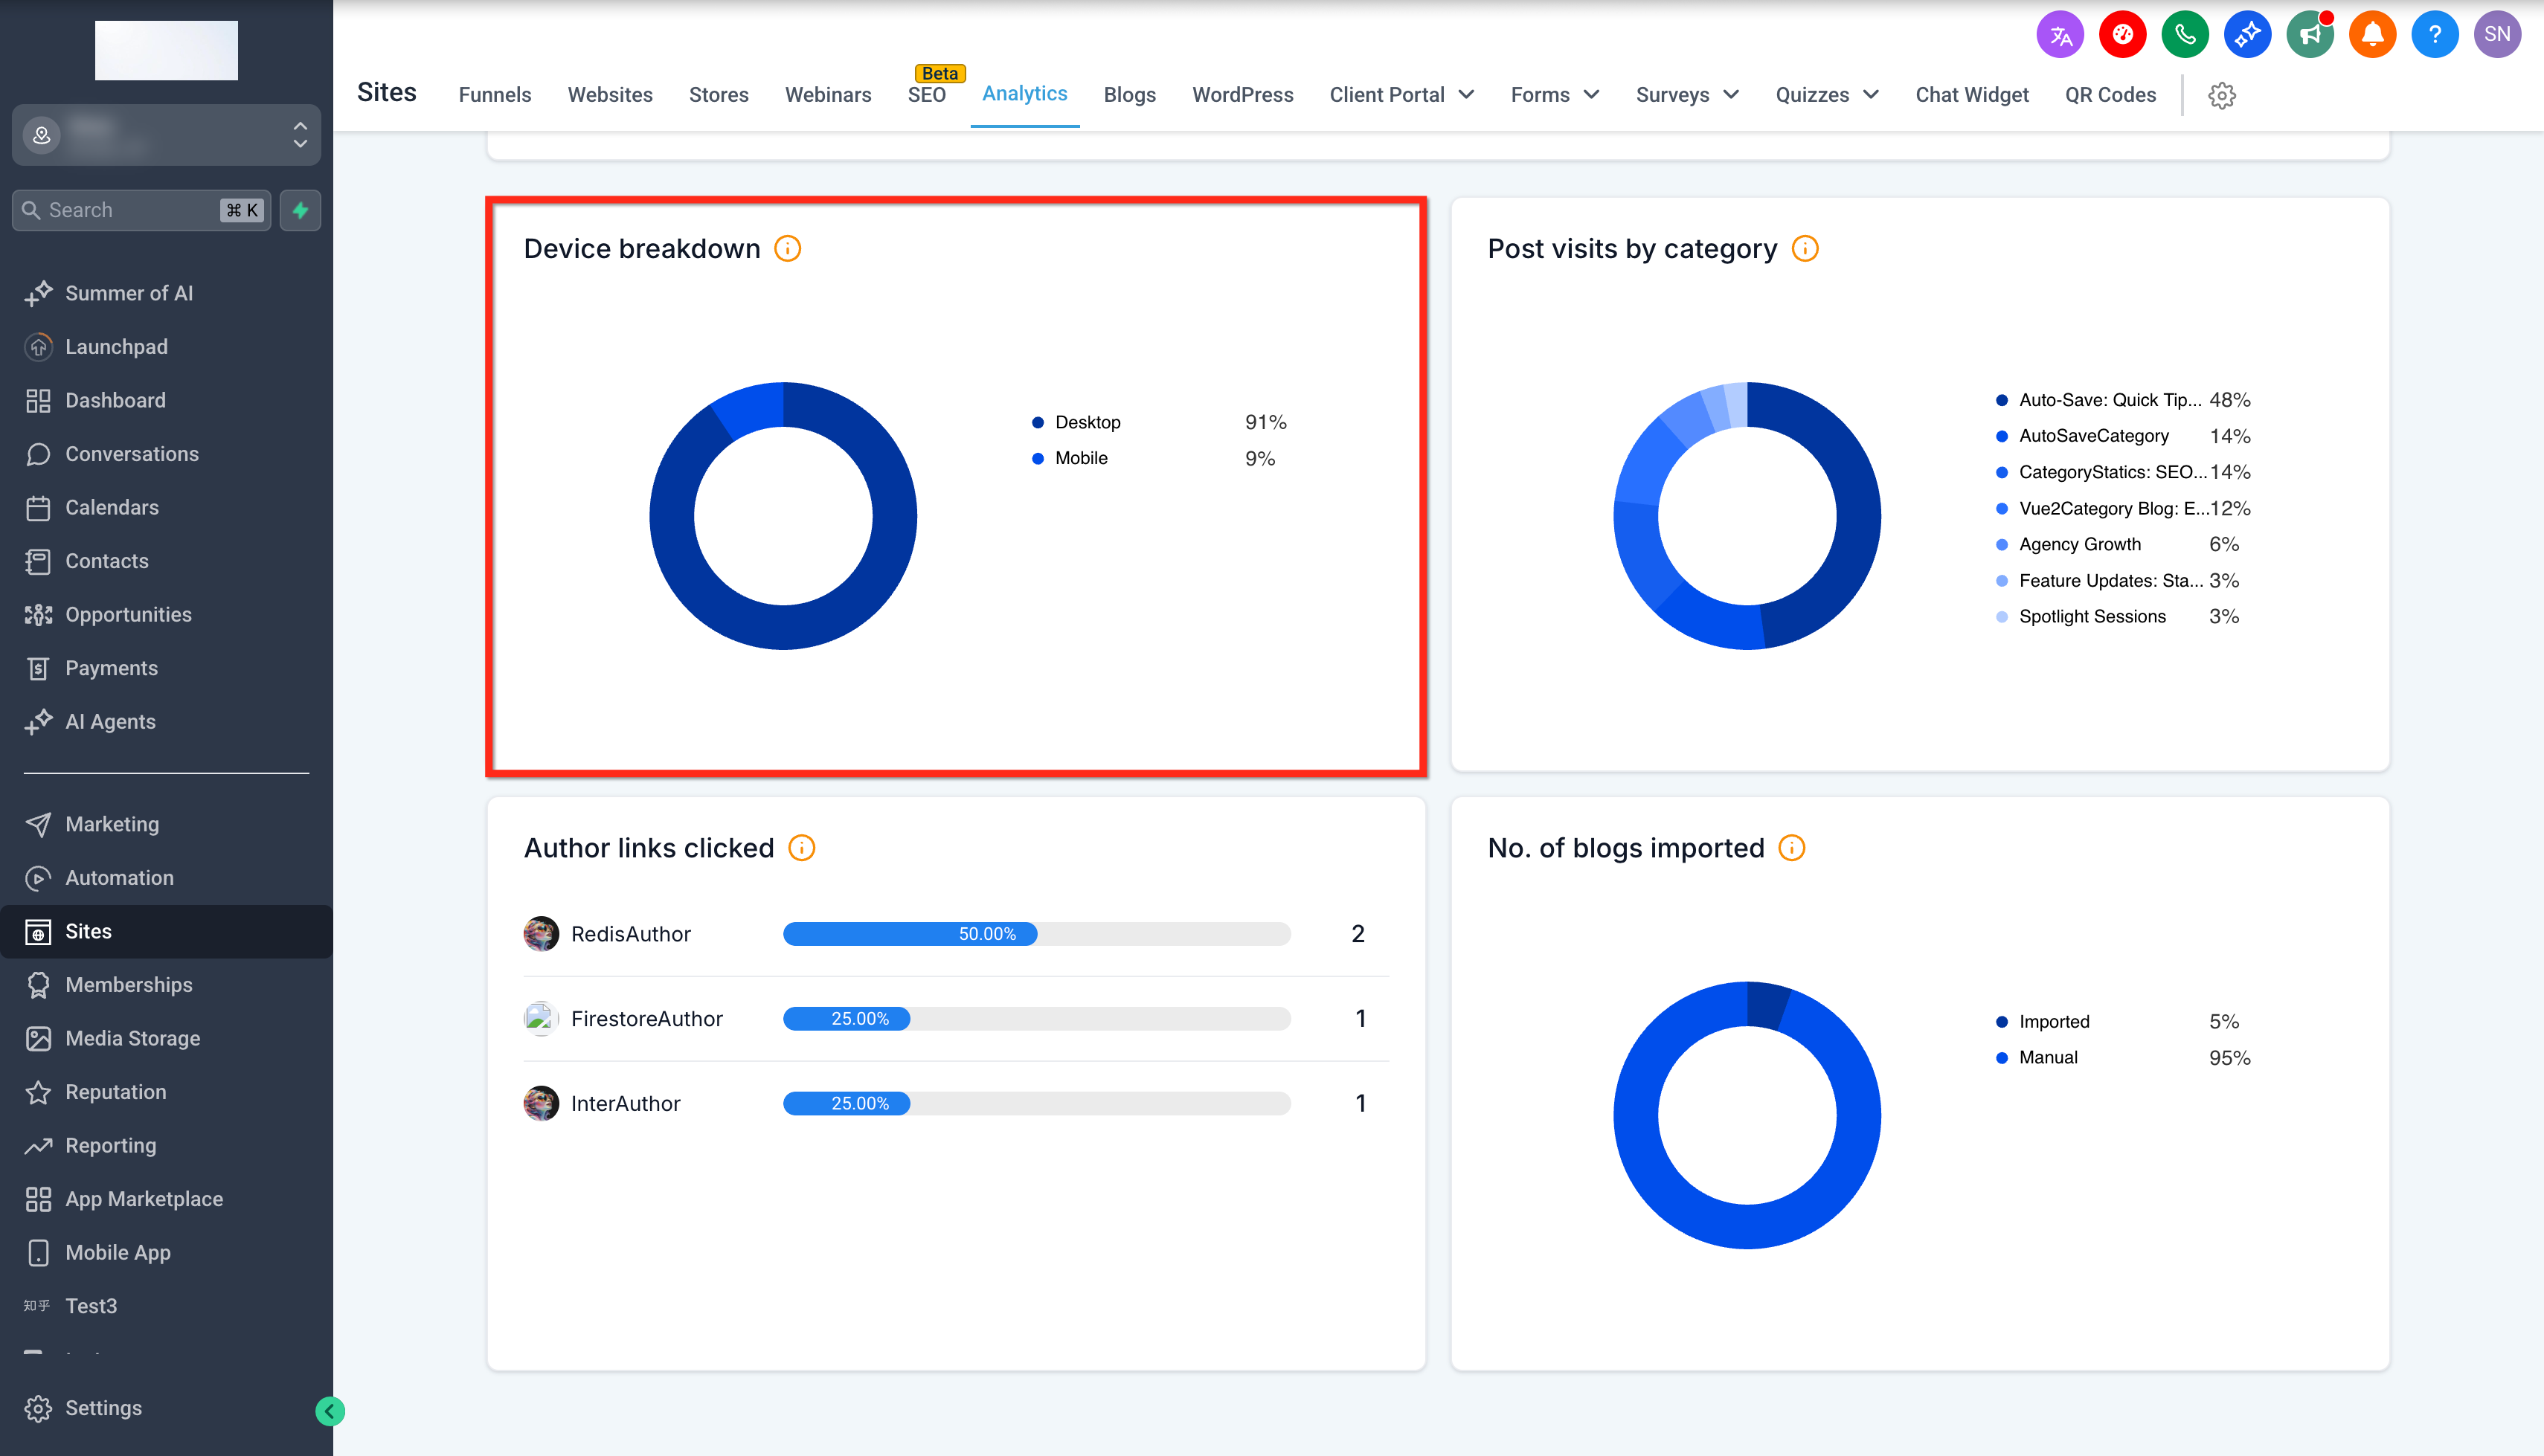
Blog Analytics is an integrated reporting tool inside HighLevel that gathers data on page views, link clicks, device types, categories, authors and content source (imported versus manual). It lives under the Sites section, then Analytics, where you select the Blogs category to reveal the dashboard.
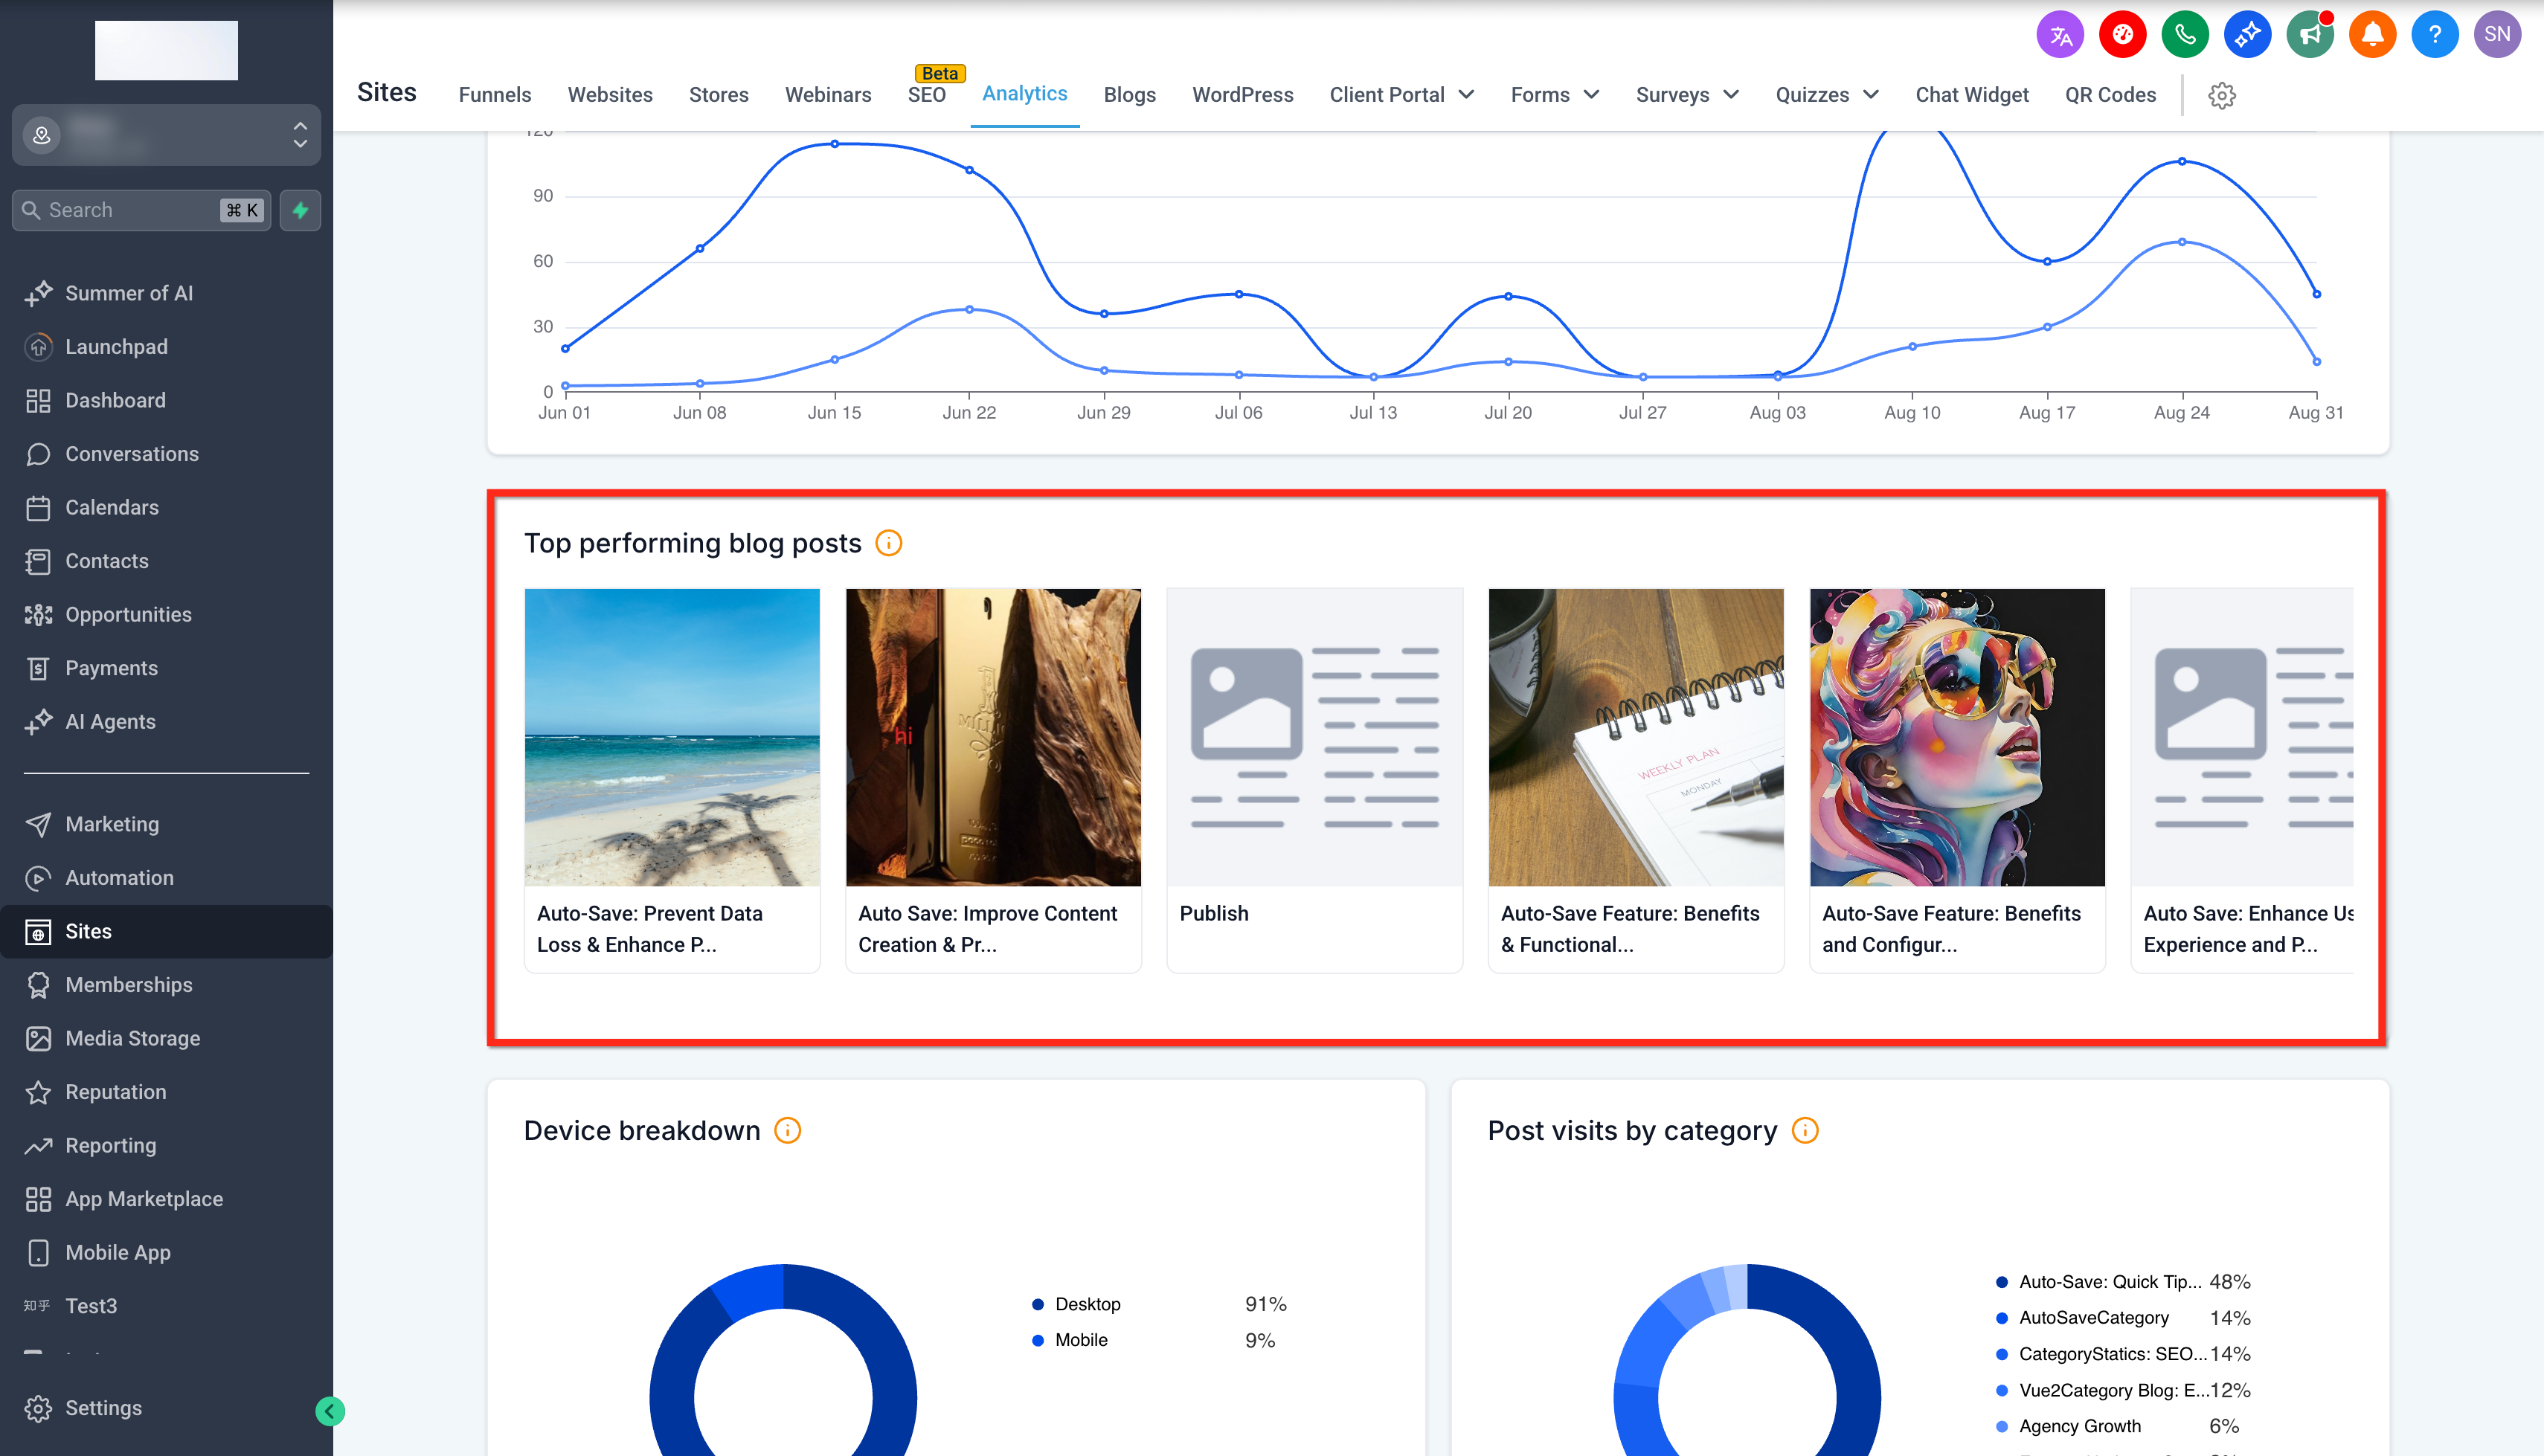
The dashboard offers several visual sections: a Quick Performance Overview with total views and counts, Trends Over Time graphs, Top Performing Posts thumbnails, Number of Link Clicks, Device Breakdown, Post Visits by Category, Author Links Clicked and Import vs Manual Tracking. Date range and blog site selectors let you narrow the view to specific periods or sites.
03How businesses use blog analytics
- Real estate agency blog. The agency opens Blog Analytics, selects its blog site, and reviews the Top Performing Posts and Device Breakdown. This helps it identify which property listing articles attract the most readers and whether most traffic comes from mobile devices, guiding future post topics and design choices.
- Fitness trainer studio. The studio accesses the Number of Link Clicks section to see how many clicks each class signup link receives within its posts. By comparing click counts, it can gauge which calls to action are most effective and adjust future content accordingly.
- Software SaaS startup. The startup looks at the Import vs Manual Tracking chart to compare traffic for imported industry articles against its own written pieces. This insight informs whether to continue curating external content or focus on internal creation.
04The numbers and rules that matter
- Data captured from 28th Aug, 2024.
- Blog Analytics are available to all users across all 3 plans.
05How to set up and use blog analytics in HighLevel
Access blog analytics
- Sign in to your subaccount.
- Click the Sites tab in the left navigation.
- Choose the Analytics tab.
- Open the category selector drop down and pick Blogs.
- Allow the dashboard to load the blog performance data.
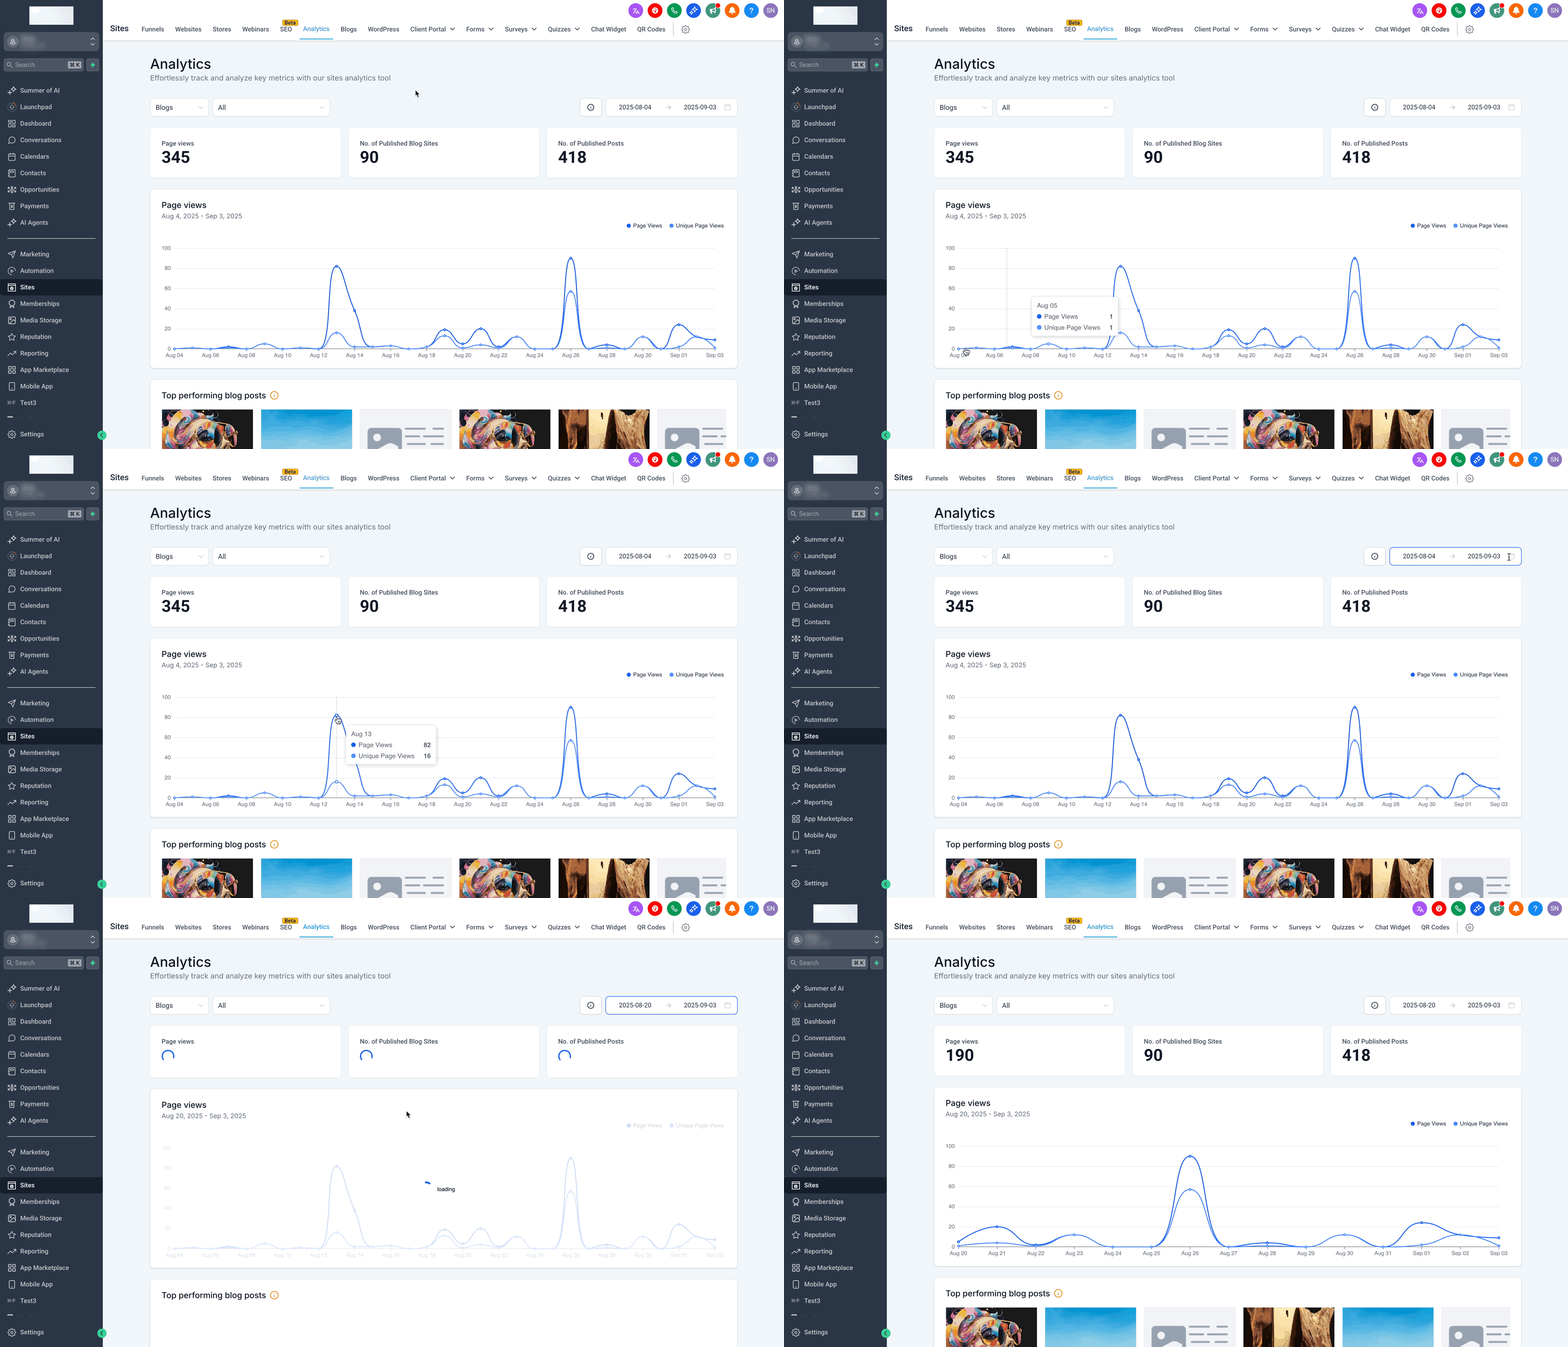
- Use the date range and blog site selectors to adjust the view.
06What it looks like in HighLevel
07Things to know before you rely on it
- Data collection began on 28 Aug 2024; any earlier activity appears as “Unknown”.
- Metrics are refreshed regularly but may show a slight delay, so they are not instant real time.
- Blog Analytics is available to all users on all three HighLevel plans.
08How it connects to the rest of HighLevel
- Set up and manage blogs in HighLevel Blog setup guide
- Create and publish a blog post manually Create blog posts
- Add and edit SEO information for blog posts SEO for blogs
Michael's take

Blog analytics provides raw traffic numbers and clear signals about what readers prefer and where improvements can be made.
Don’t ignore the “Unknown” label for pre August 2024 data. It can affect your analysis.