
01Who this is for
- Marketers can see which landing page forms convert best and adjust copy to improve results.
- Product teams can identify survey questions that cause respondents to leave and refine the flow.
- Customer support managers can monitor average completion time to spot friction in feedback forms.
02Analytics for forms and surveys, explained
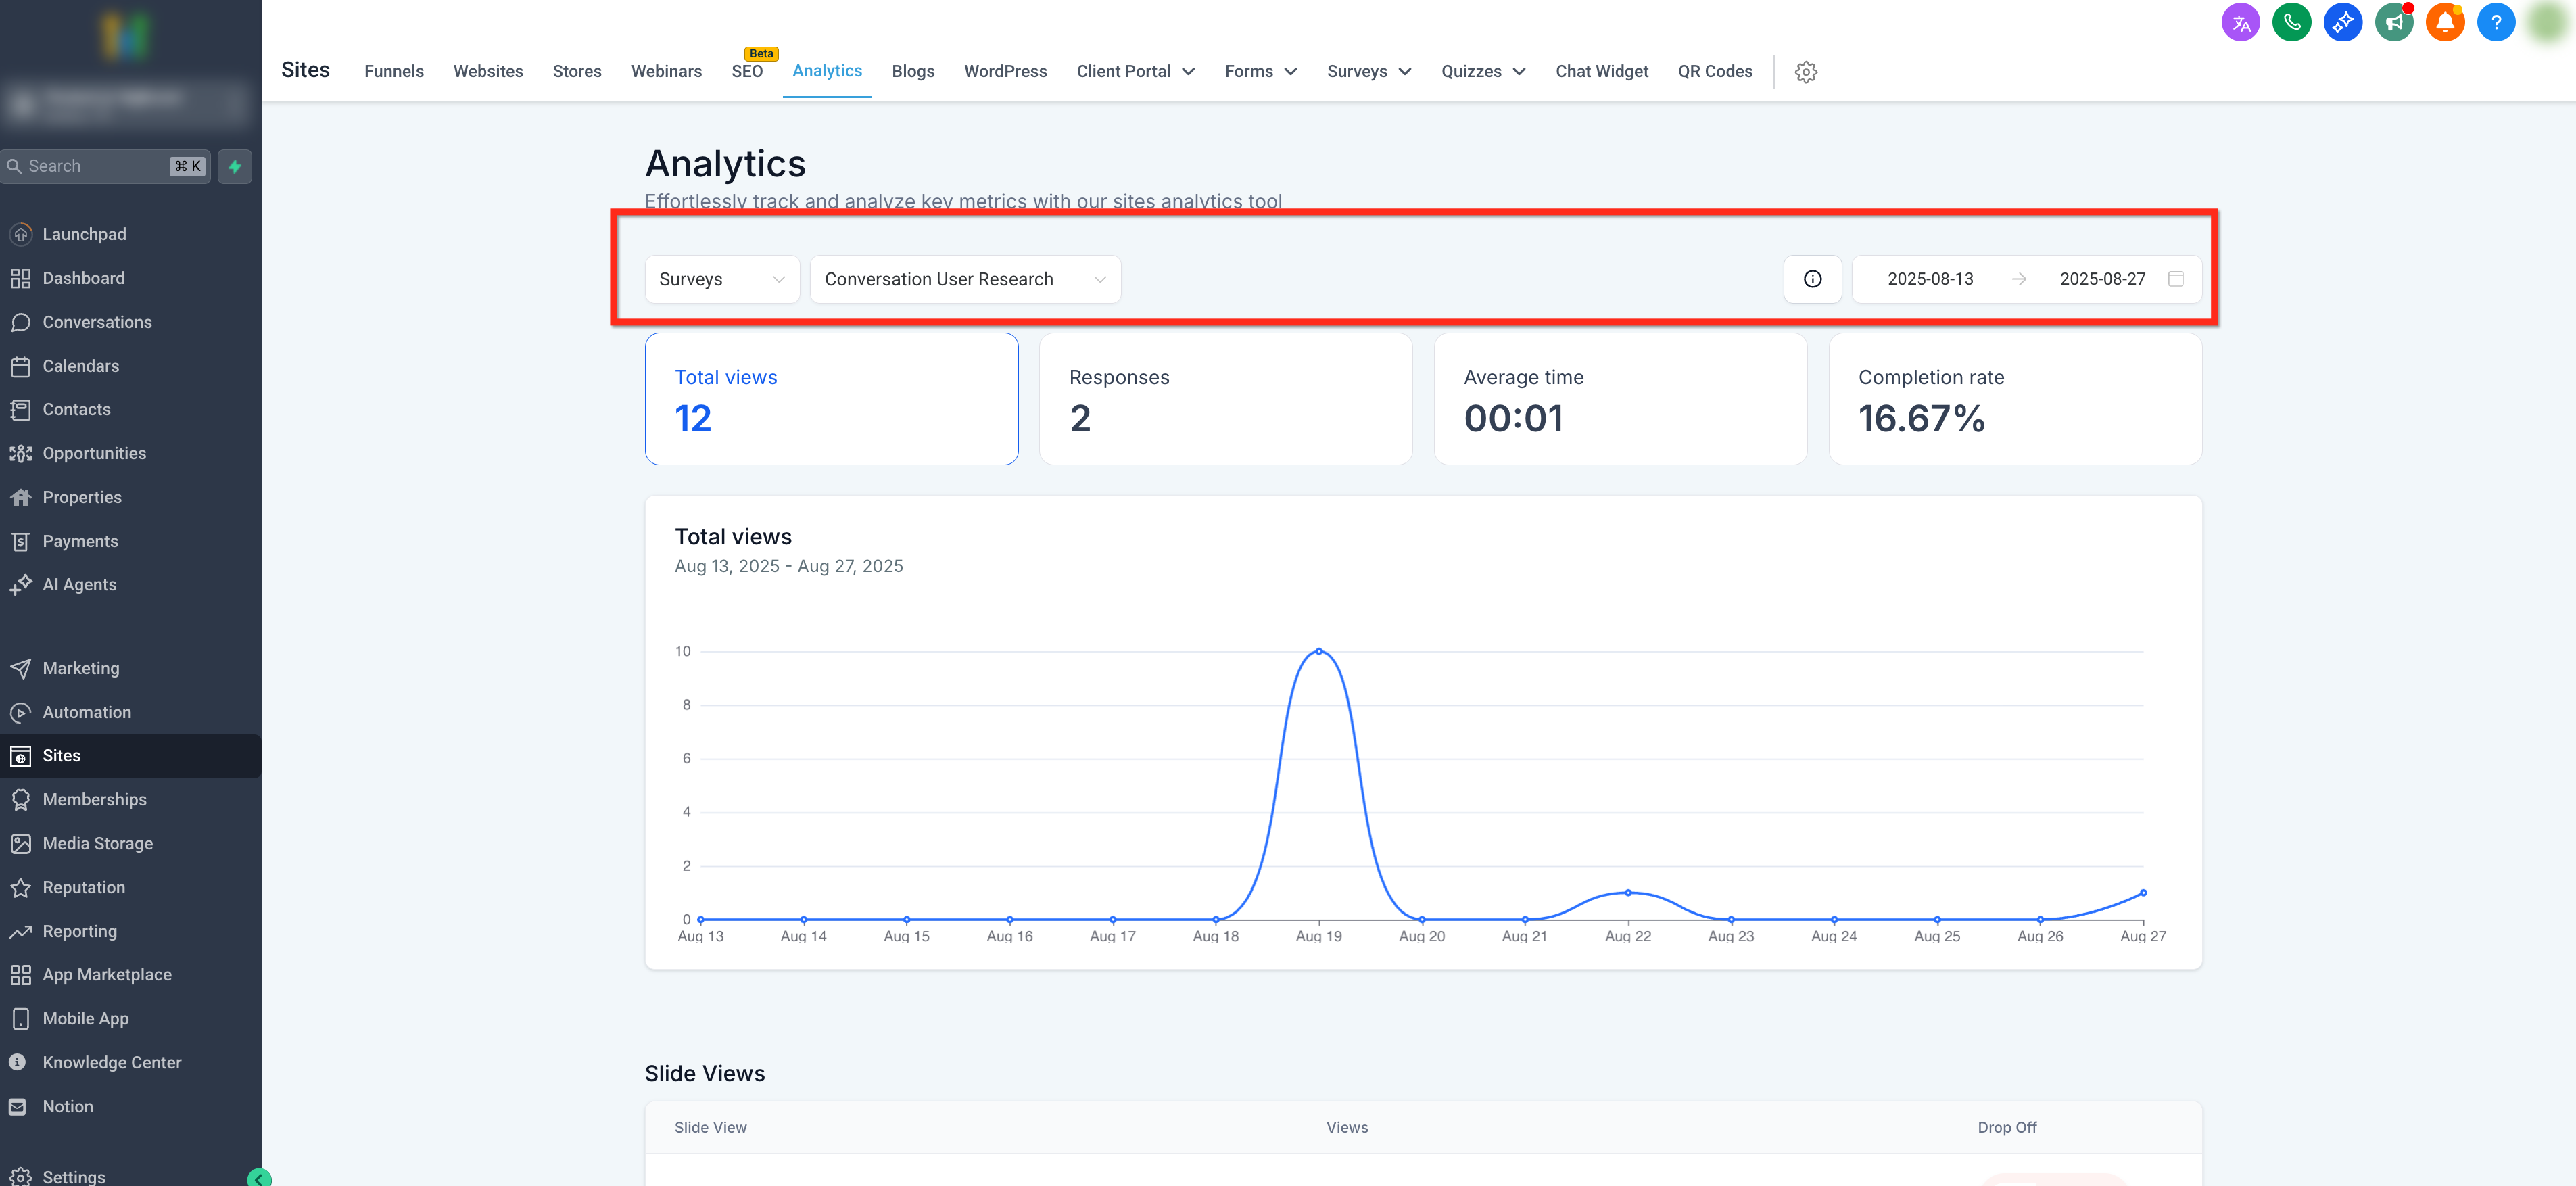
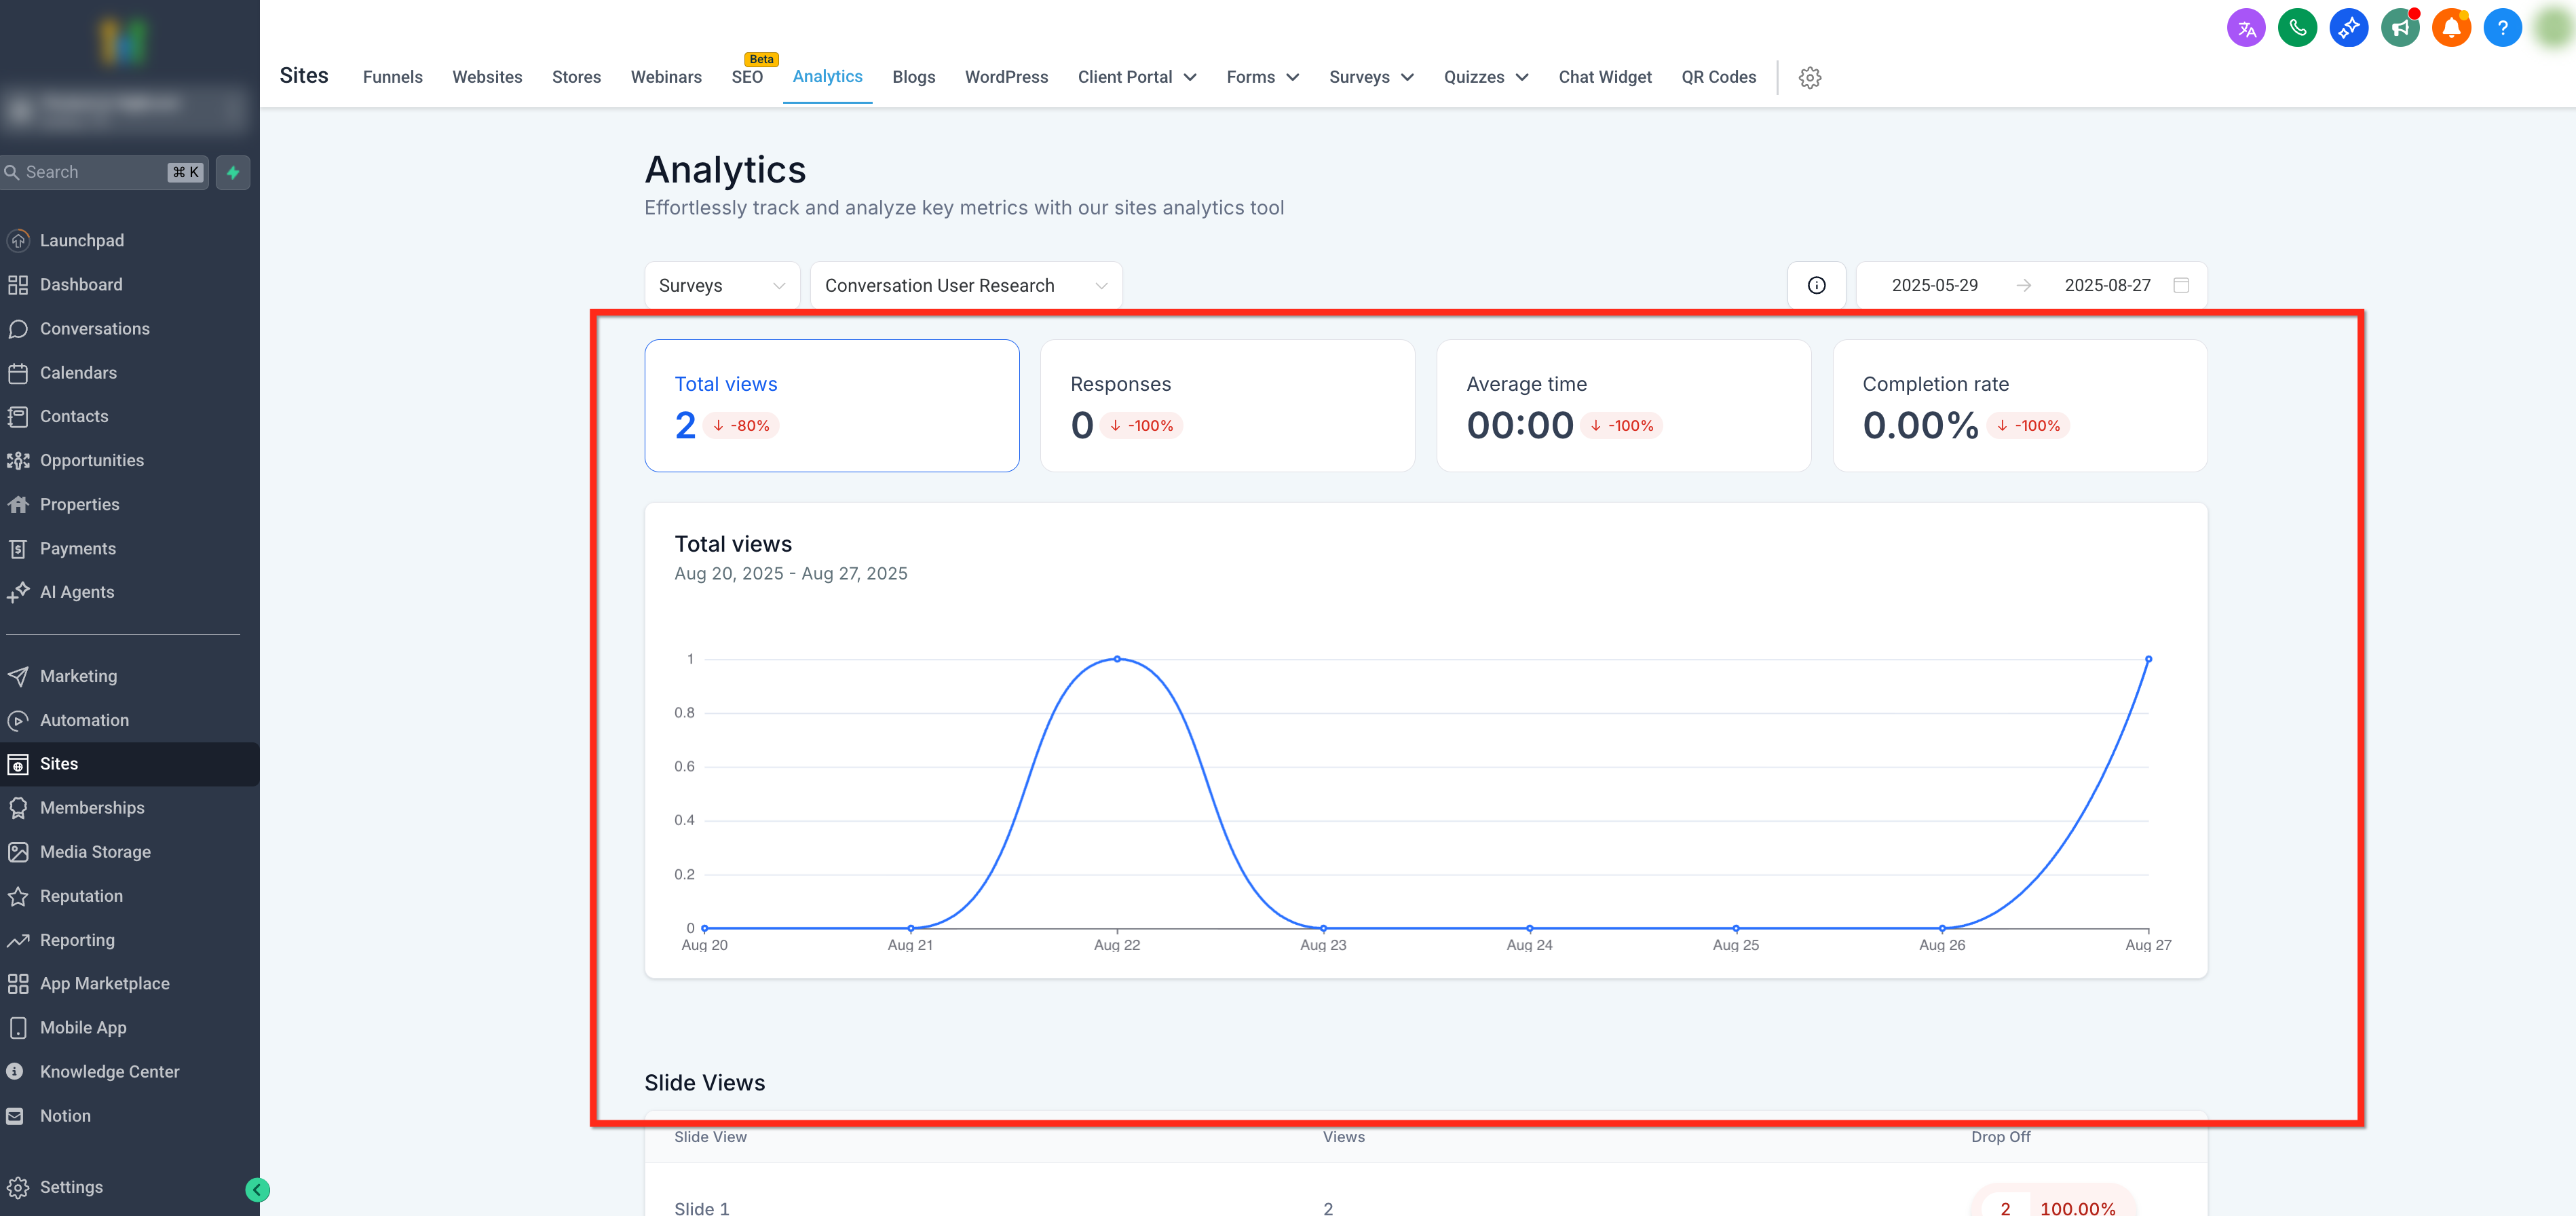
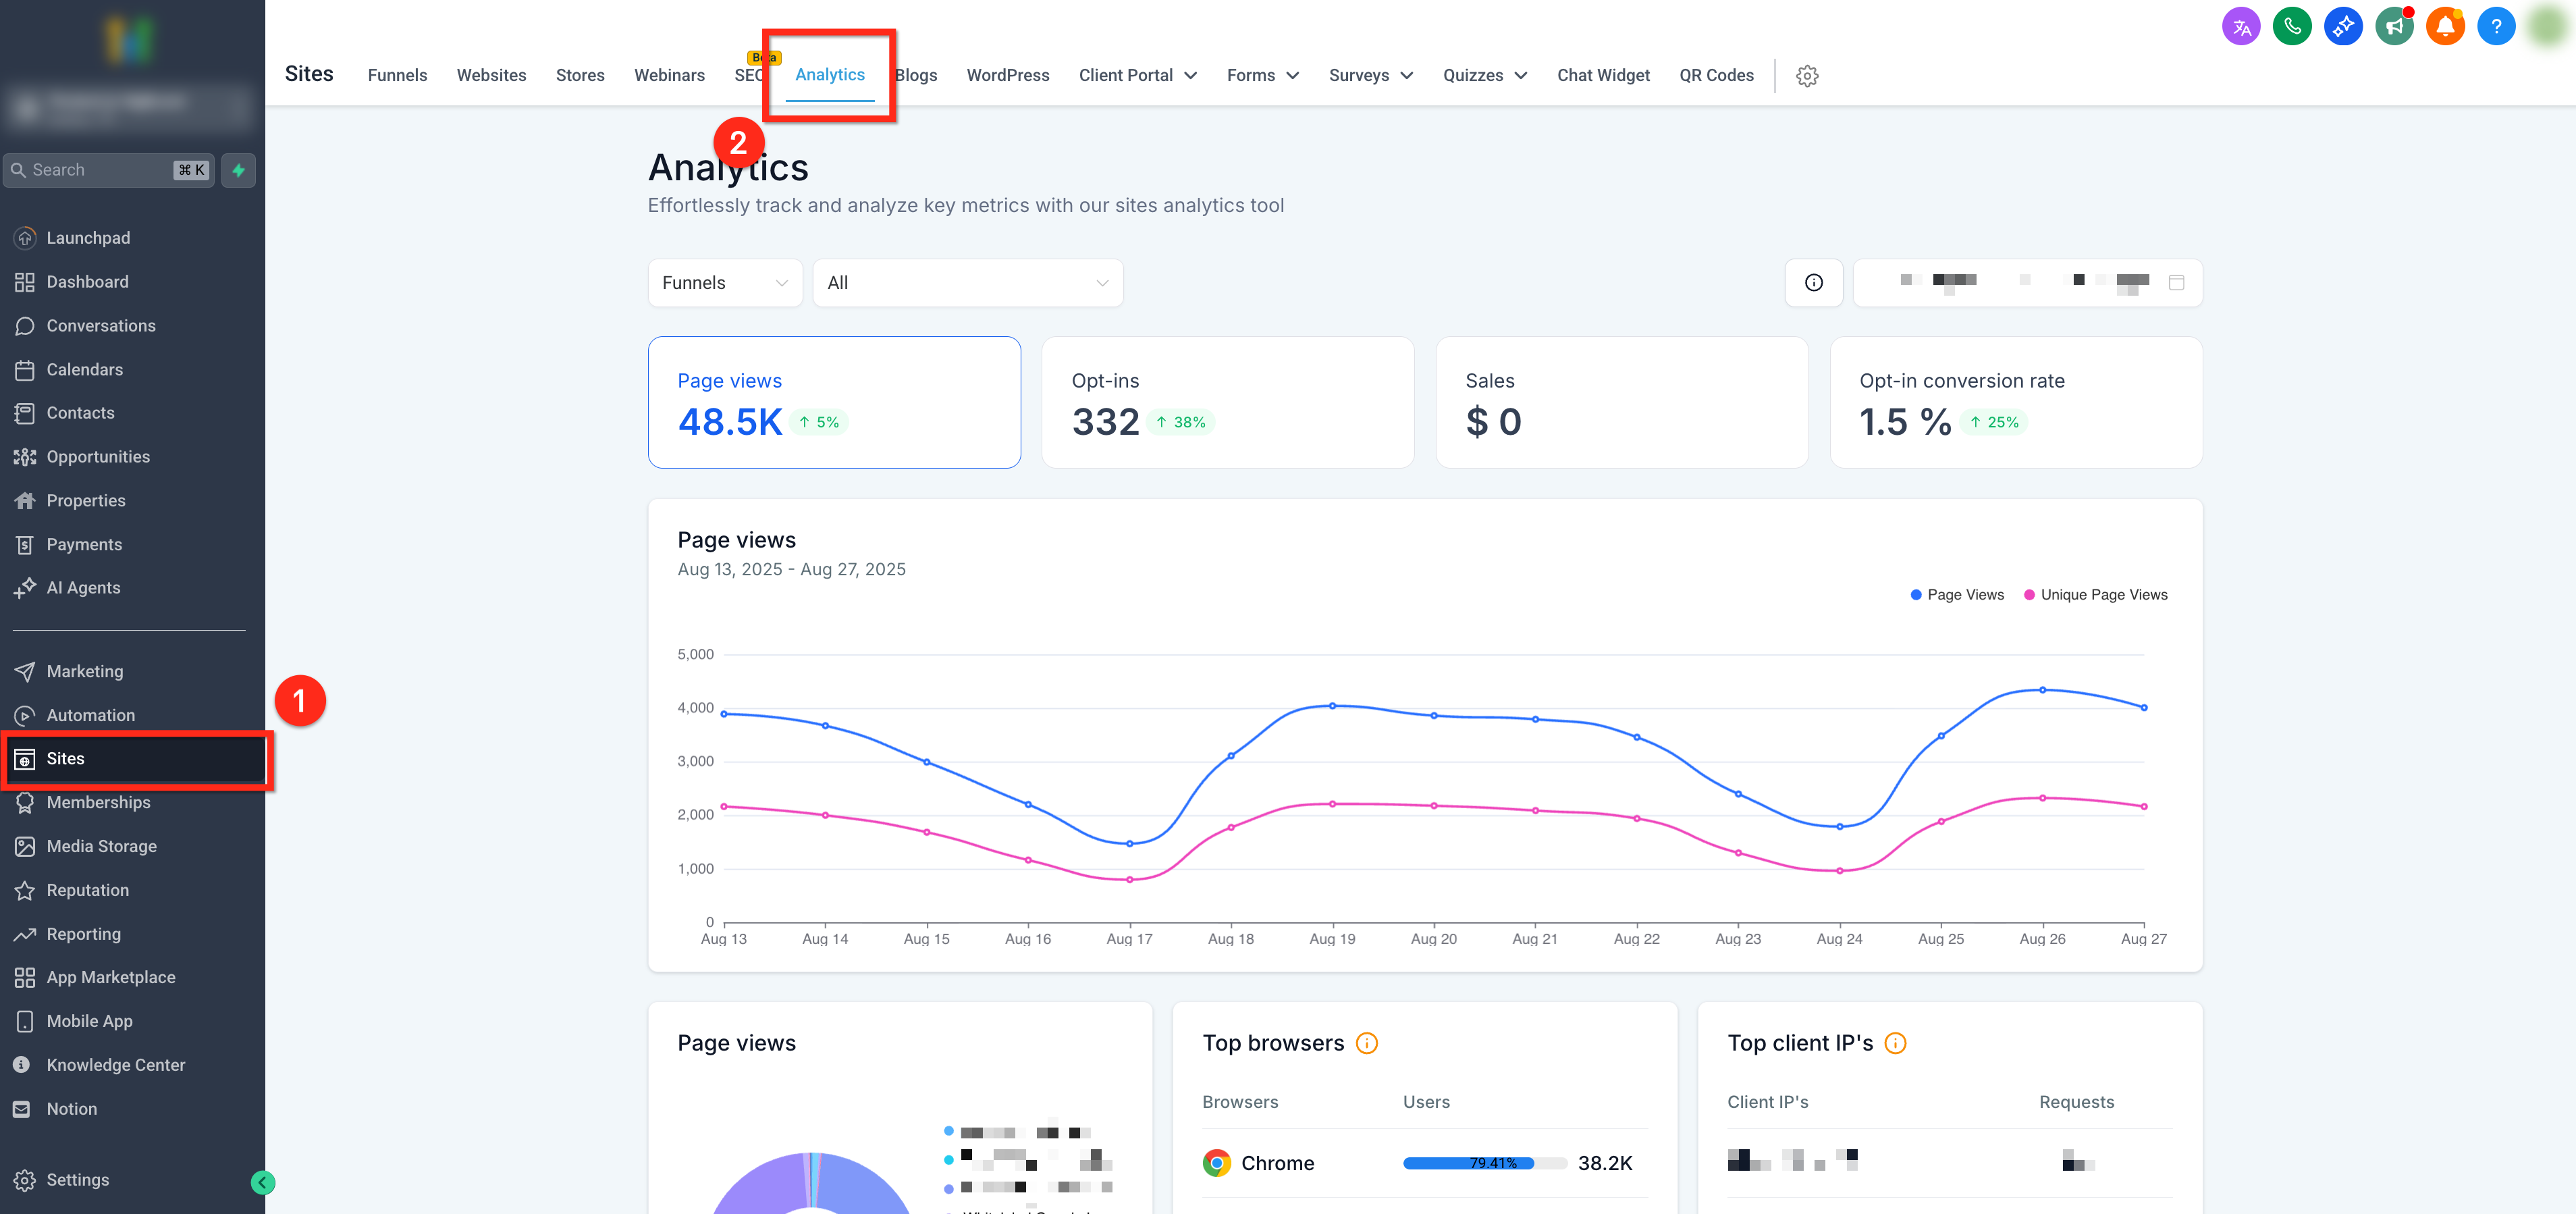
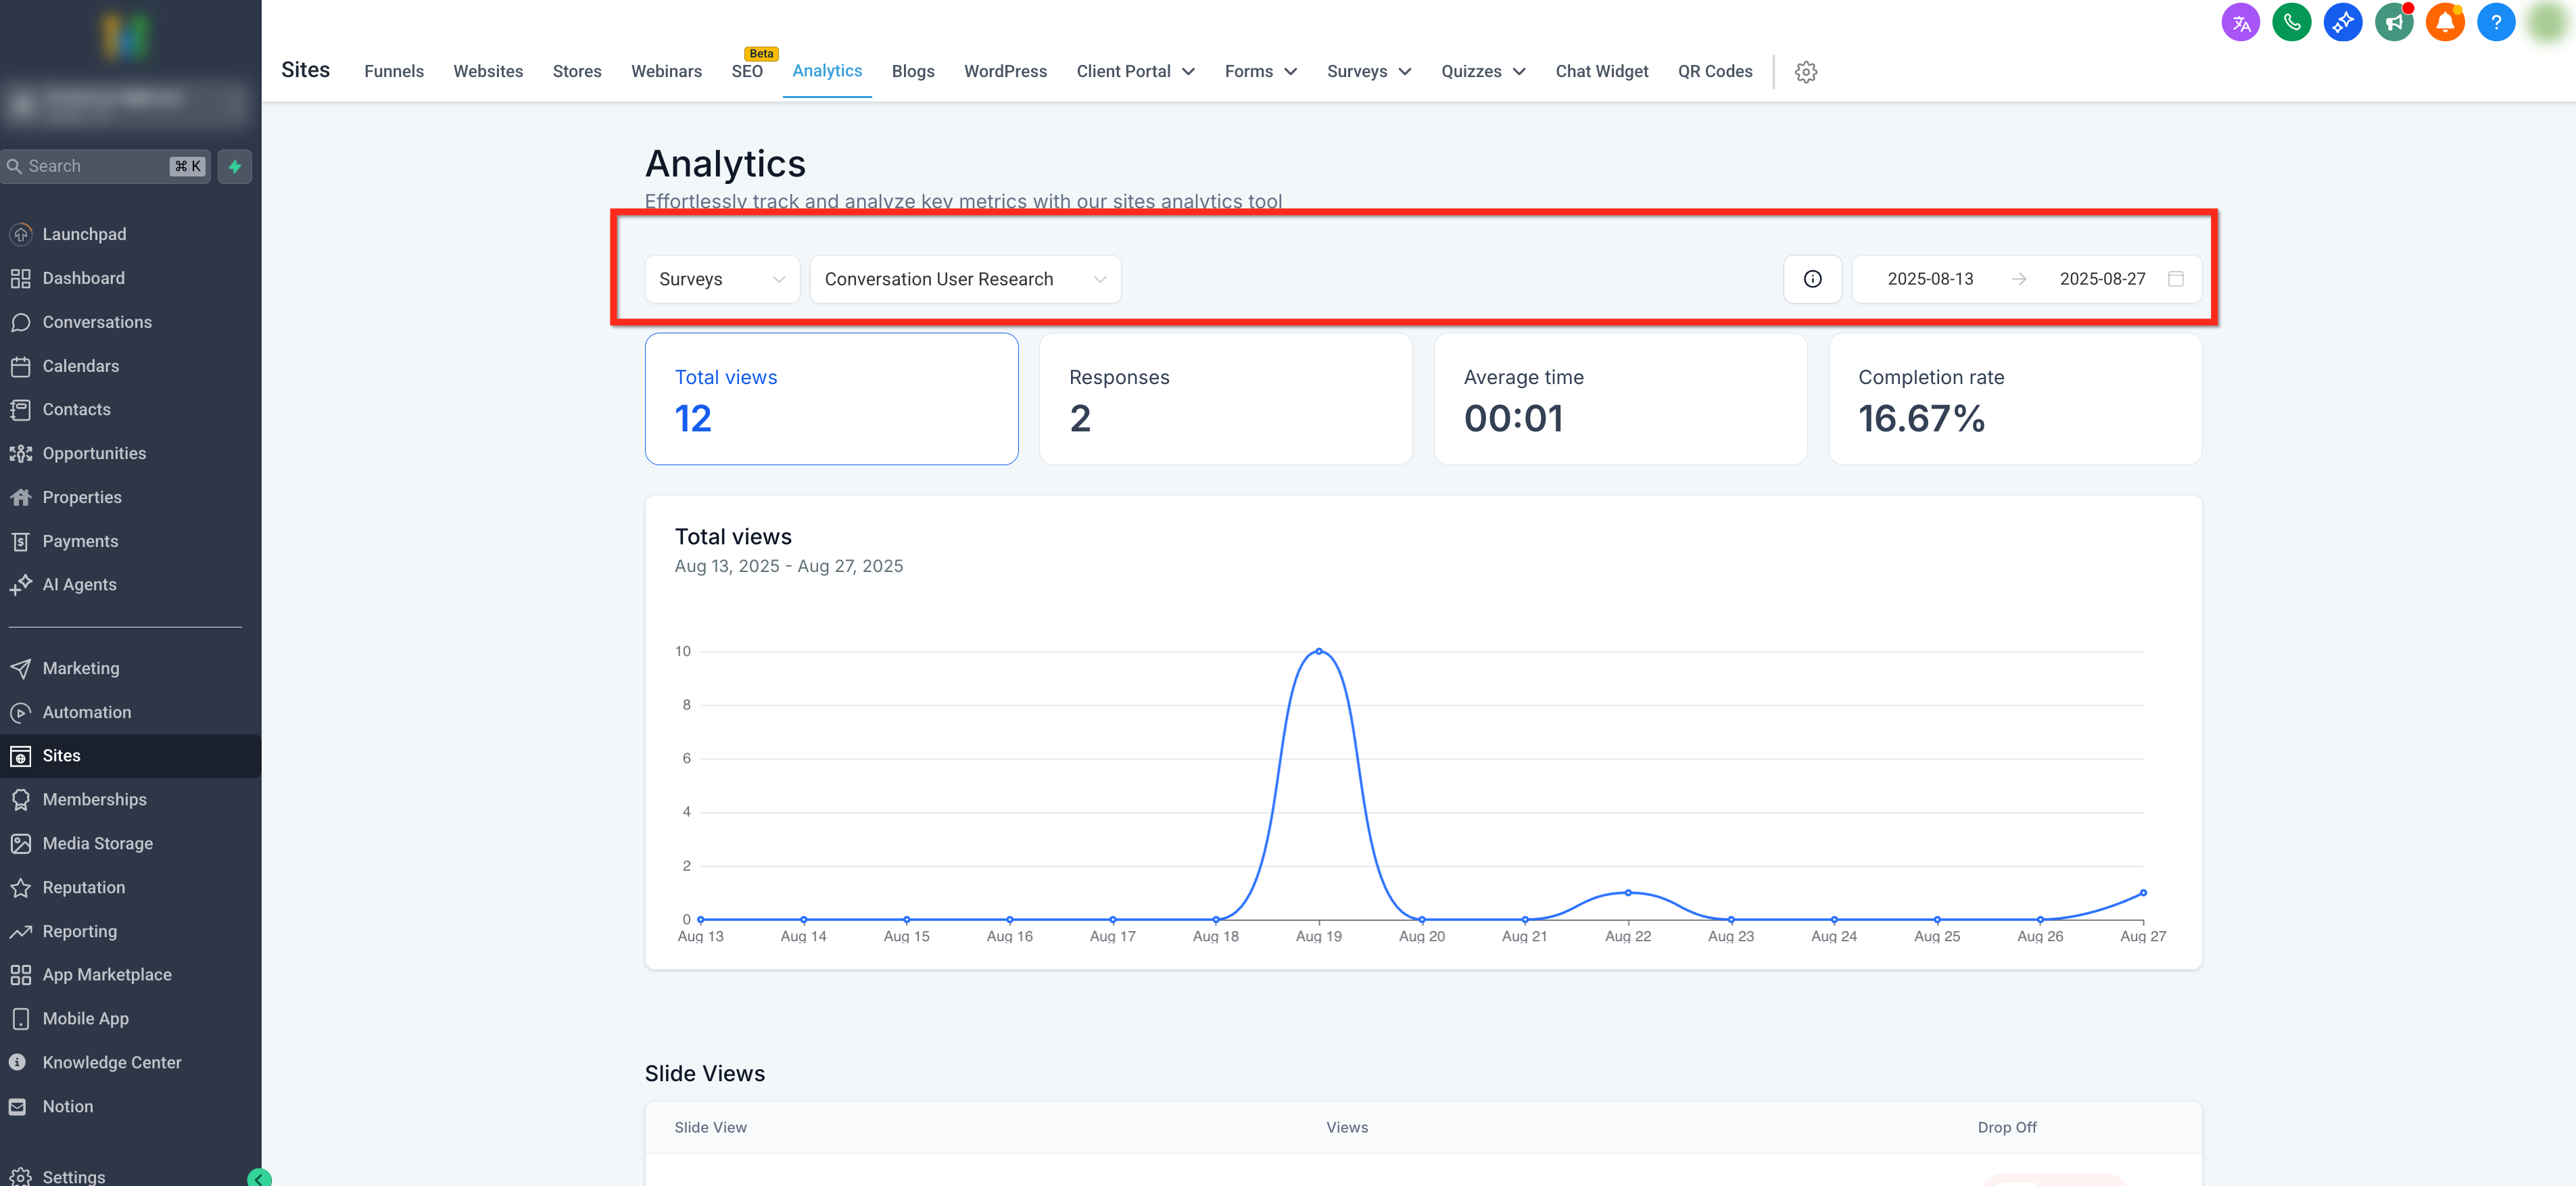
The analytics feature lives under the Sites section in the left navigation. Selecting Analytics opens a dashboard that displays cards, charts and tables for the chosen form or survey. Metrics include total views, responses, average completion time and completion rate, with a previous period comparison built in.
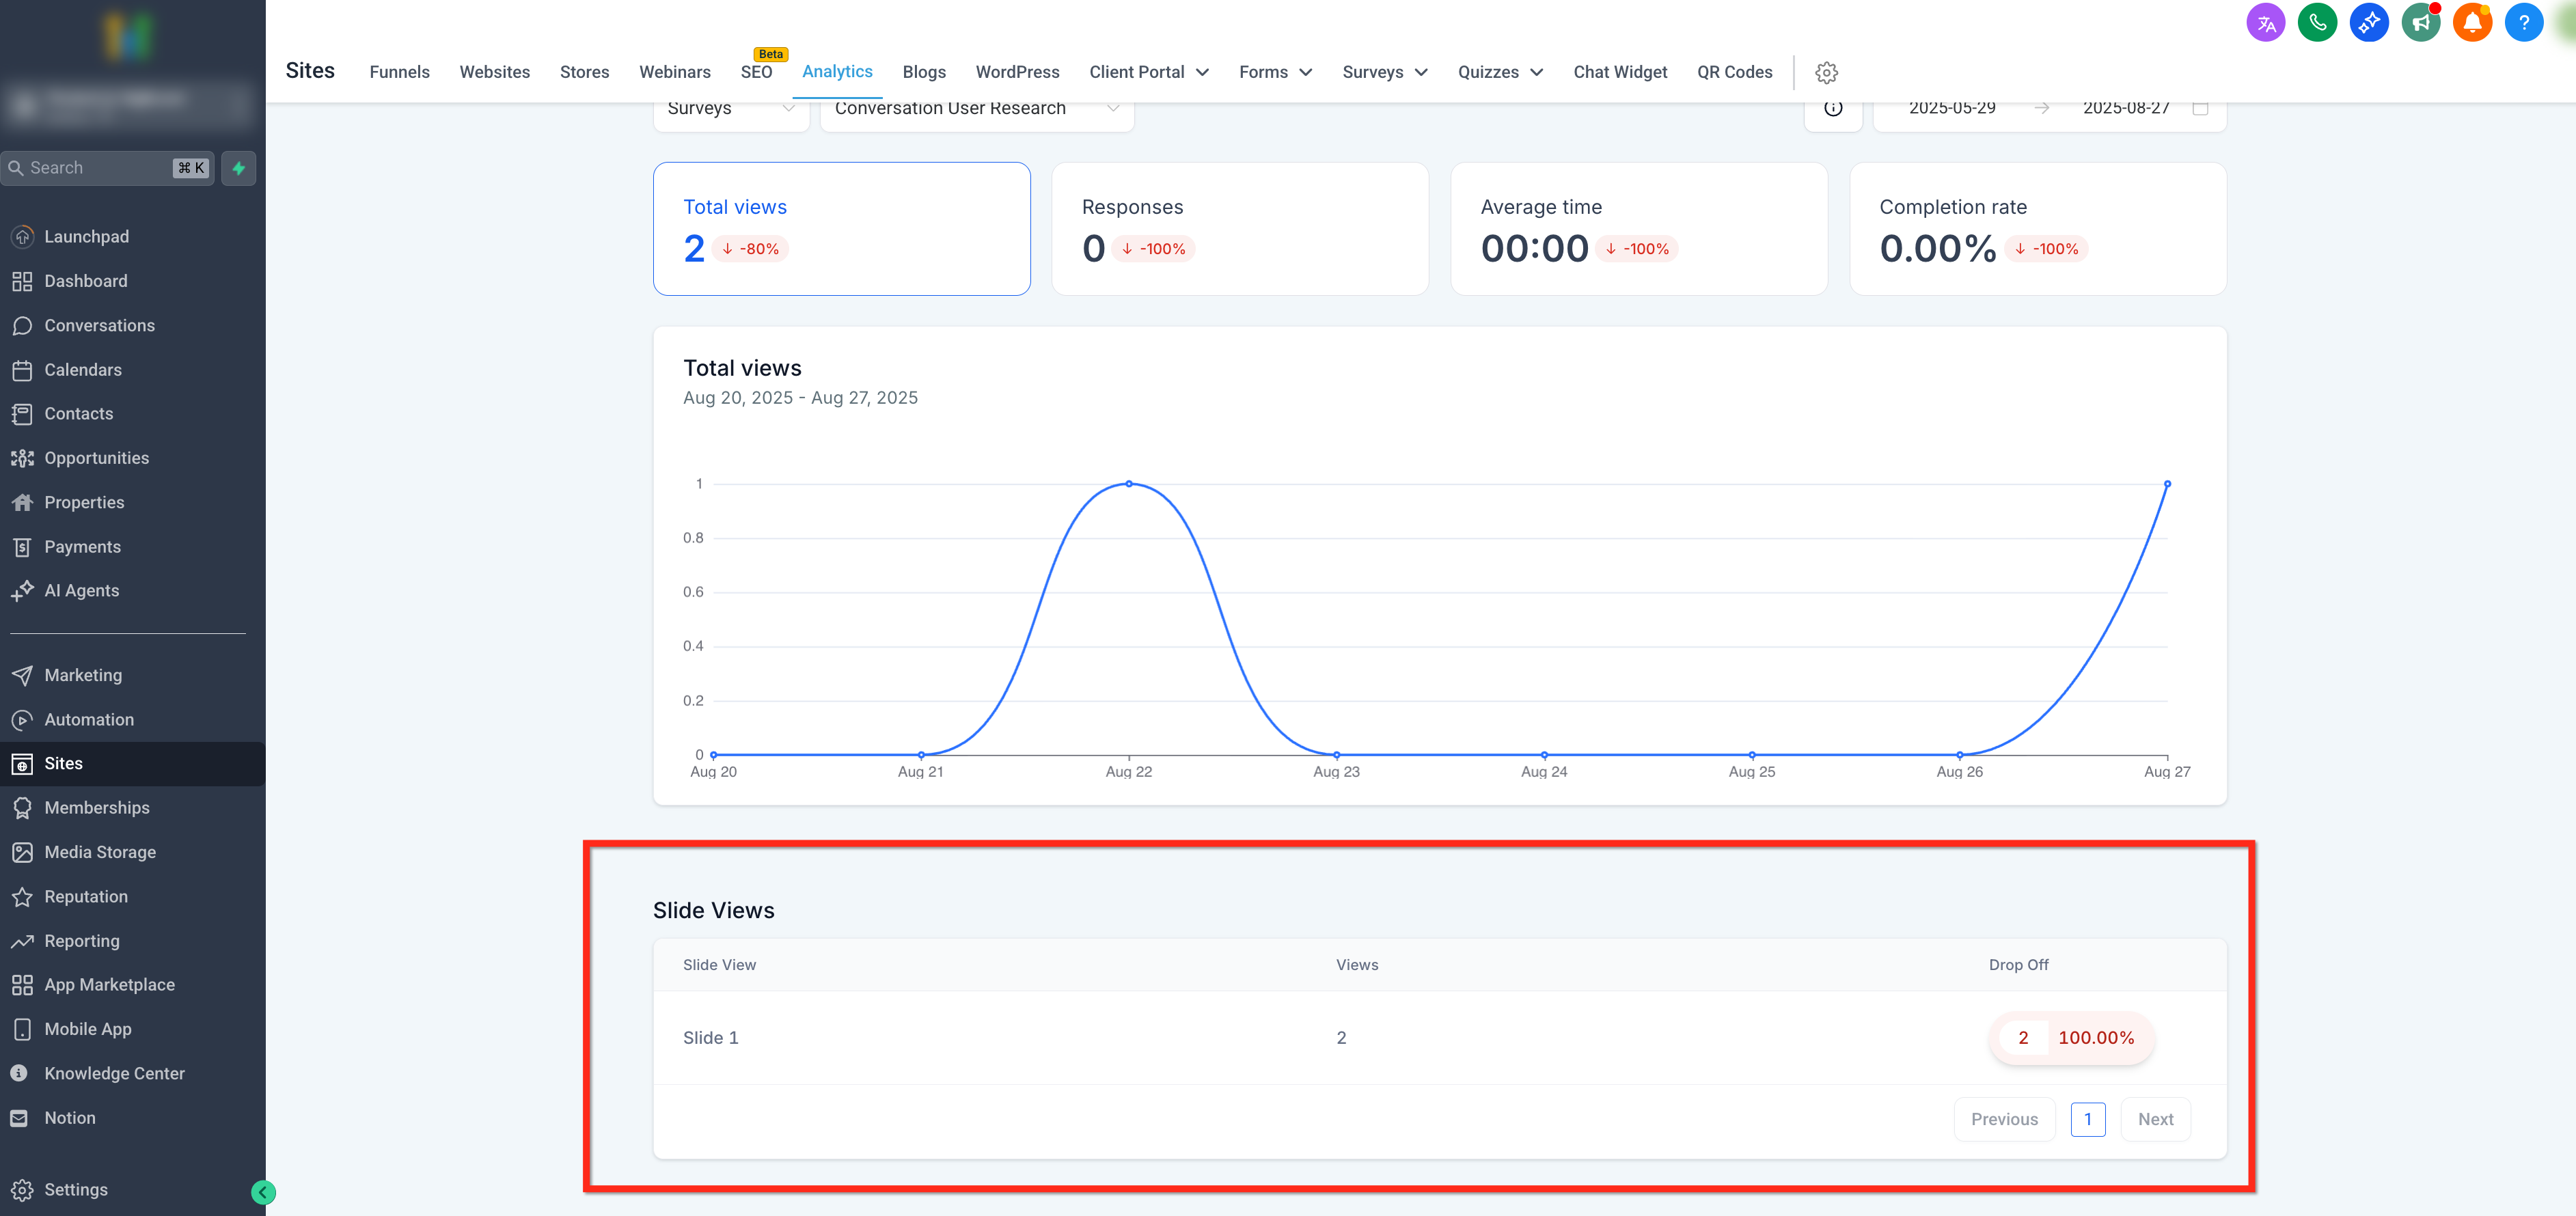
Filters appear at the top left of the page. You can choose Forms or Surveys, select a specific asset or view all assets, and set a date range using presets or a custom interval. When a single survey is selected, an additional table shows slide level views and drop off counts.
The drop off for each slide is calculated by subtracting the views of the current slide from the previous slide, then dividing by the previous slide's views. A negative number means more respondents reached the slide than the one before, often due to skip logic or reordered slides.
03How businesses use analytics for forms and surveys
- Digital marketing agency. The agency opens the Analytics dashboard, filters to a client’s lead capture form, and reviews the completion rate and average time. This helps them recommend form layout changes to the client.
- E learning platform. The platform selects a post course survey, switches the asset filter to that survey, and examines the slide level drop off table. They then adjust question order to reduce exits.
- Real estate brokerage. The brokerage views all contact forms, compares the last 30 days to the prior period, and spots a dip in views for a new property listing form, prompting a promotion review.
04The numbers and rules that matter
- Filters: Type (Forms or Surveys), Asset (All or specific), Date Range (Last 7/14/30/60/90 days or Custom).
- Per Asset Breakdown table appears when viewing All assets.
- Drop Off (count) = Views(n 1), Views(n).
- Drop Off (%) = Drop Off(count) ÷ Views(n 1) × 100.
- Slide 1 Drop Off = N/A.
05How to set up and use analytics for forms and surveys in HighLevel
View analytics dashboard
- Open the left menu and go to Sites then Analytics.
- Choose Forms or Surveys, select an asset or All, and set the desired date range.
- Examine the metric cards, line chart and, for a single survey, the slide level table.
06What it looks like in HighLevel
07Settings that matter
- Type. Selects whether the dashboard shows data for forms or for surveys.
- Asset. Limits the view to a single form or survey, or shows data for all assets together.
- Date Range. Defines the time period for which metrics are calculated, using preset or custom dates.
08Things to know before you rely on it
- Slide level view and drop off metrics appear only when a single survey is selected.
- The per asset breakdown table is shown only when the Asset filter is set to All.
- Negative drop off values can occur due to skip logic, legacy routing or slide reordering.
- The previous period comparison uses the same length of time immediately before the selected range.
09If something goes wrong
- Negative drop off values are shown. Check conditional logic, legacy routing rules, any slide order changes, and ensure the date filter matches the period you want to analyze.
- Slide level table does not appear for a survey. Select that specific survey in the Asset filter instead of All surveys.
- Per form breakdown is missing. Switch the Asset filter to All forms or All surveys to view the aggregate breakdown.
10How it connects to the rest of HighLevel
- Create and manage a contact form Contact form builder
- Enable address auto complete in forms Address auto complete
- Embed HighLevel forms on other website builders Embedding forms
Michael's take

I find it useful to start with a clean date range, pull the slide level table for a survey, and test a tweak on a slide with higher drop off. Then I monitor the metrics in the next period to see if there’s any change.
Drilling down to a single survey helps reveal where respondents jump or quit, allowing you to target specific steps for improvement.