
01Who this is for
- Agency owners who resell usage based services, because the widget reveals which client locations generate profit.
- Finance managers at agencies, since it provides a clear table of revenue, cost and margin per subaccount.
- Product teams that set markups, because they can see margin trends and adjust pricing where needed.
02Location Level Breakdown widget, explained
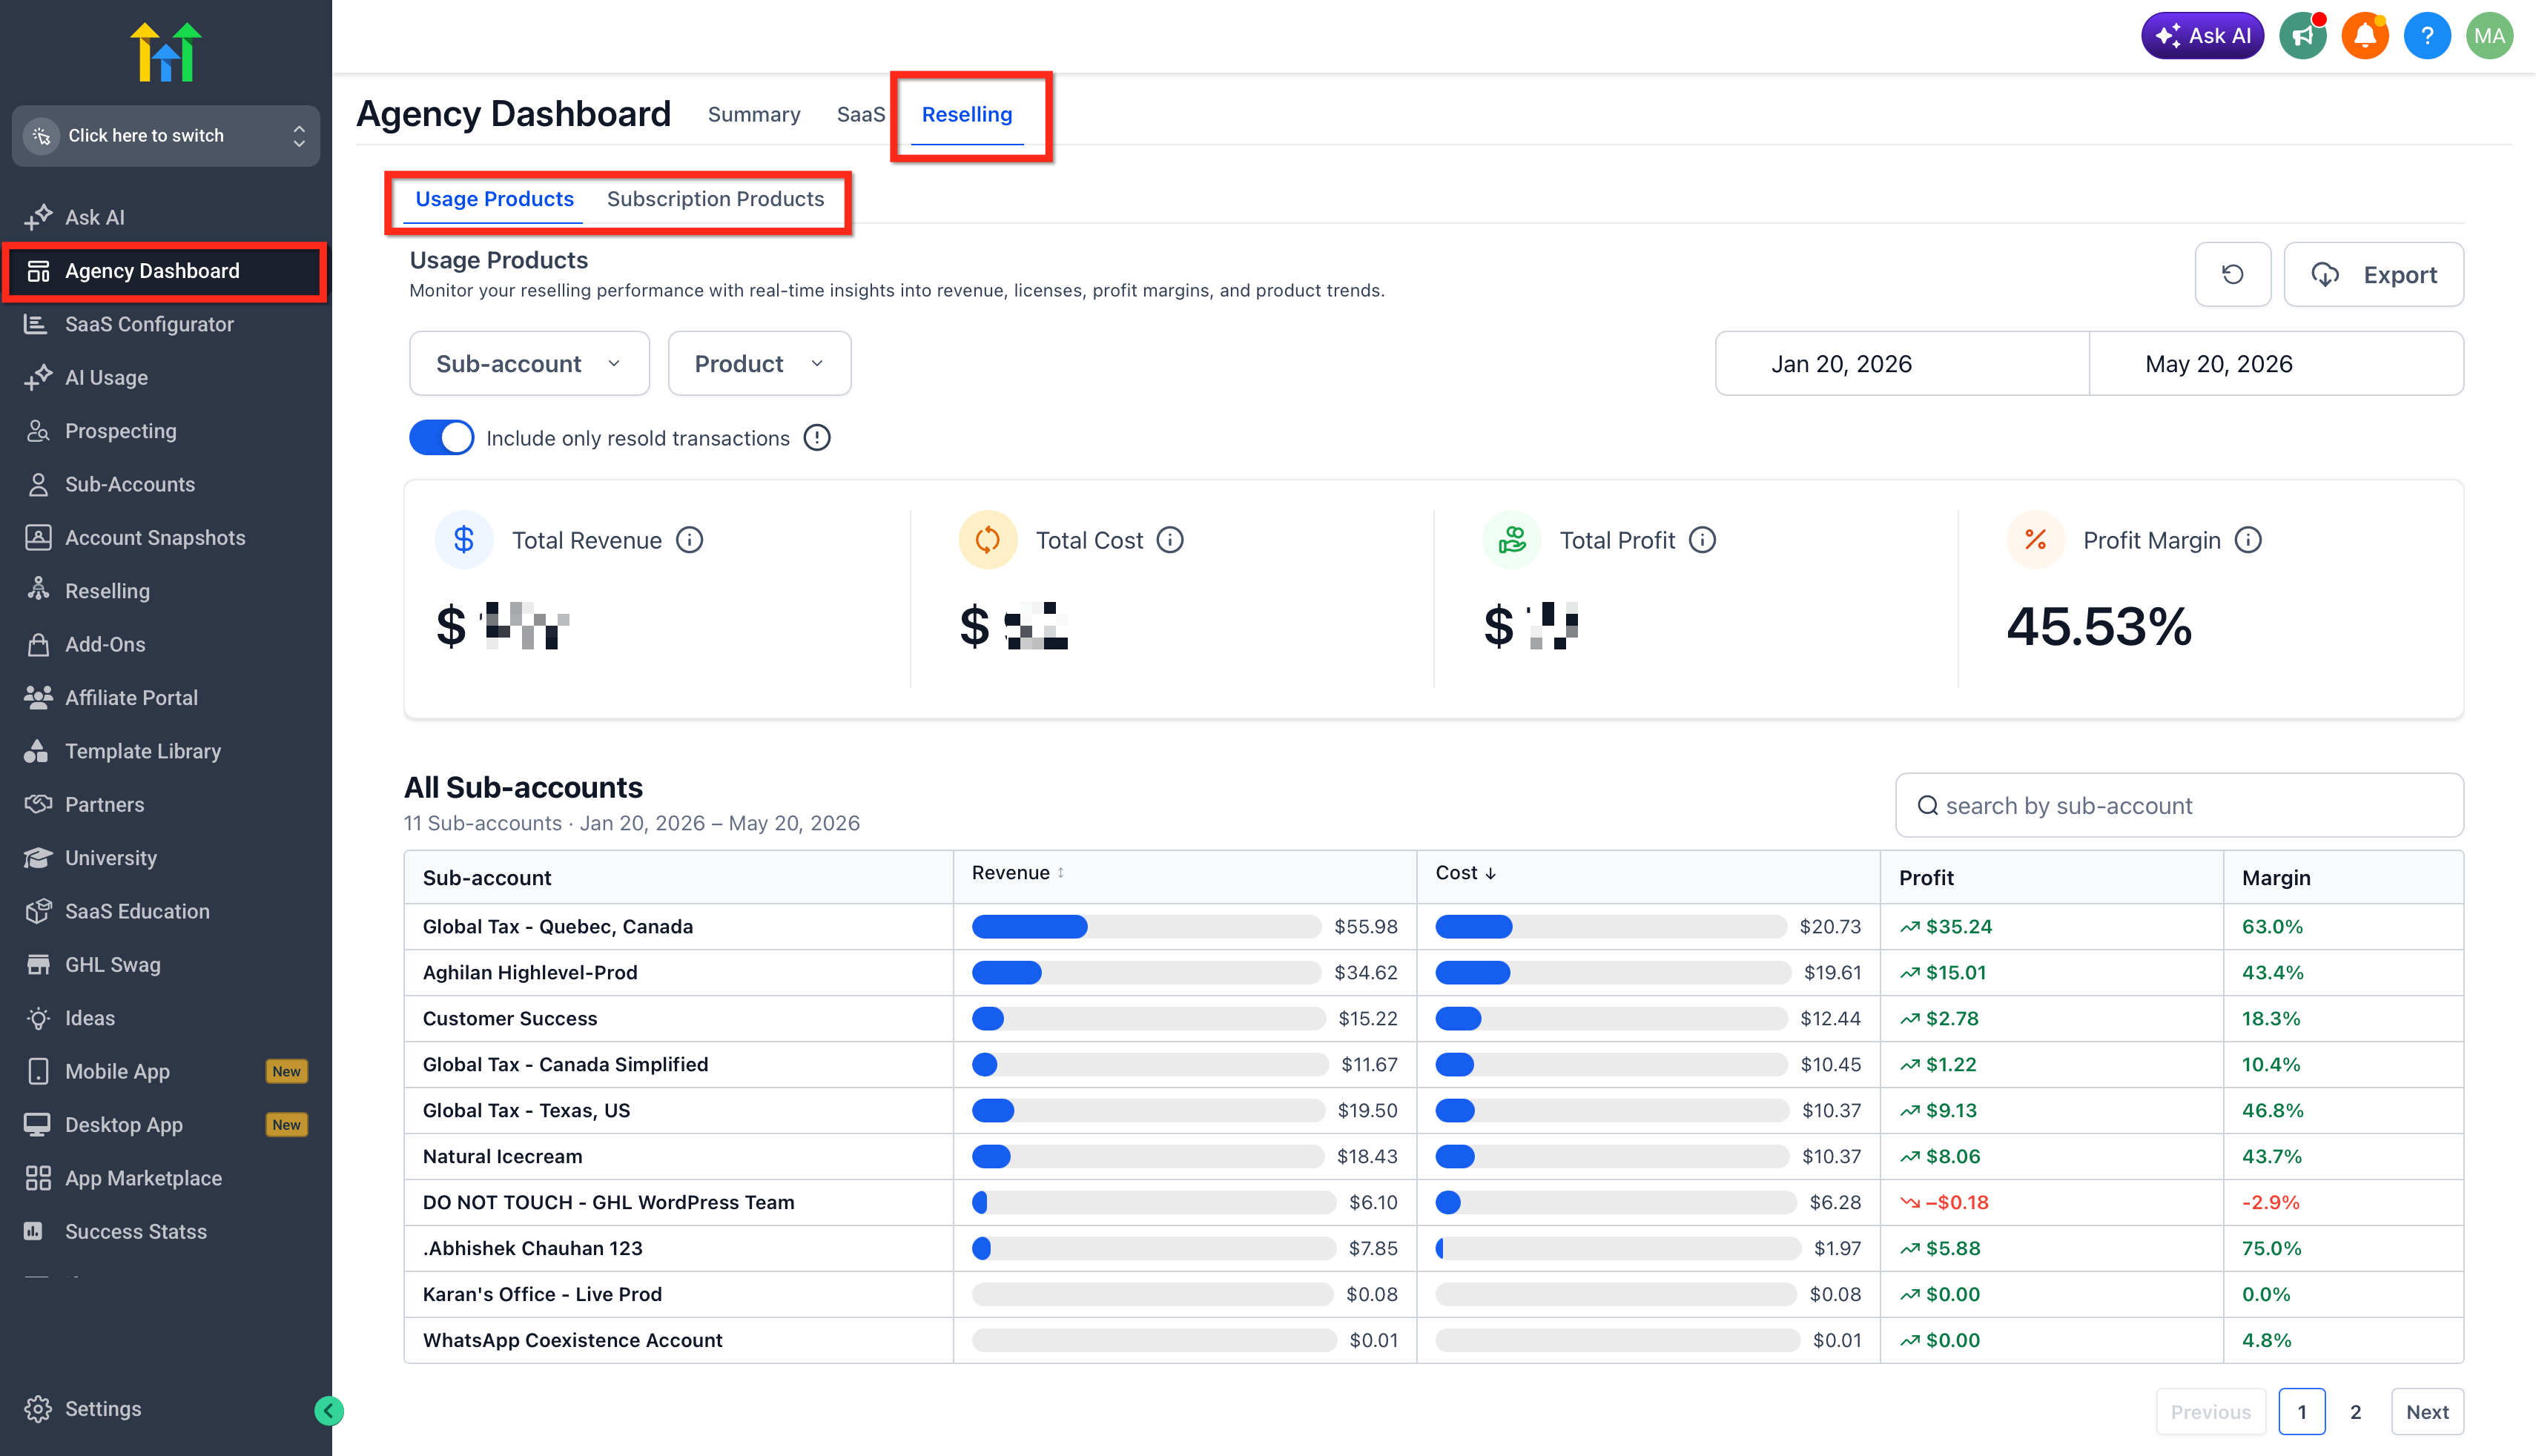
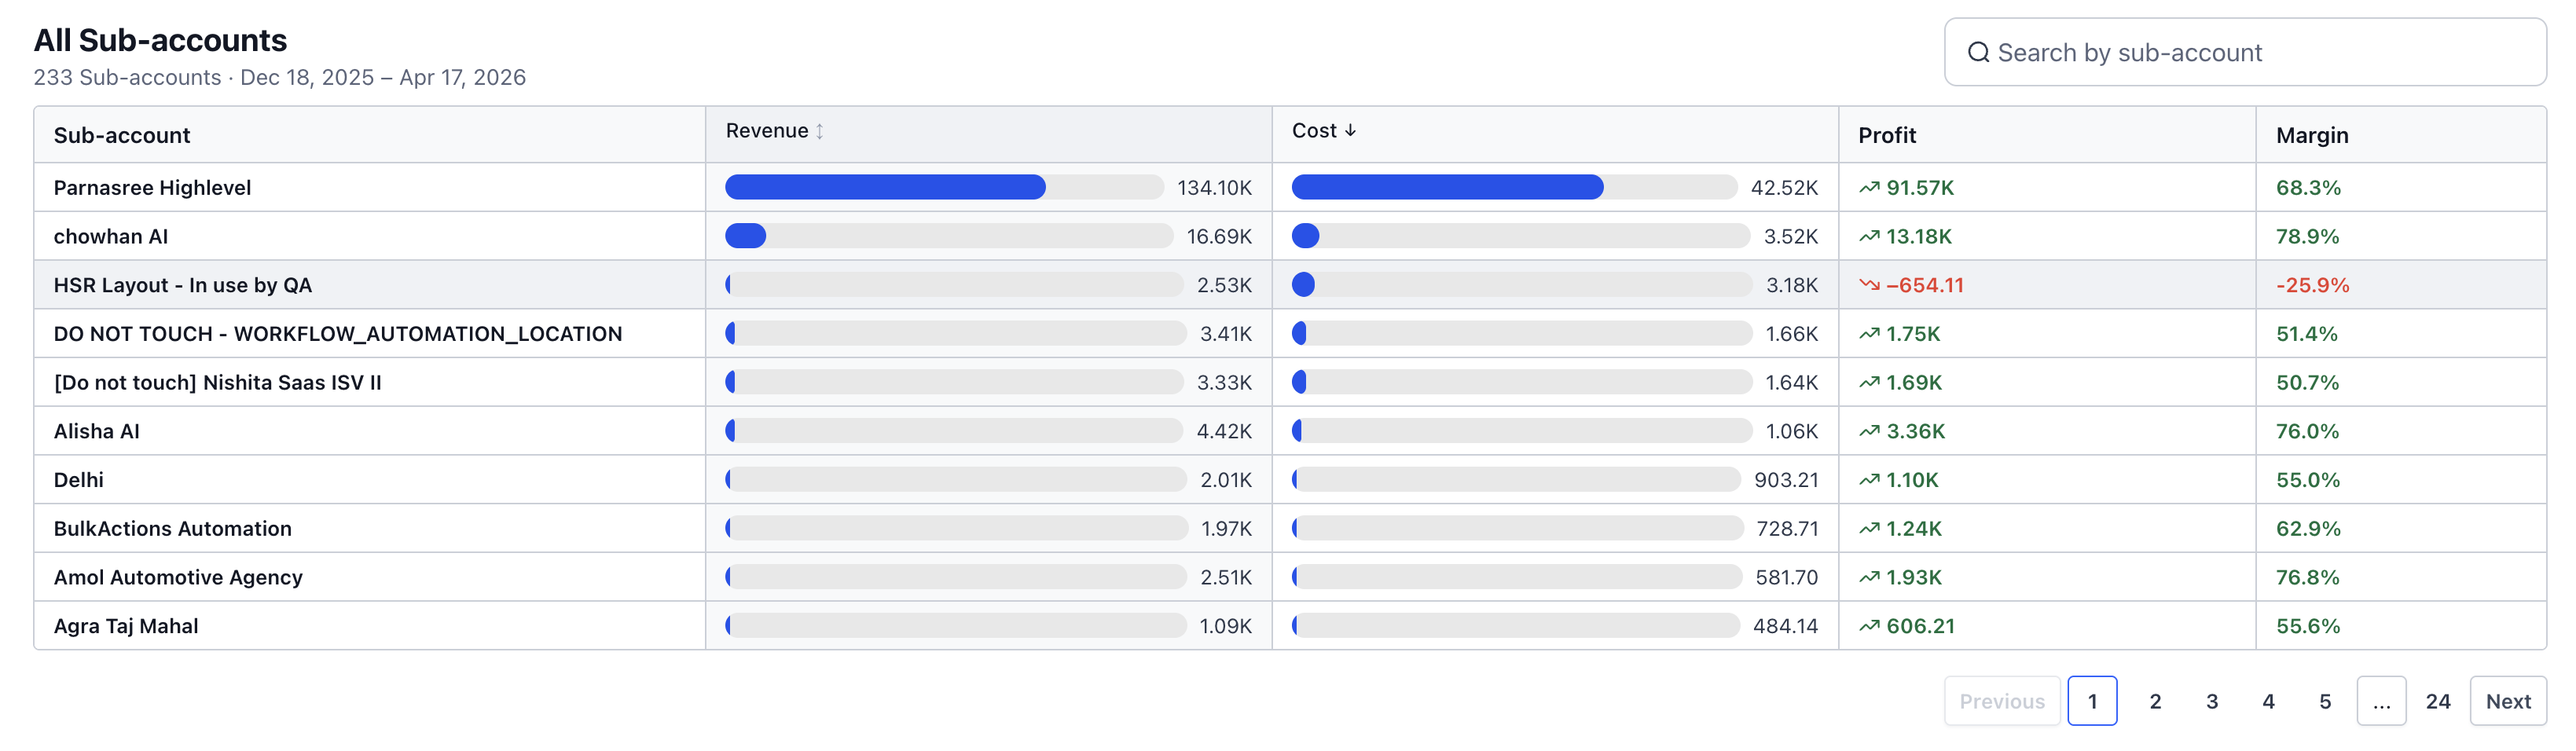
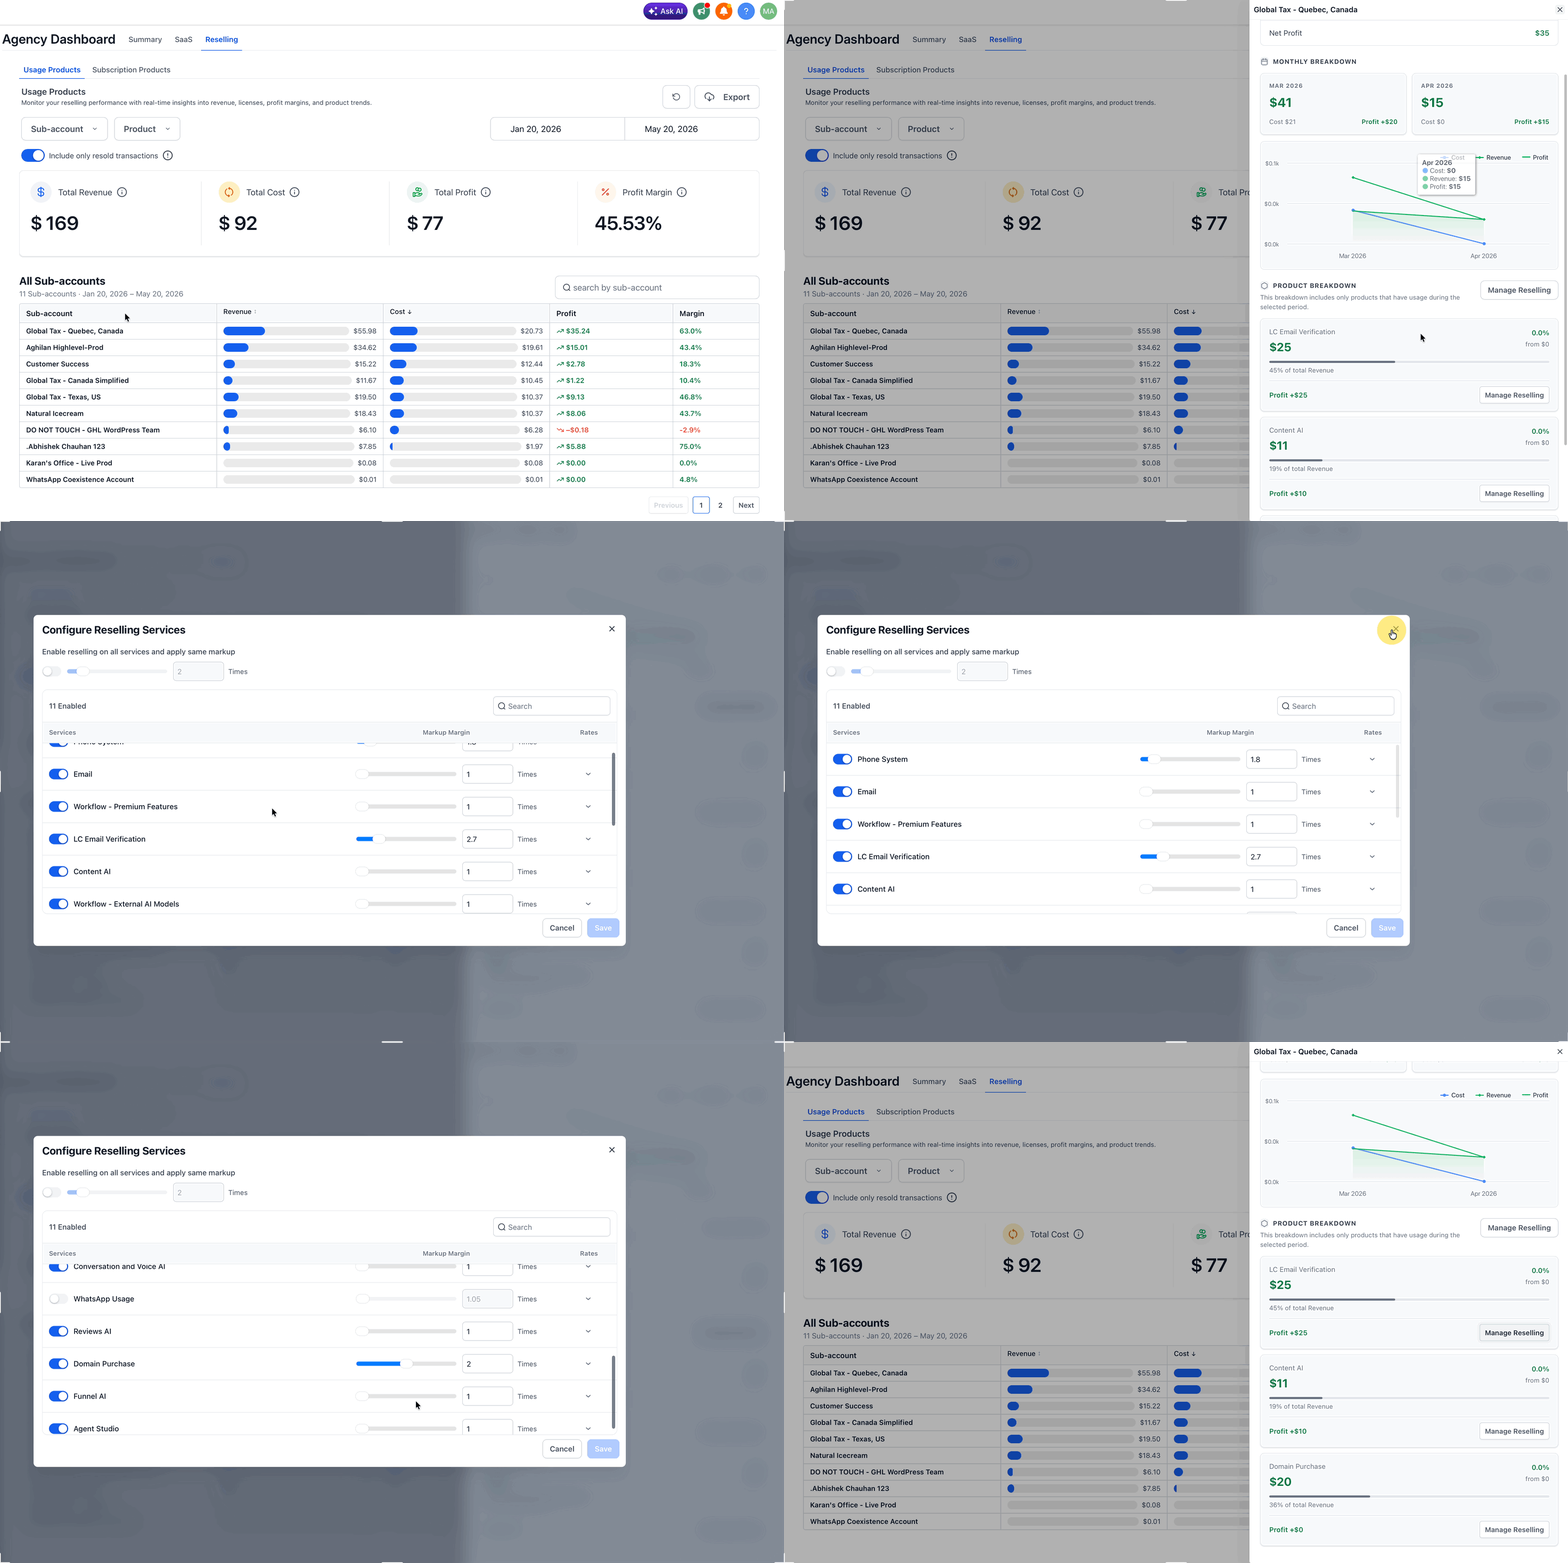
The widget appears in the Reselling tab of the Agency Dashboard. It lists every subaccount (location) and displays four key financial figures: revenue earned, cost incurred, profit (revenue minus cost) and profit margin as a percentage of revenue.
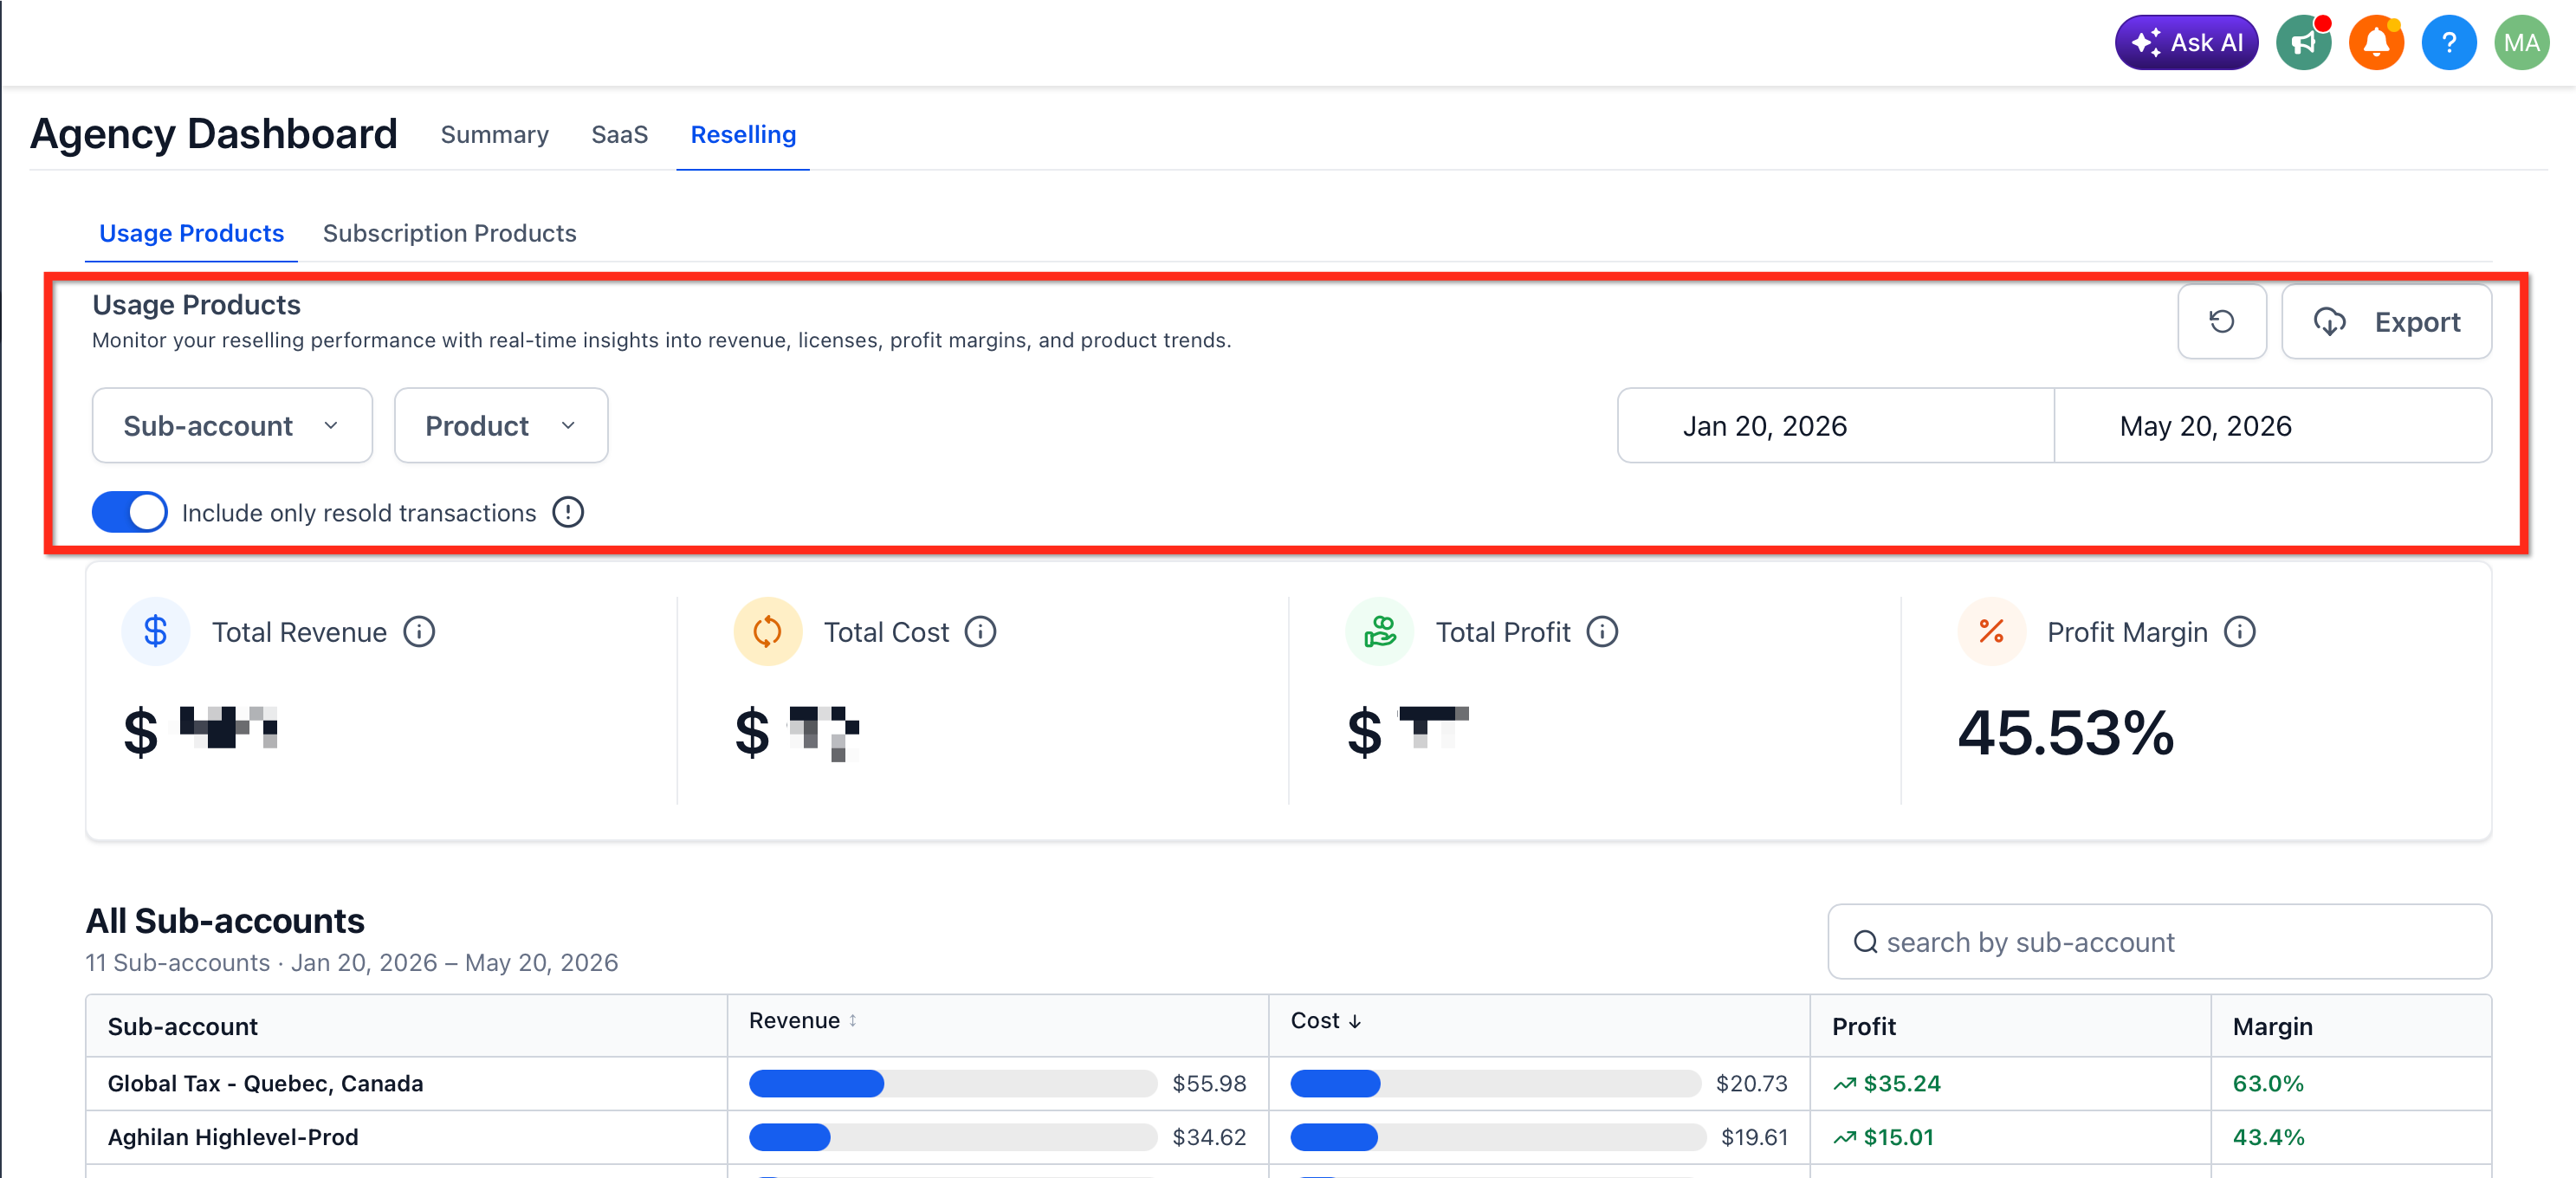
Filters sit above the table, allowing you to narrow the view by specific subaccounts, product categories, date ranges, or to include only resold transactions. An Export button lets you download the current view as a CSV file.
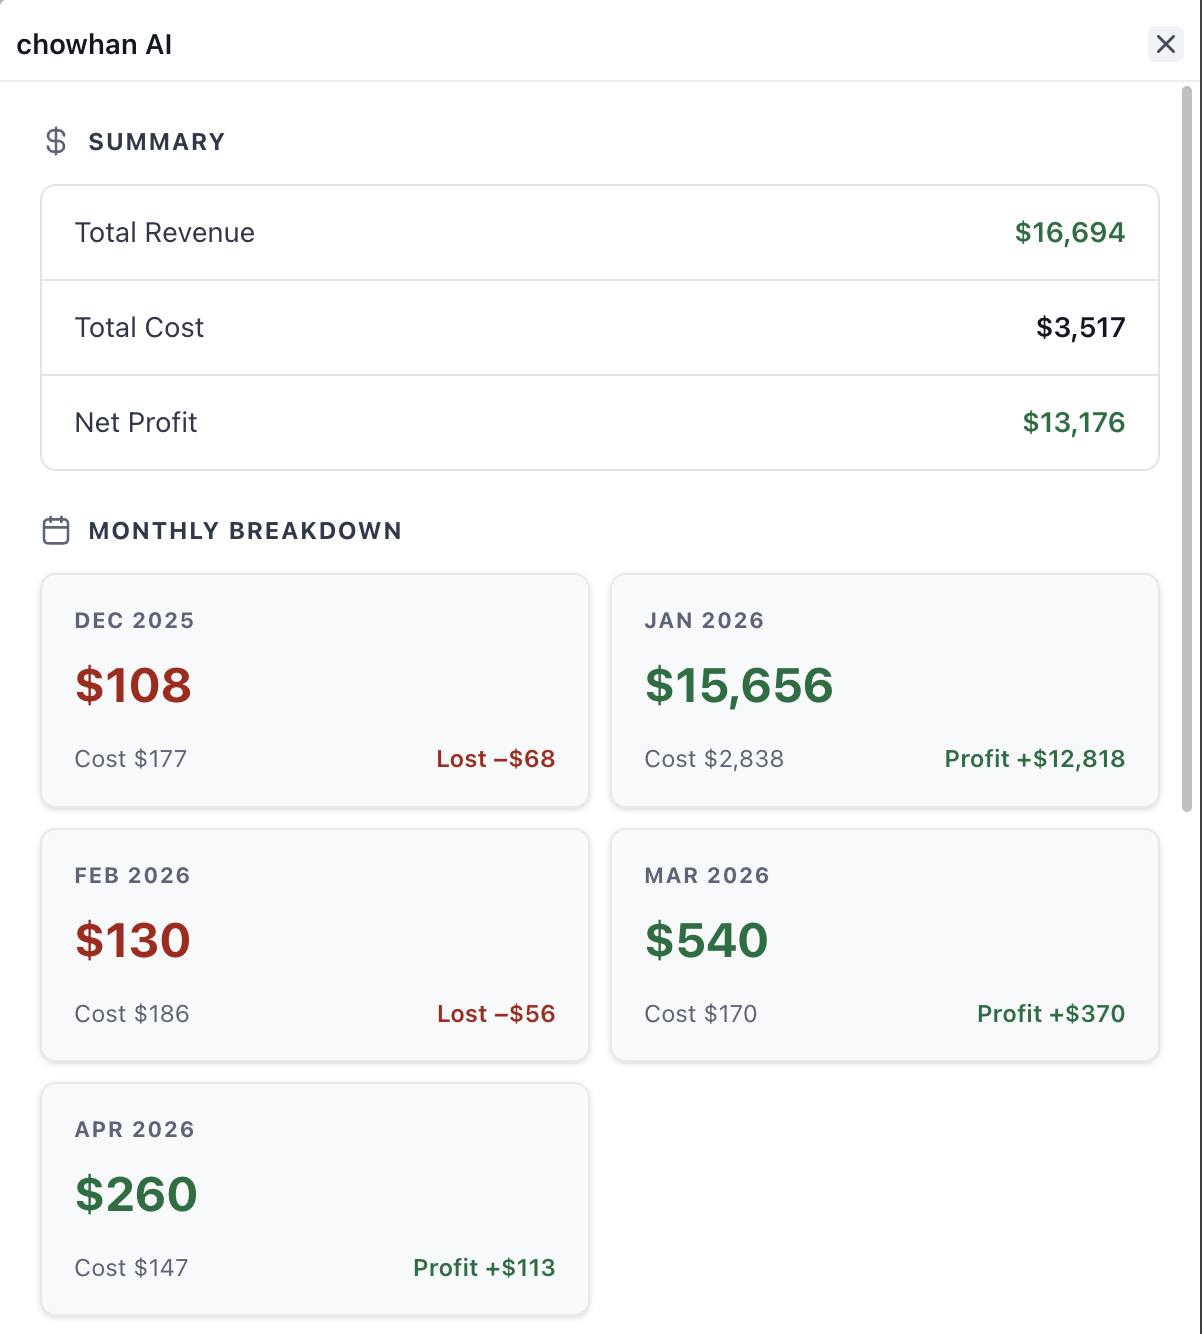
Clicking any row opens a detailed view for that location. The detail page shows product level revenue and cost, monthly trends and, where supported, buttons to adjust pricing, markup or other reselling settings directly from the reporting screen.
03How businesses use Location Level Breakdown widget
- Digital marketing agency. The agency opens the widget, applies a relevant date range, and sorts by profit margin. It identifies low margin locations and clicks those rows to adjust markup settings in the detail view.
- SaaS reseller. The reseller selects the Subscription Products view, filters to a single client account and exports the table. The CSV is shared with the finance team to reconcile billing against vendor costs.
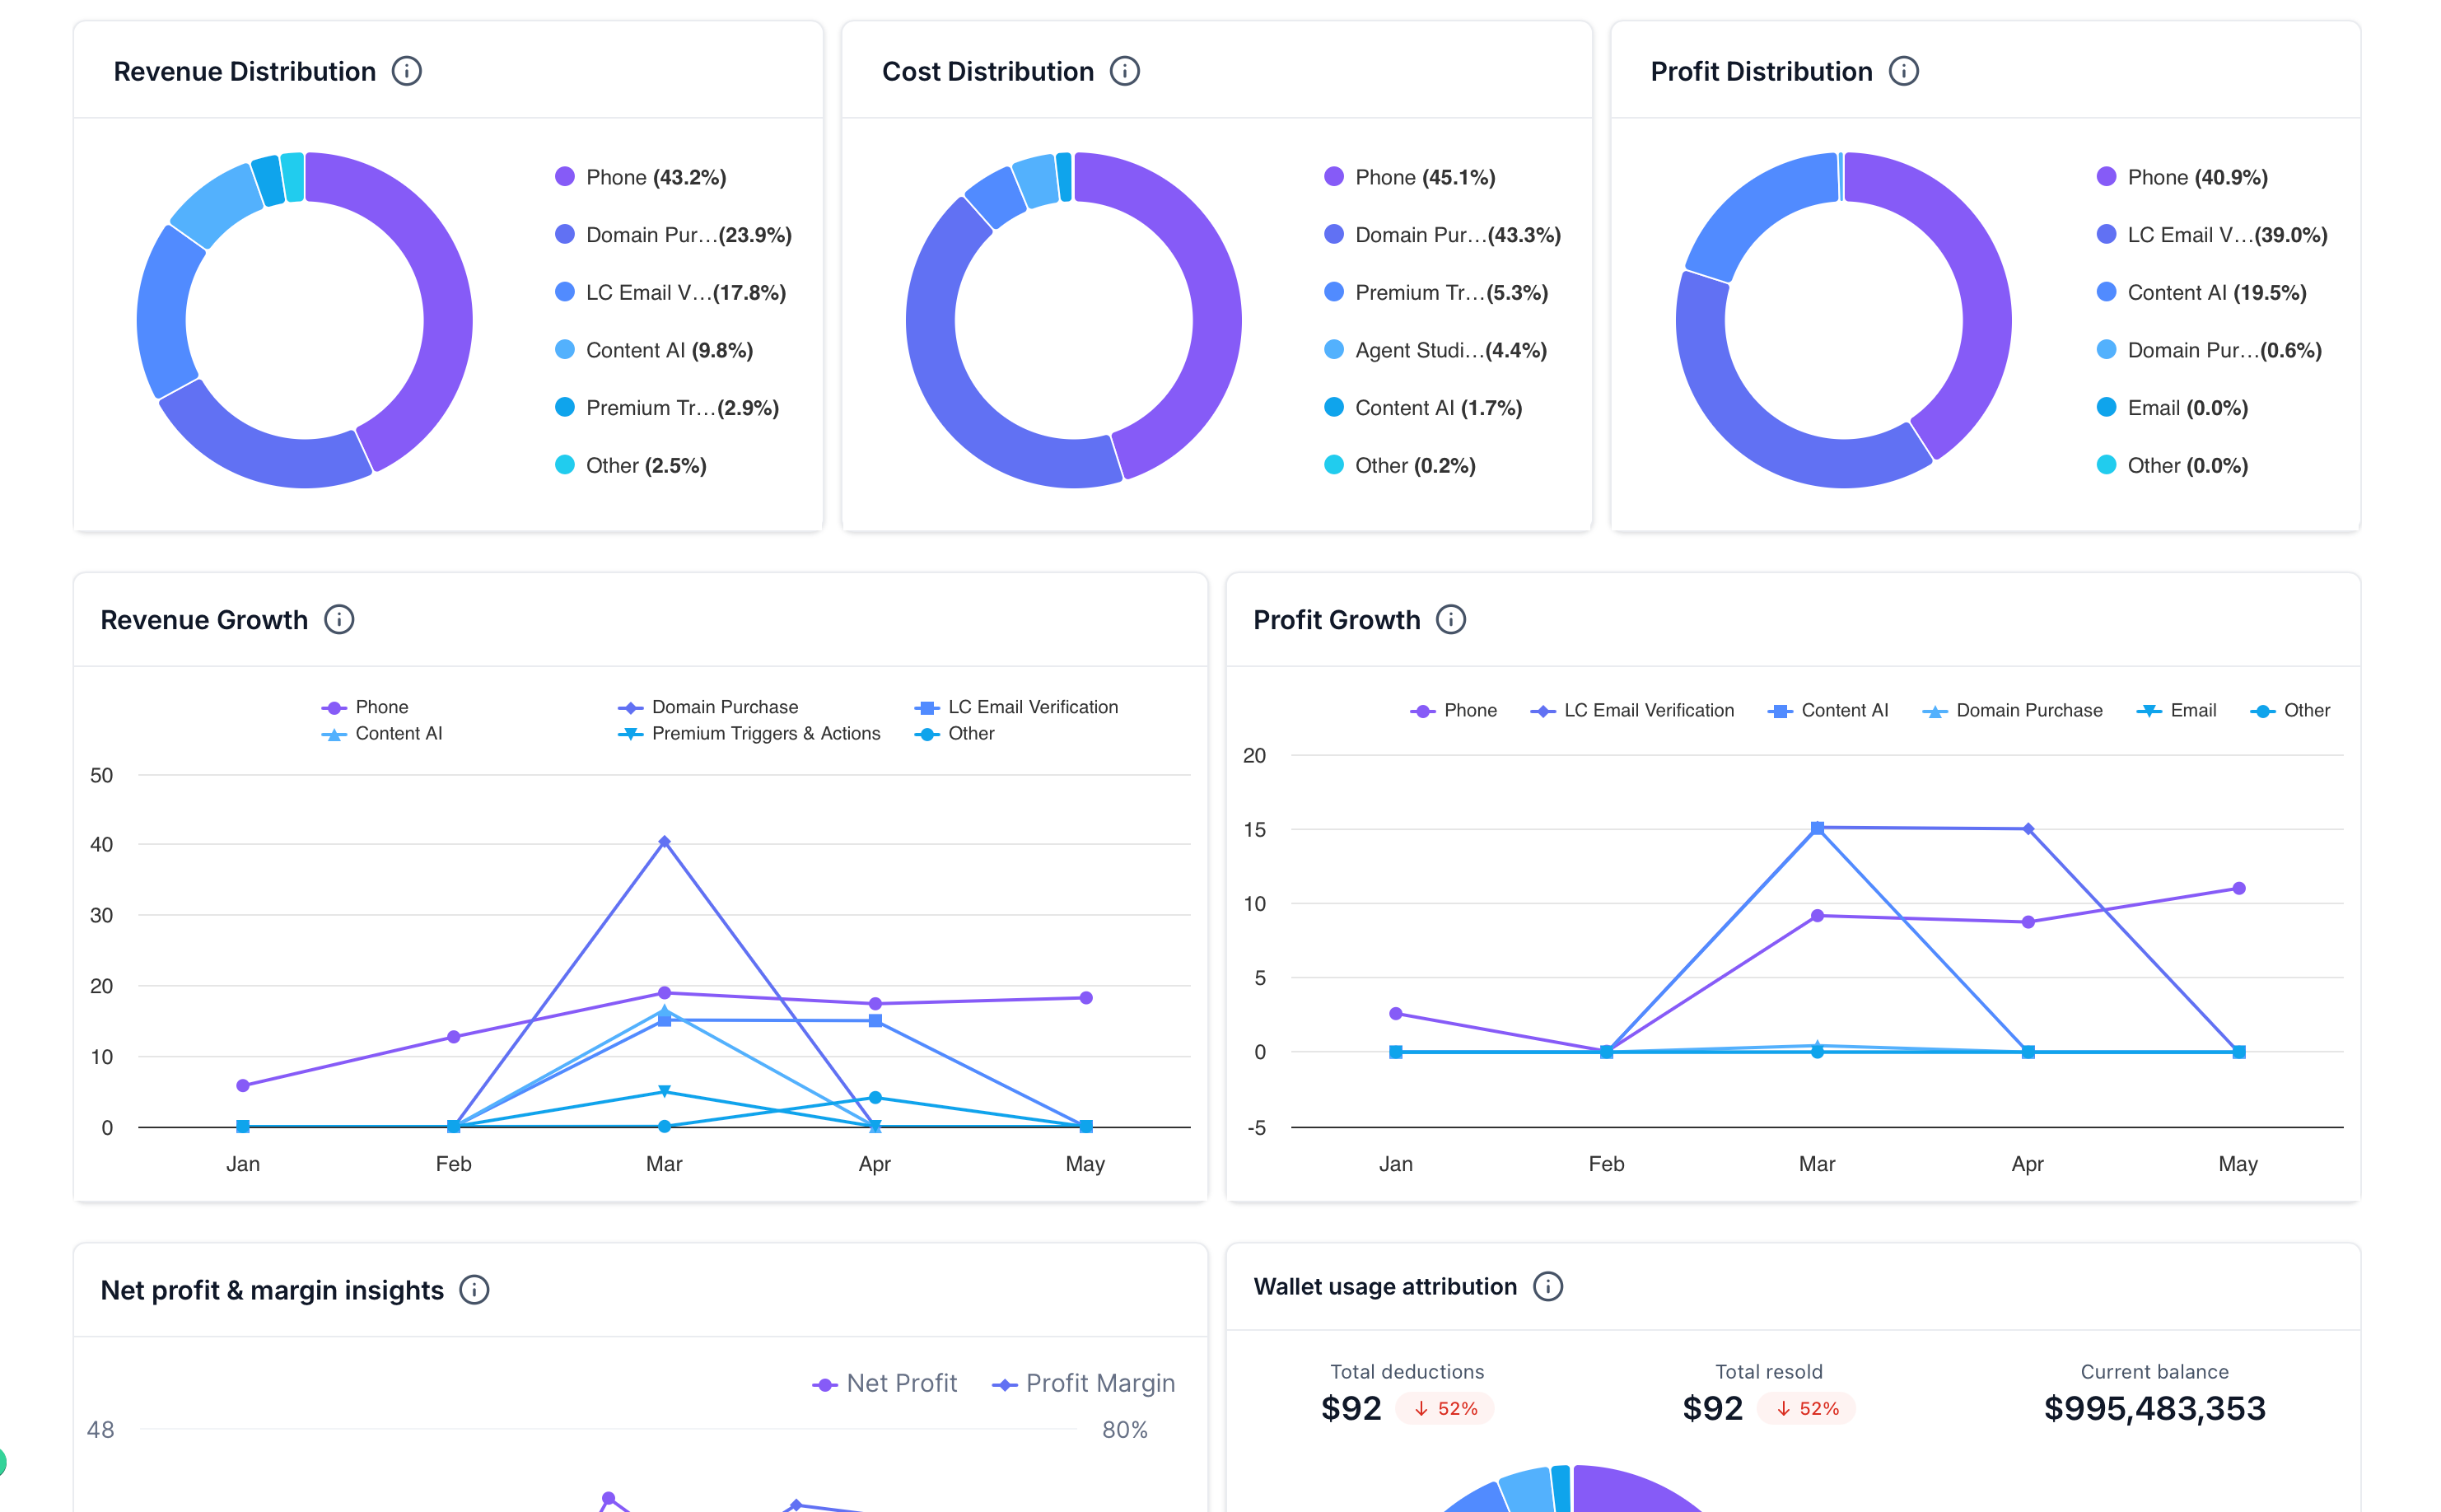
- Telecom reselling firm. The firm uses the Usage Products view, enables the "Include Only Resold Transactions" filter, and reviews the cost distribution graph to spot usage categories where costs exceed revenue.
04The numbers and rules that matter
- Filters: Subaccount, Product, Date Range, Include Only Resold Transactions, Export.
05How to set up and use Location Level Breakdown widget in HighLevel
Open the Location Level Breakdown widget in the Agency Dashboard
- Log in to HighLevel in Agency View.
- Go to Agency Dashboard.
- Select the Reselling tab.
- Choose Usage Products or Subscription Products, depending on the product type you want to review.
06What it looks like in HighLevel
07Settings that matter
- Subaccount Filter. Limits the table to the selected client locations.
- Product Filter. Shows data for all products or narrows the view to specific product categories.
- Date Range Filter. Sets the reporting period for revenue, cost and profit calculations.
- Include Only Resold Transactions. When turned on, the widget counts only transactions that have been resold to clients.
- Export. Downloads the current table data as a CSV file for offline analysis.
08If something goes wrong
- A subaccount does not appear in the table. Check that the subaccount has activity that matches the selected filters and date range.
09How it connects to the rest of HighLevel
- See all reselling product features All Reselling Products
- How to retry a failed payment for any reselling product Retry failed payment
- In app cancellation of resold add on subscriptions Cancel resold subscriptions
Michael's take

The widget can feel overwhelming if you let every subaccount line distract you. When you focus on locations that are clearly undermargin, the insight can be useful. Adjusting pricing or markup from the detail view gives you a way to address low margin locations.