
01Who this is for
- Agency administrators who need to monitor outbound SMS health and catch delivery issues early.
- Founders of small businesses that rely on SMS for customer communication and want to track opt out trends.
- Marketing teams that run campaigns and workflows and require source level performance insight.
02Messaging analytics, explained
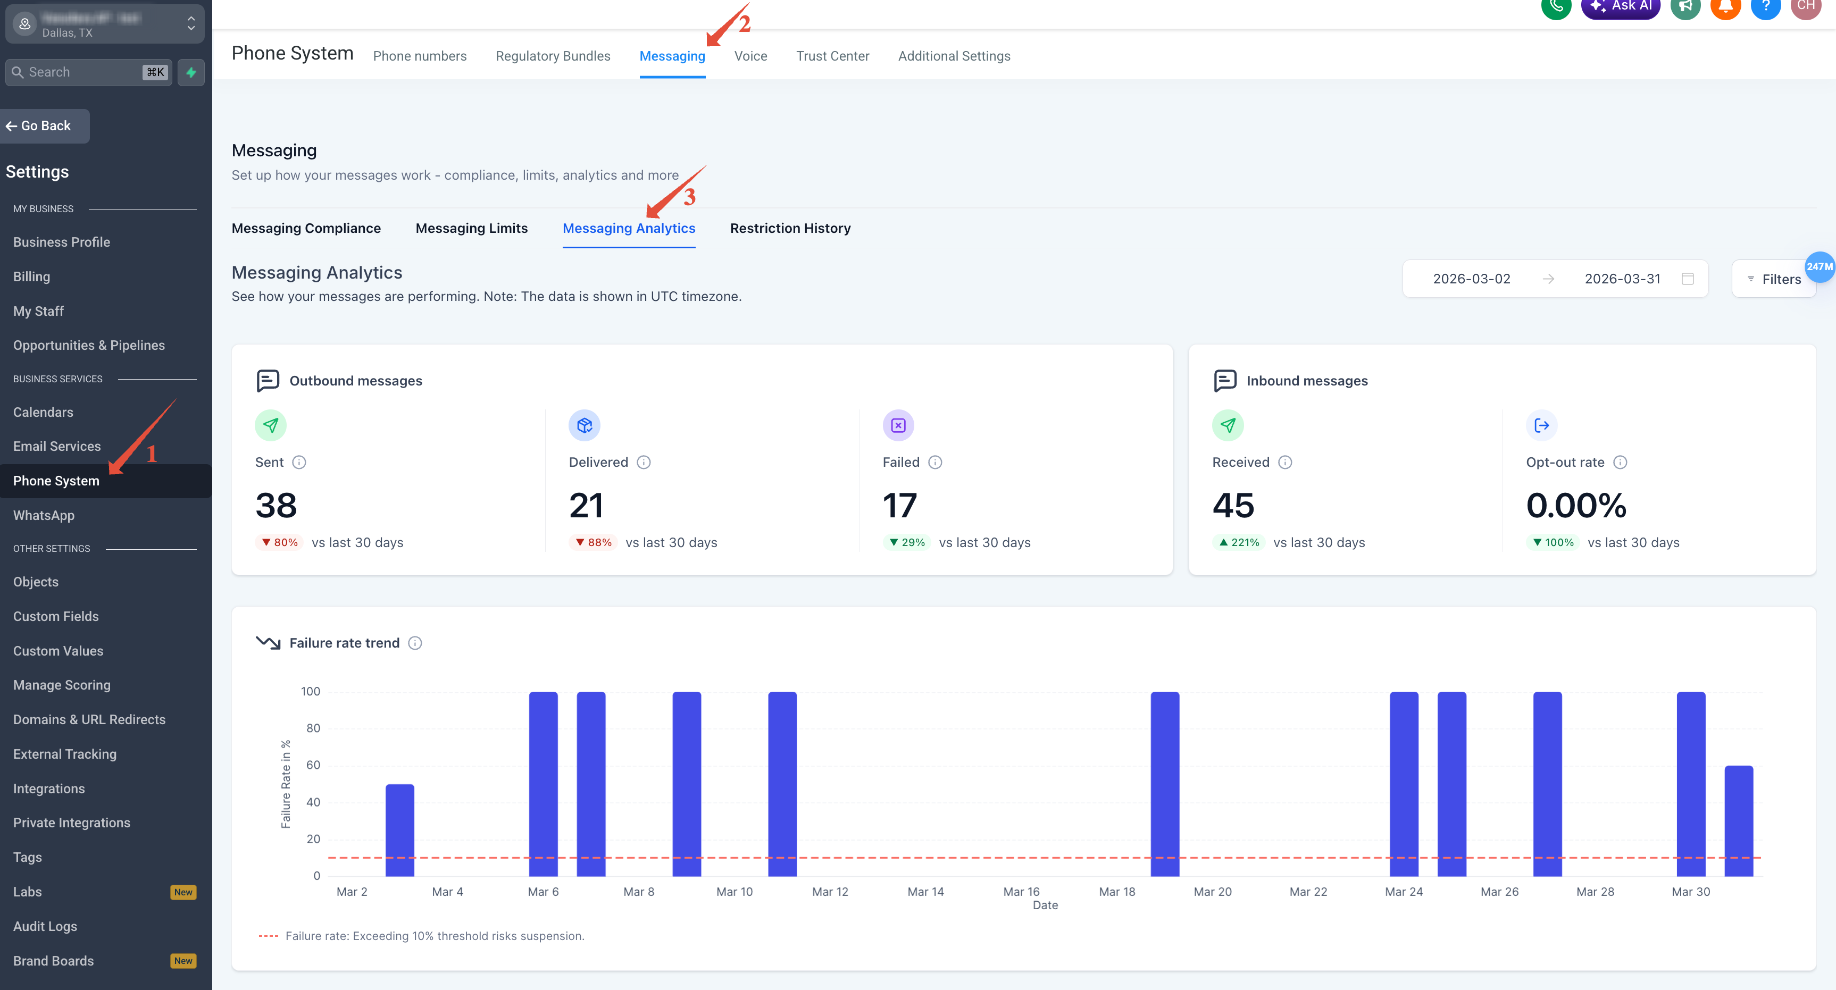
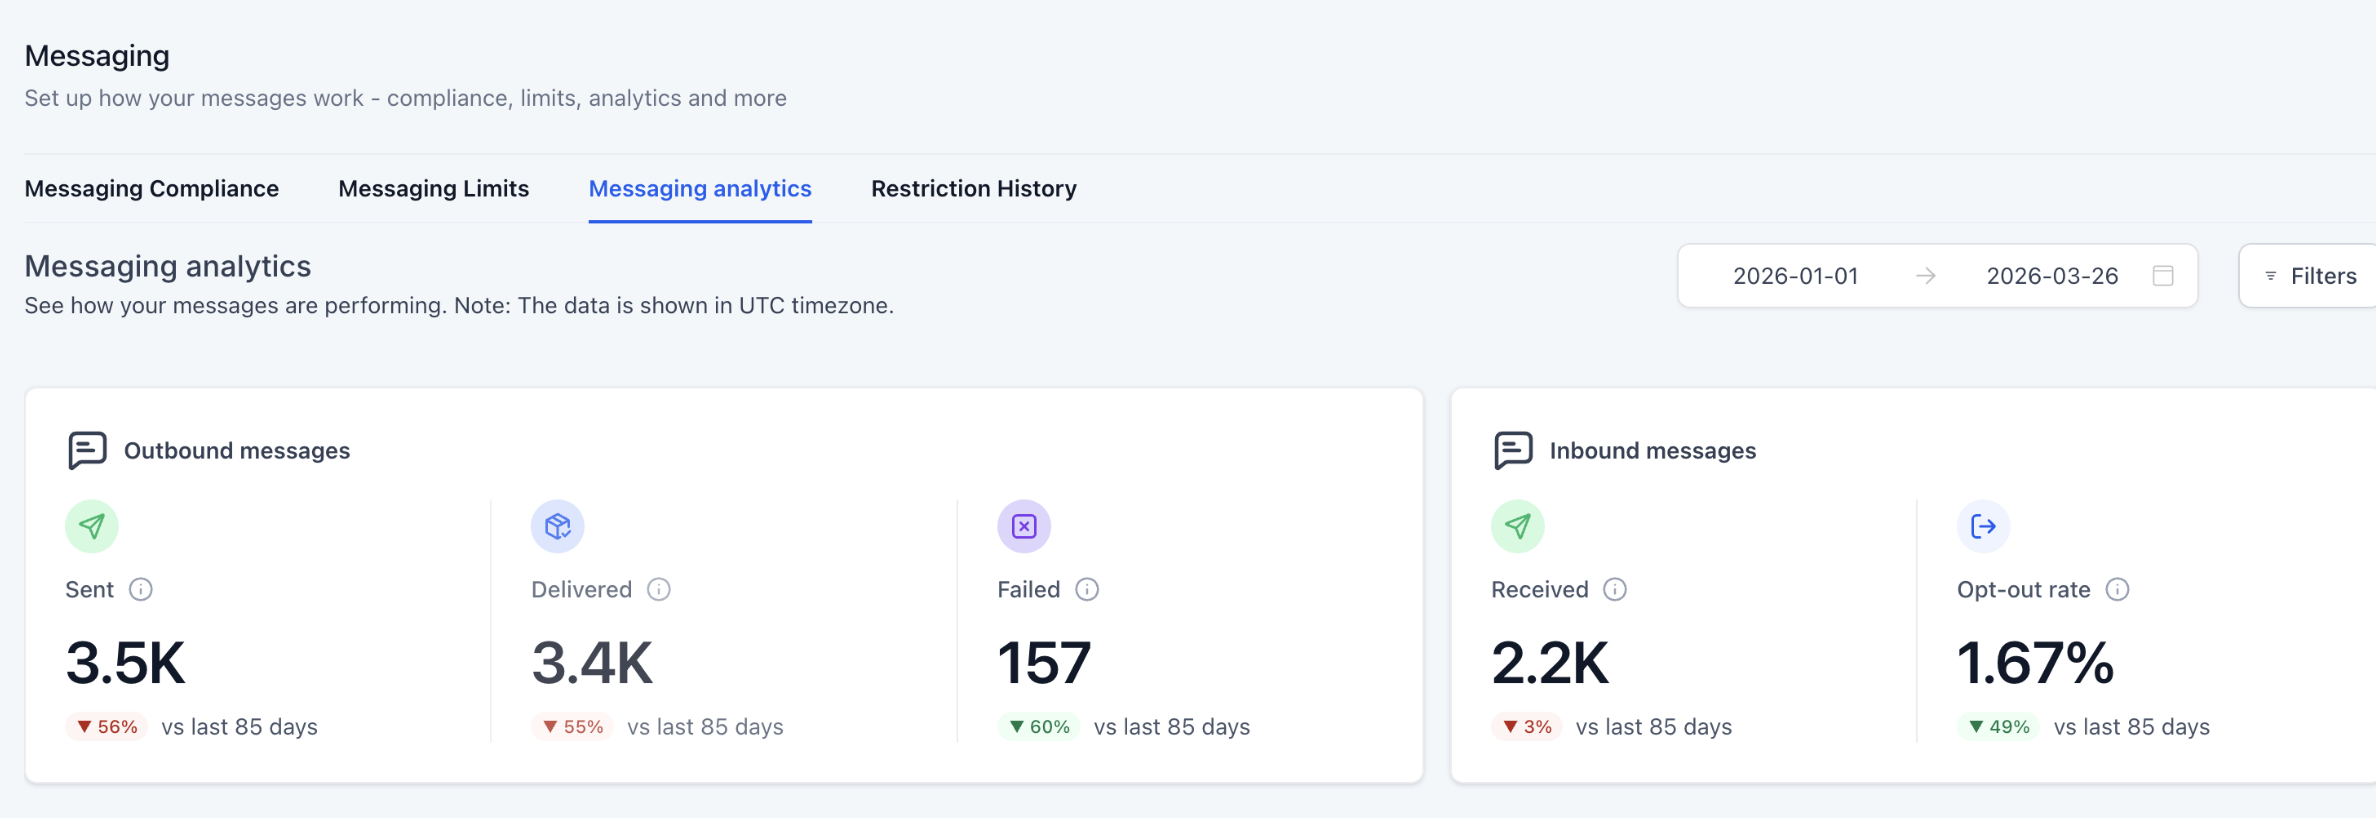
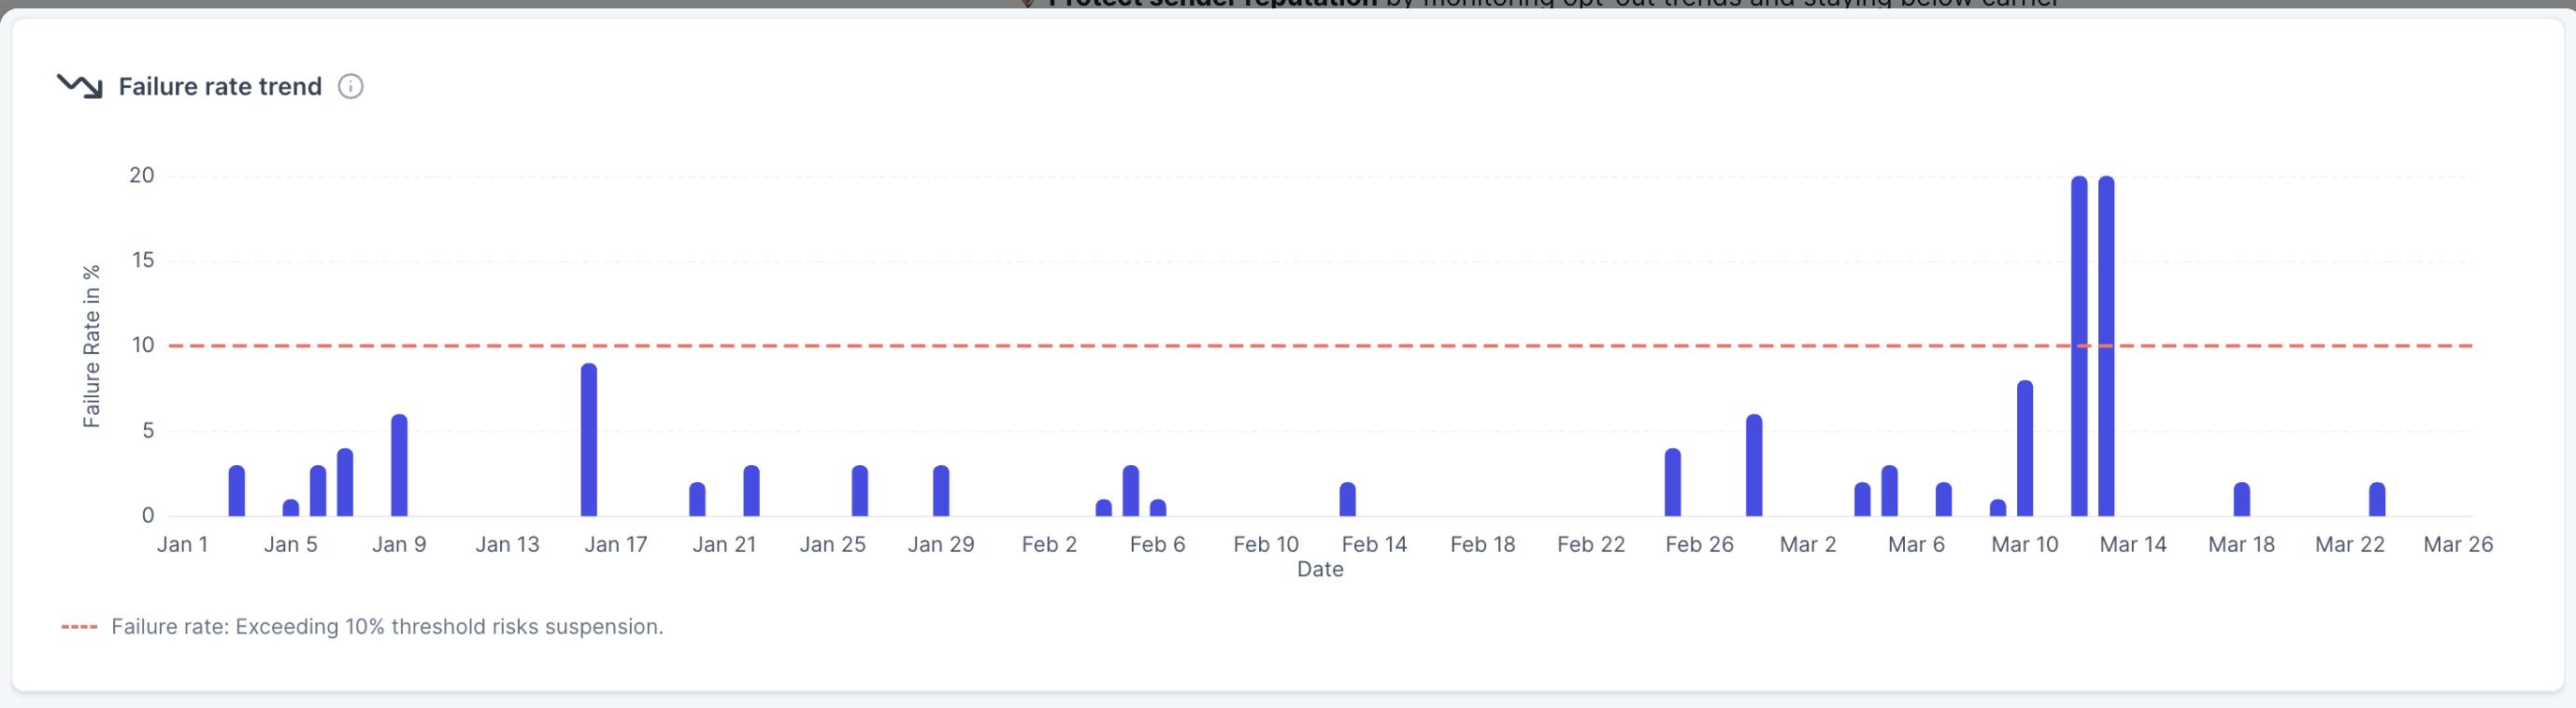
Messaging Analytics lives in the Phone System settings of HighLevel. It presents five summary cards, Sent, Delivered, Failed, Received and Opt Out Rate, each linked to detailed logs. The dashboard also includes comparison indicators for the current period versus the previous period, and three trend charts that visualize failure rates, failure reasons and opt out rates over time.
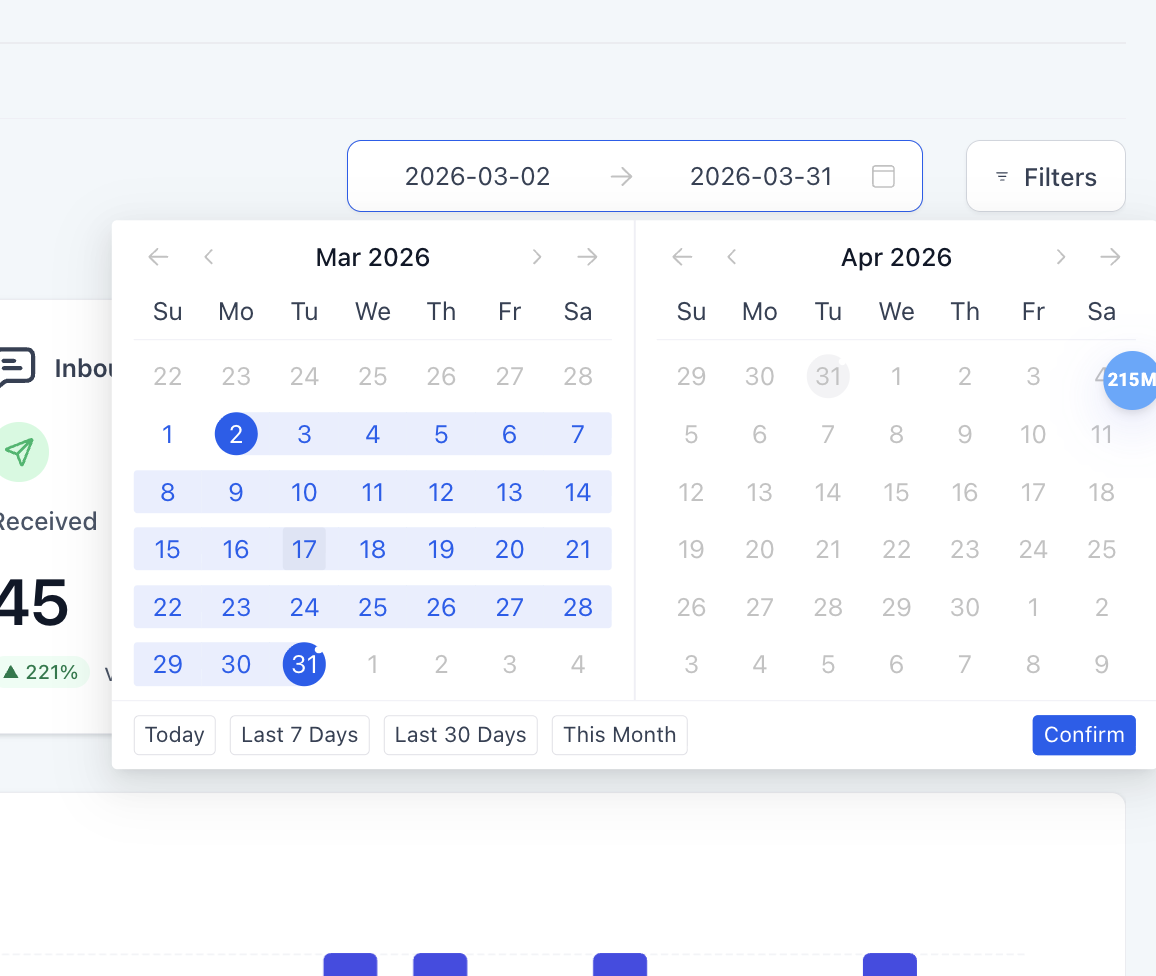
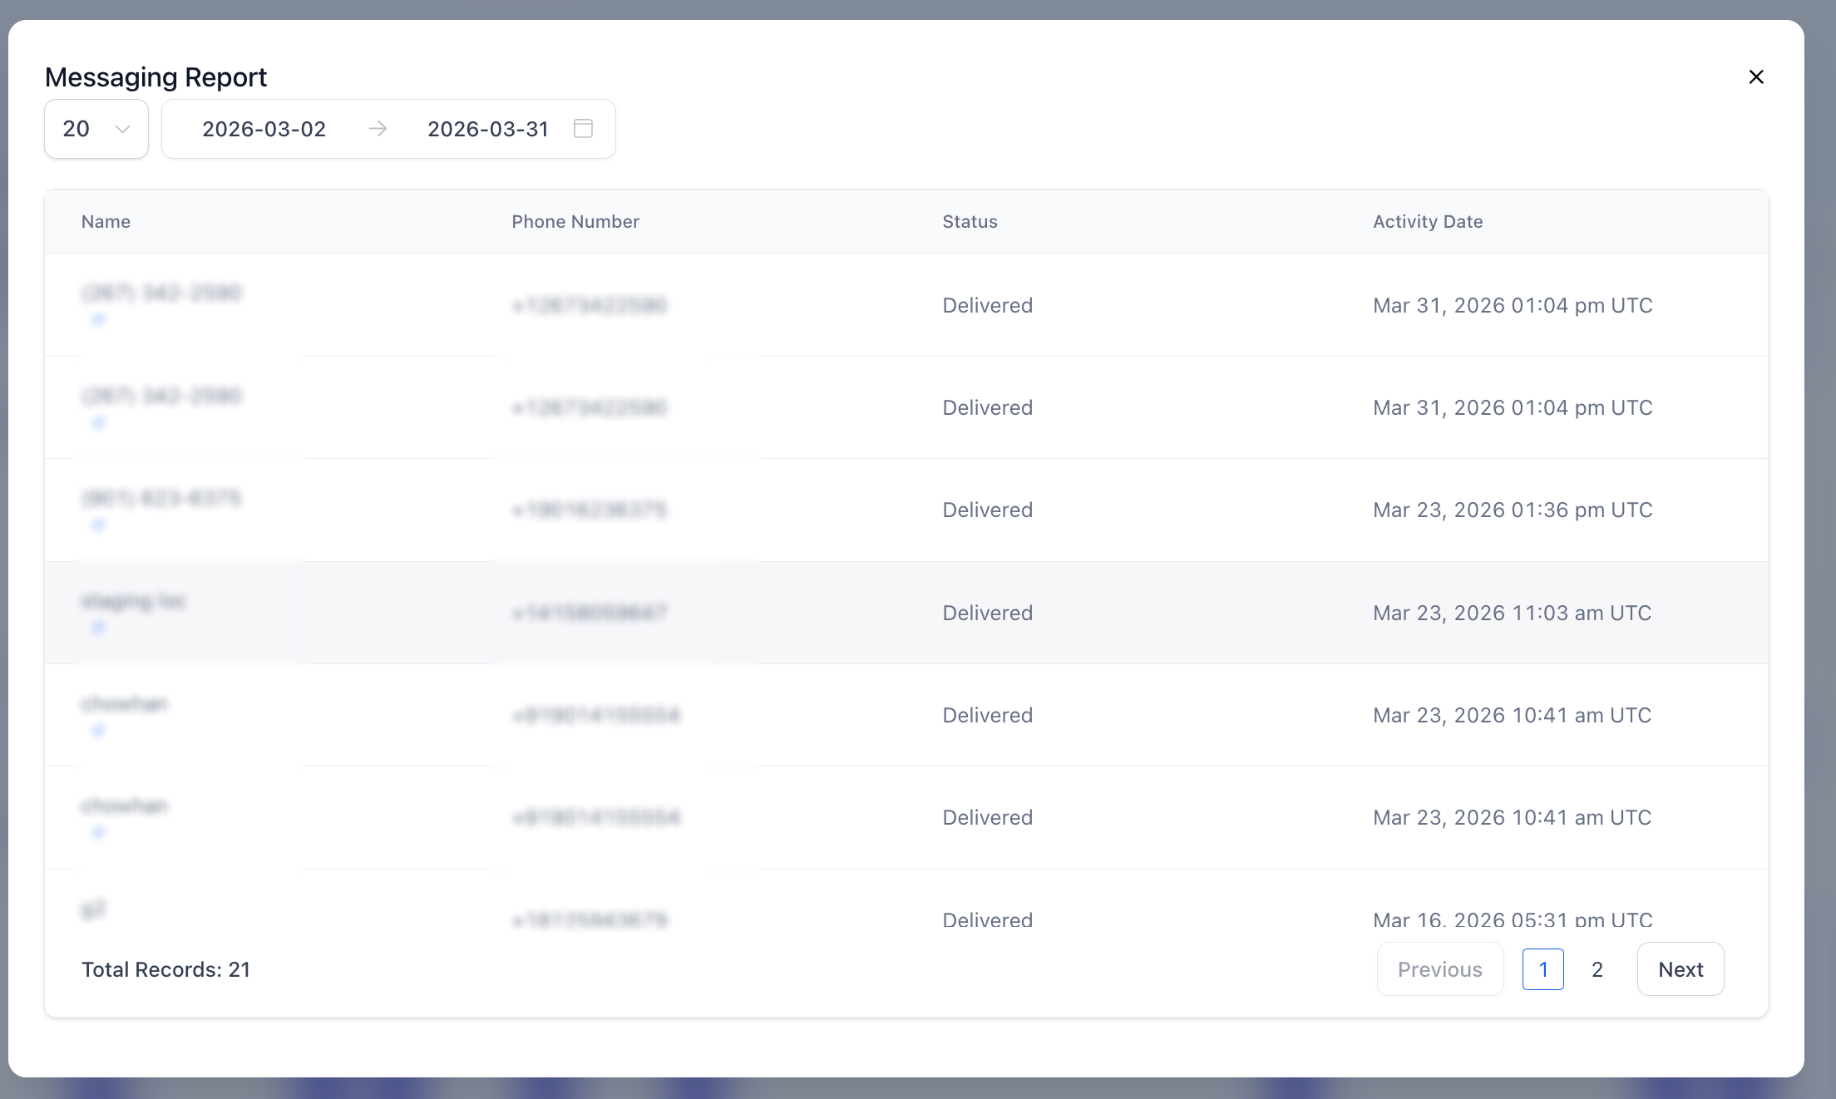
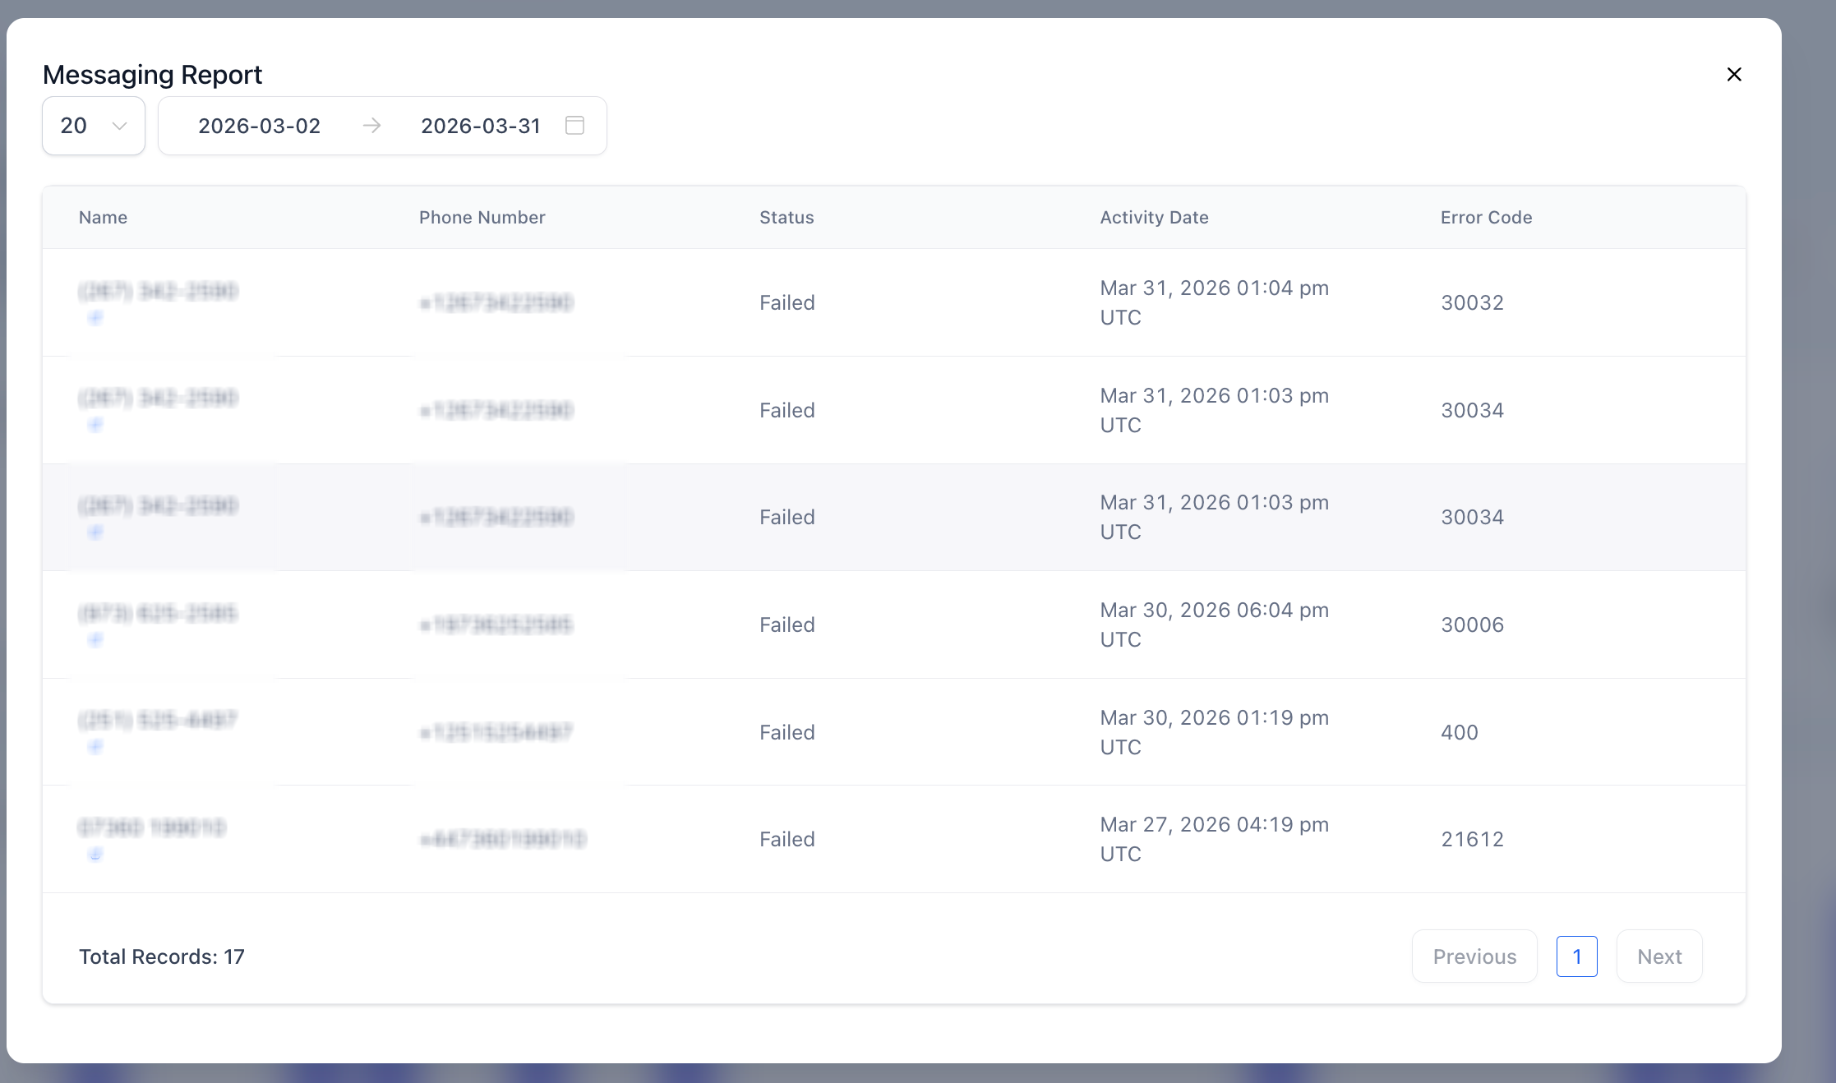
Users can set a date range, defaulting to the last 30 days and extendable to 90 days. They can also apply source filters (All, Campaign, Workflow, Bulk Request) to isolate activity from specific messaging origins. Clicking any summary card opens a modal with contact name, phone number, status, activity date and error code for each message.
03How businesses use messaging analytics
- Marketing agency. The agency opens Messaging Analytics, selects the Campaign source filter, and reviews the Failure Reason Breakdown to pinpoint why client messages are not delivering. It then clicks the Failed card to see error codes and updates contact lists accordingly.
- Real estate office. The office accesses the dashboard, sets the date range to the past 60 days, and checks the Opt Out Rate chart. If the rate spikes, it examines the inbound messages in the detailed logs to adjust follow up cadence.
- Healthcare clinic. The clinic opens Messaging Analytics, uses the All source filter, and compares the current period’s Delivered count against the previous period. It drills into the Received card to view patient reply volumes and ensure two way communication is functioning.
04The numbers and rules that matter
- Default Reporting Period, Last 30 days.
- Maximum Date Range, Up to 90 days.
- Detailed Logs. Include contact name, phone number, status, activity date, error code.
- Failure Rate reference line, 10% reference line on the Failure Rate Trend chart.
- Opt Out Rate reference line, 2% marker on the Opt Out Rate Trend chart.
- Error 30007 is no longer a top level summary metric; it appears in failed message details.
05How to set up and use messaging analytics in HighLevel
Access Messaging Analytics
- Open Settings in the HighLevel platform.
- Select Phone System.
- Choose the Messaging tab.
- Click Messaging Analytics.
- Pick a date range, defaulting to the last 30 days, or extend up to 90 days.
- Apply a Messaging Source filter such as All, Campaign, Workflow or Bulk Request.
06What it looks like in HighLevel
07Settings that matter
- Date Range. Controls the reporting period shown on the dashboard, defaulting to the last 30 days and allowing up to 90 days.
- Messaging Source Filters. Limits the data displayed to messages from a specific origin, All, Campaign, Workflow, or Bulk Request.
08Things to know before you rely on it
- The default reporting period is the last 30 days; the maximum selectable range is 90 days.
- Opt Out Rate is hidden when a source filter other than All is applied.
- Failure Rate and Opt Out markers are reference lines (10% and 2%) and do not trigger automatic policy actions.
- Error 30007 is no longer a top level summary metric; it appears in the Failed message details.
09If something goes wrong
- Dashboard shows less activity than expected. Check the selected date range and set the source filter to All, then expand the period if needed.
- Opt Out Rate is missing. Return the Messaging Source filter to All, as the metric is only shown for the overall view.
- Failure Rate is high. Open the Failure Reason Breakdown, then click the Failed metric to review individual error codes and address the most common cause.
- Error 30007 appears in Failed Messages. Review message content, sender identification, consent and carrier compliance requirements before retrying.
- Failure or Opt Out trends stay above the dashboard marker. Investigate message sources, error codes and list quality, and consult the LC Phone Messaging Policy before resuming high volume sends.
10How it connects to the rest of HighLevel
- Explore pricing and rebilling details for the HighLevel phone system. Pricing guide
- Learn how to configure SMS compliance settings, including opt out handling. SMS compliance
Michael's take

Most people think the dashboard itself will stop a bad campaign. The analytics only tell you what happened; they don’t enforce limits. I would first look at the failure rate trend, click the Failed card and chase the top error codes before deciding whether to pause anything.