
01Who this is for
- Marketing agencies can monitor client LinkedIn ad results across multiple accounts and report on key metrics.
- SaaS Founders can track lead generation performance to evaluate acquisition costs.
- Local service businesses can review website traffic campaign data to see how ad spend drives site visits.
02LinkedIn statistics, explained
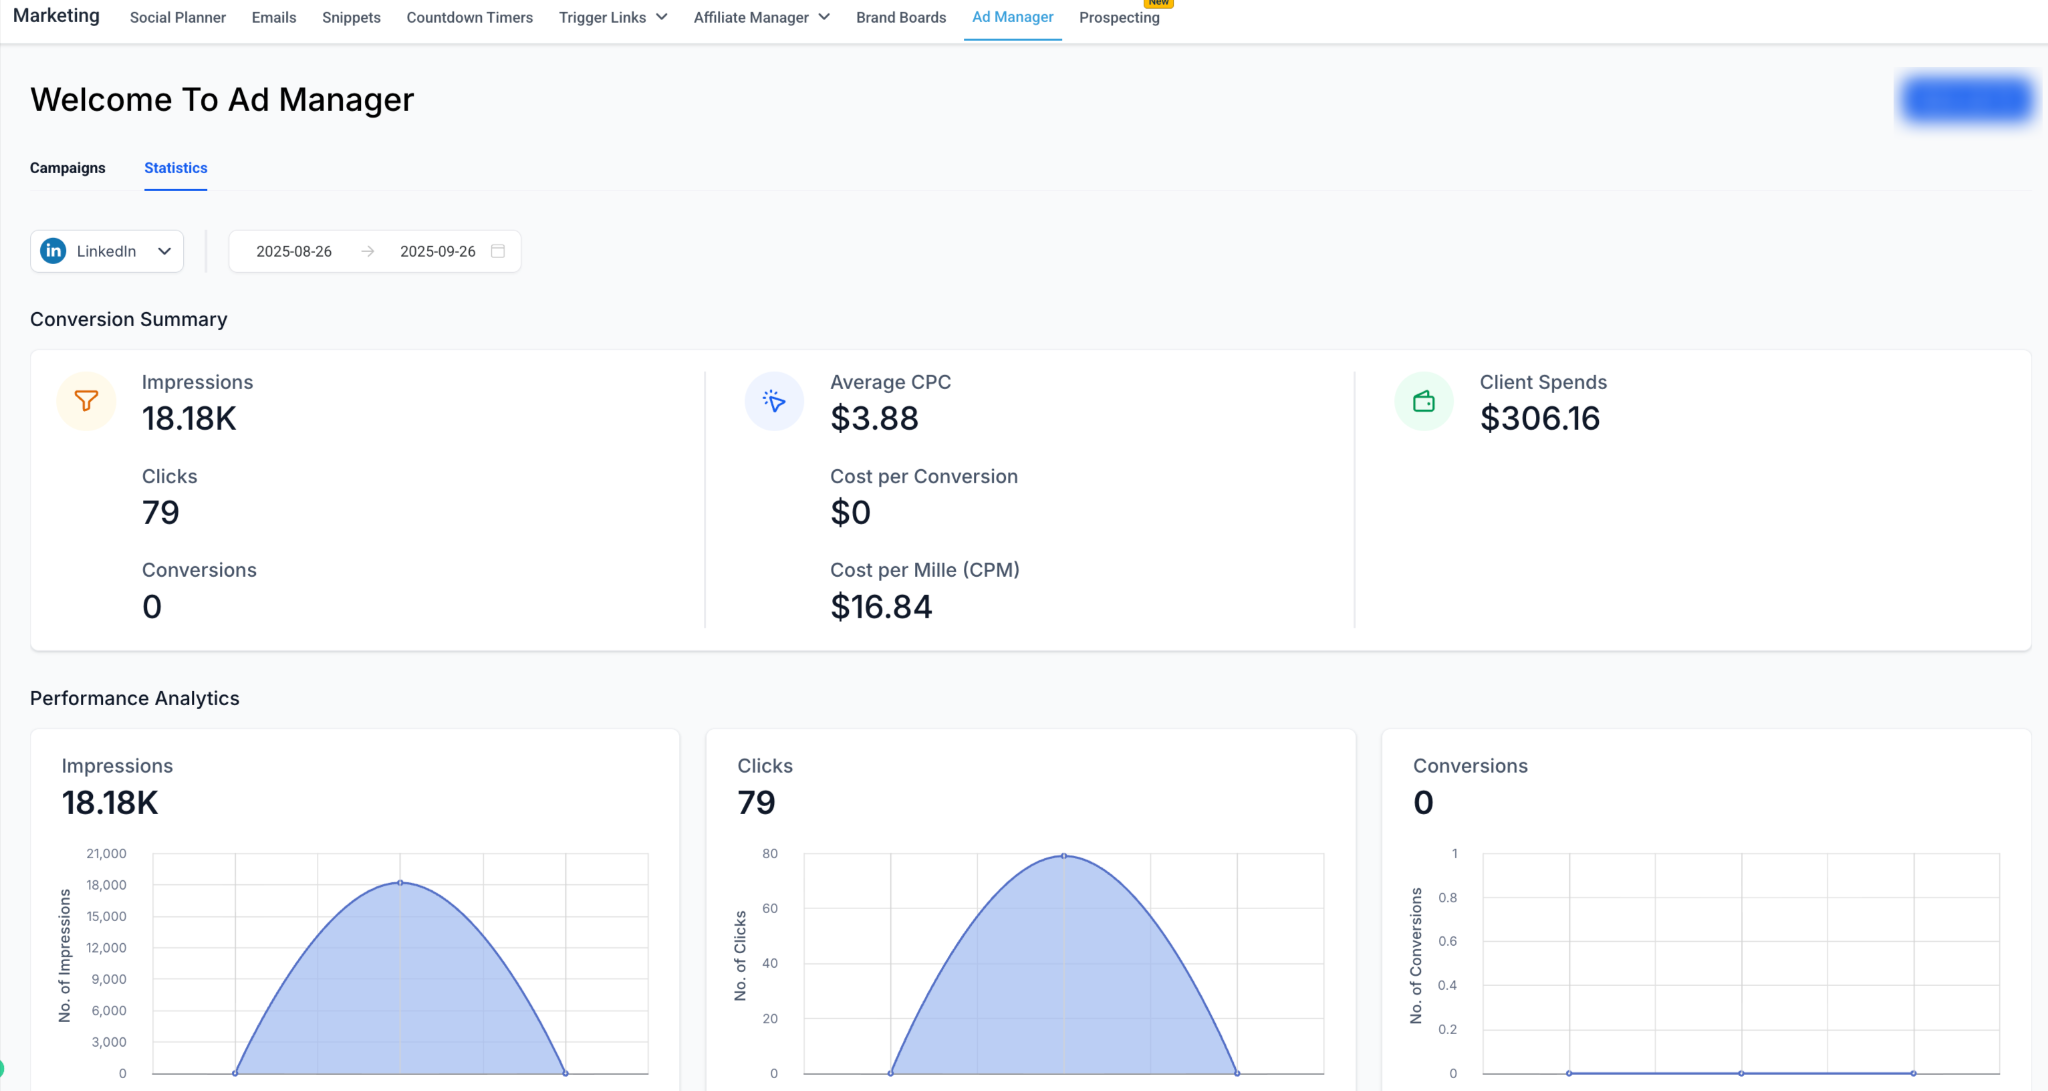
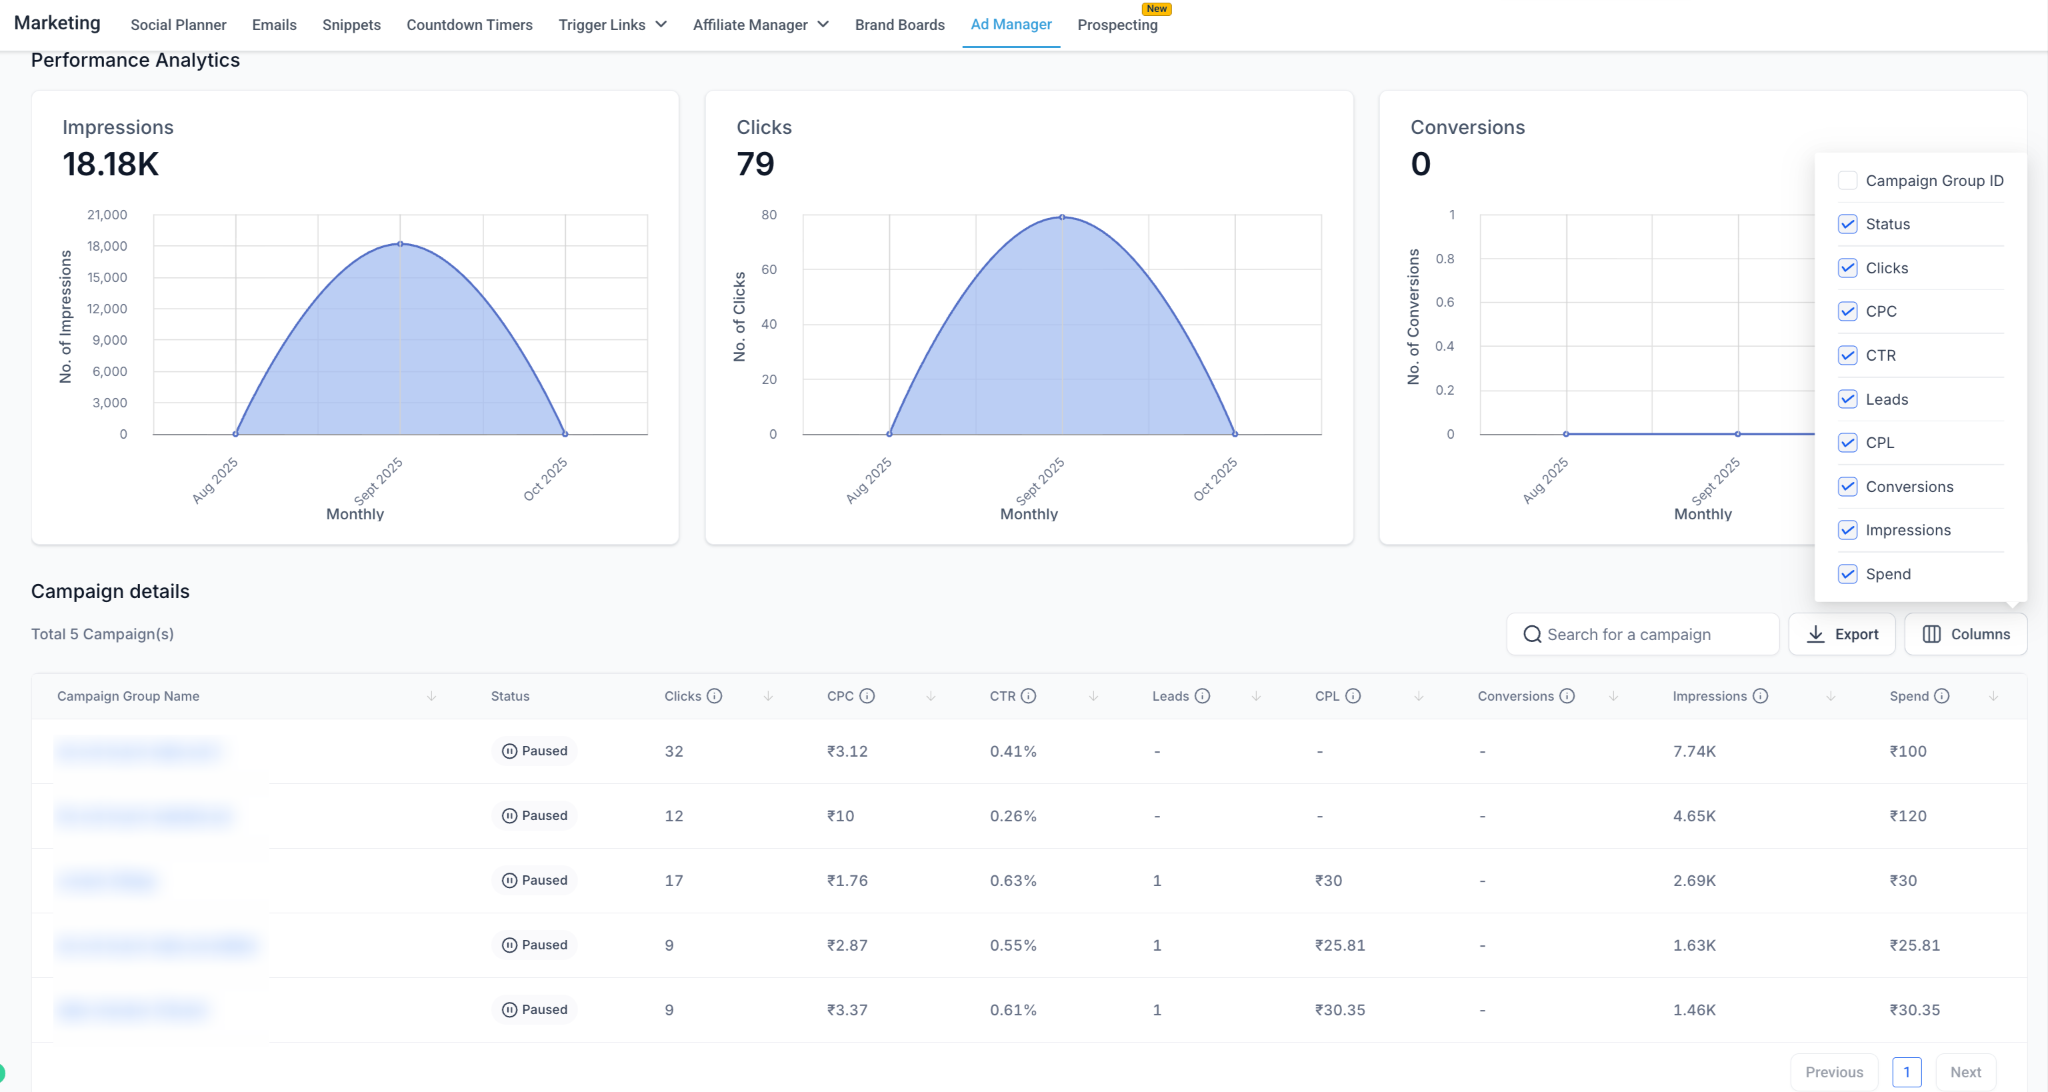
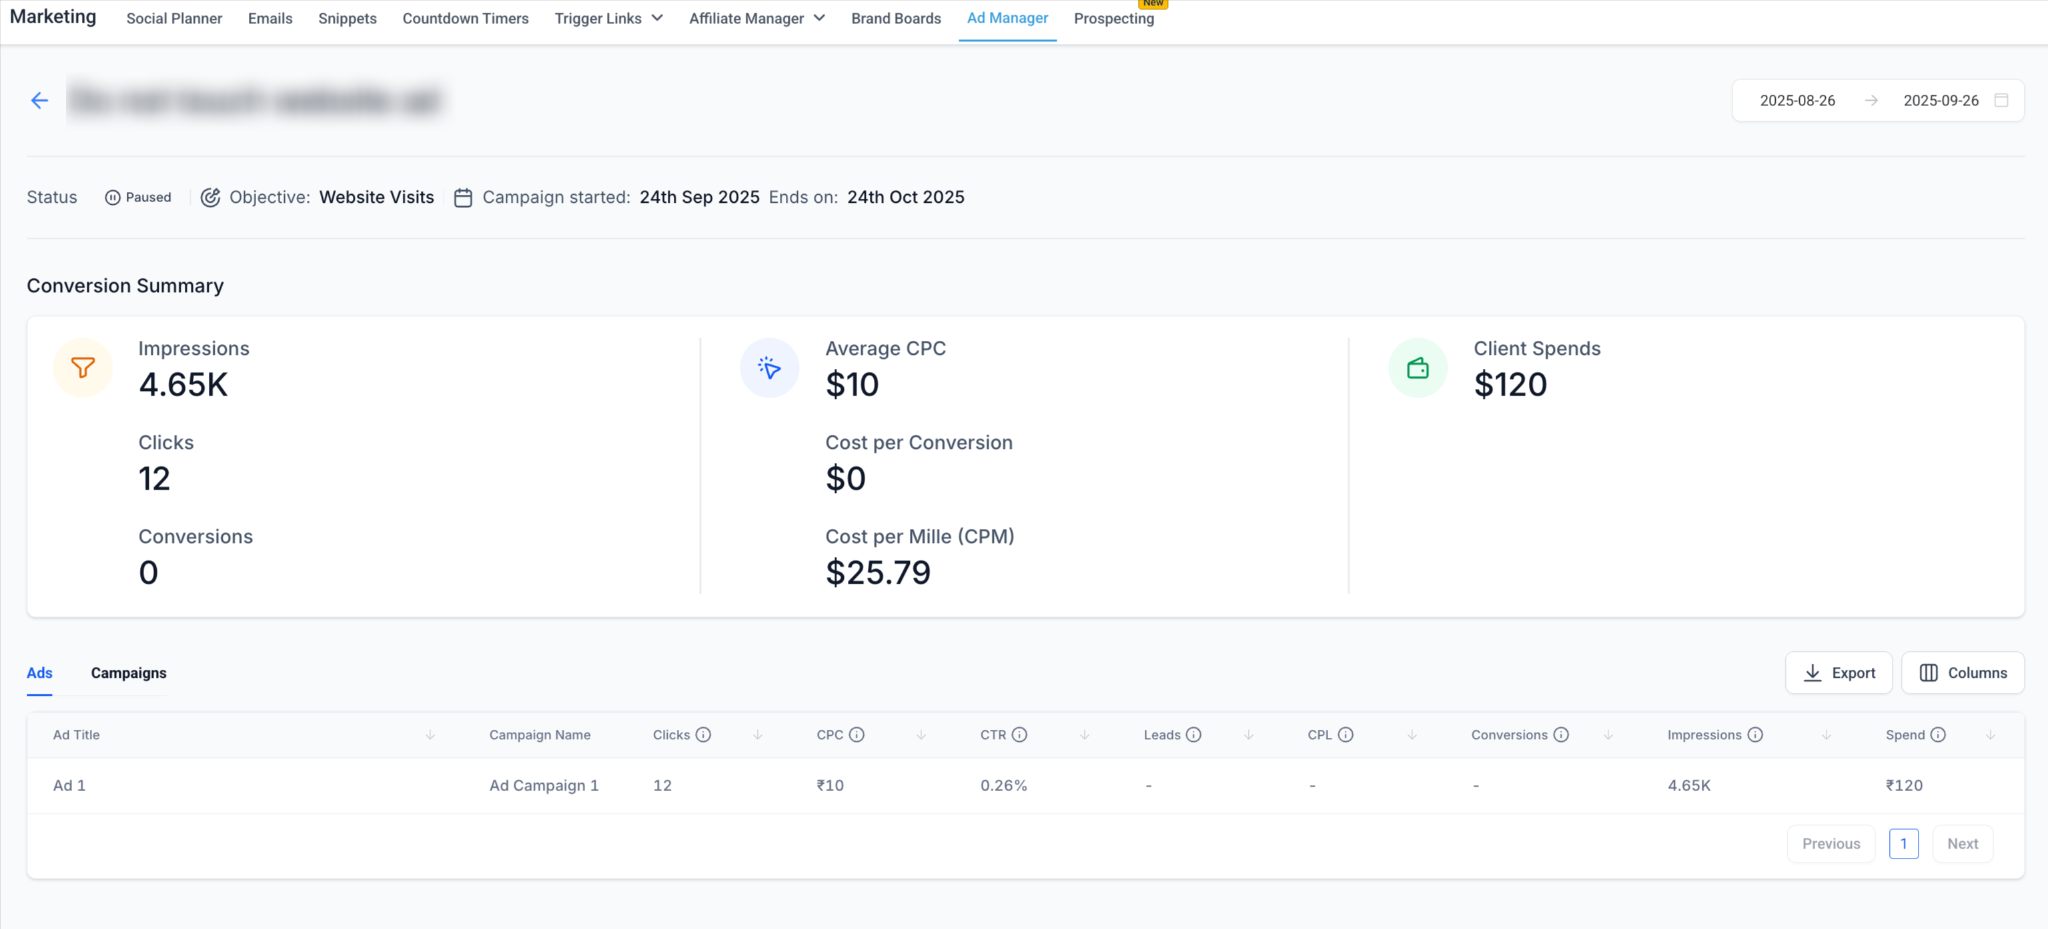
The feature lives inside the Ad Manager module under the Statistics tab. It pulls data from LinkedIn campaigns and presents it alongside Meta and Google results. Users can select LinkedIn from a platform dropdown, set a custom date window, and explore three hierarchy levels, Campaign Group, Campaign and Ad. Each level shows a table with standard metrics such as impressions, clicks, spend, CPC, CPM, leads and conversion figures where applicable.
Metrics differ by campaign objective. Lead generation ads expose lead counts, cost per lead and form related numbers, while website traffic ads highlight clicks, click through rate, CPC, CPM and, when conversion tracking is active, conversion totals and cost per conversion. Graphs illustrate trends over the chosen period, a Columns button lets users adjust the displayed fields, and an Export button creates spreadsheets for deeper analysis.
03How businesses use LinkedIn statistics
- Digital marketing agency. The agency opens the Statistics tab, selects LinkedIn, and drills from a campaign group to individual ads to compare performance across clients. It customizes columns to show cost per lead for lead generation campaigns and exports the tables for client deliverables.
- SaaS startup. The startup accesses the LinkedIn view, picks a date range that matches its recent launch, and reviews the leads and cost per lead metrics to gauge acquisition efficiency. It checks the status column to confirm ads are active and not stuck in review.
- Local service provider. The provider selects the website traffic objective, observes clicks and CPM trends over the last week, and adjusts budgeting based on spend pacing. It uses the export button to share a spreadsheet with the business owner.
04The numbers and rules that matter
- Metrics: Impressions, Clicks, Conversions, Spend, Average CPC, Average CPM, Cost per Conversion, Leads, Cost per Lead (CPL).
05Before you start
- The LinkedIn campaign must be live and delivering impressions.
- Select a date range that includes periods with campaign activity.
- Ensure conversion tracking is set up if conversion metrics are needed.
06How to set up and use LinkedIn statistics in HighLevel
View LinkedIn statistics
- Open Marketing > Ad Manager and click the Statistics tab at the top left.
- From the platform selector, pick LinkedIn.
- Choose the desired date range for the analysis.
- Drill down from a campaign group to a campaign and then to an ad to see detailed metrics.
07What it looks like in HighLevel
08Things to know before you rely on it
- Ads shown as In Review will not deliver until LinkedIn approval is received.
- Statistics will be empty if the campaign has not started delivering or the chosen dates contain no activity.
- HighLevel uses the terms Campaign Group, Campaign and Ad, which may map to different names in LinkedIn Campaign Manager.
09If something goes wrong
- Statistics show no data. Check that the campaign is active, that it has started delivering, and that the selected date range includes days with activity.
- Conversion metrics are missing. Verify that conversion tracking is configured for the campaign and that conversions occurred during the selected period.
10How it connects to the rest of HighLevel
- Build LinkedIn lead forms to capture leads for Lead Generation campaigns LinkedIn lead forms
- Set audience targeting to influence the metrics you see in statistics Audience targeting
Michael's take

If the campaigns remain in “In Review” or conversion tracking isn’t set up, the numbers stay empty and the feature adds little value.