
01Who this is for
- Independent developers building custom integrations need to verify that HighLevel sends the correct data to their endpoints.
- Agency engineers who manage client applications benefit from being able to debug webhook issues internally.
- Product teams that rely on downstream services can use the log history to audit message delivery over time.
02Webhook logs dashboard, explained
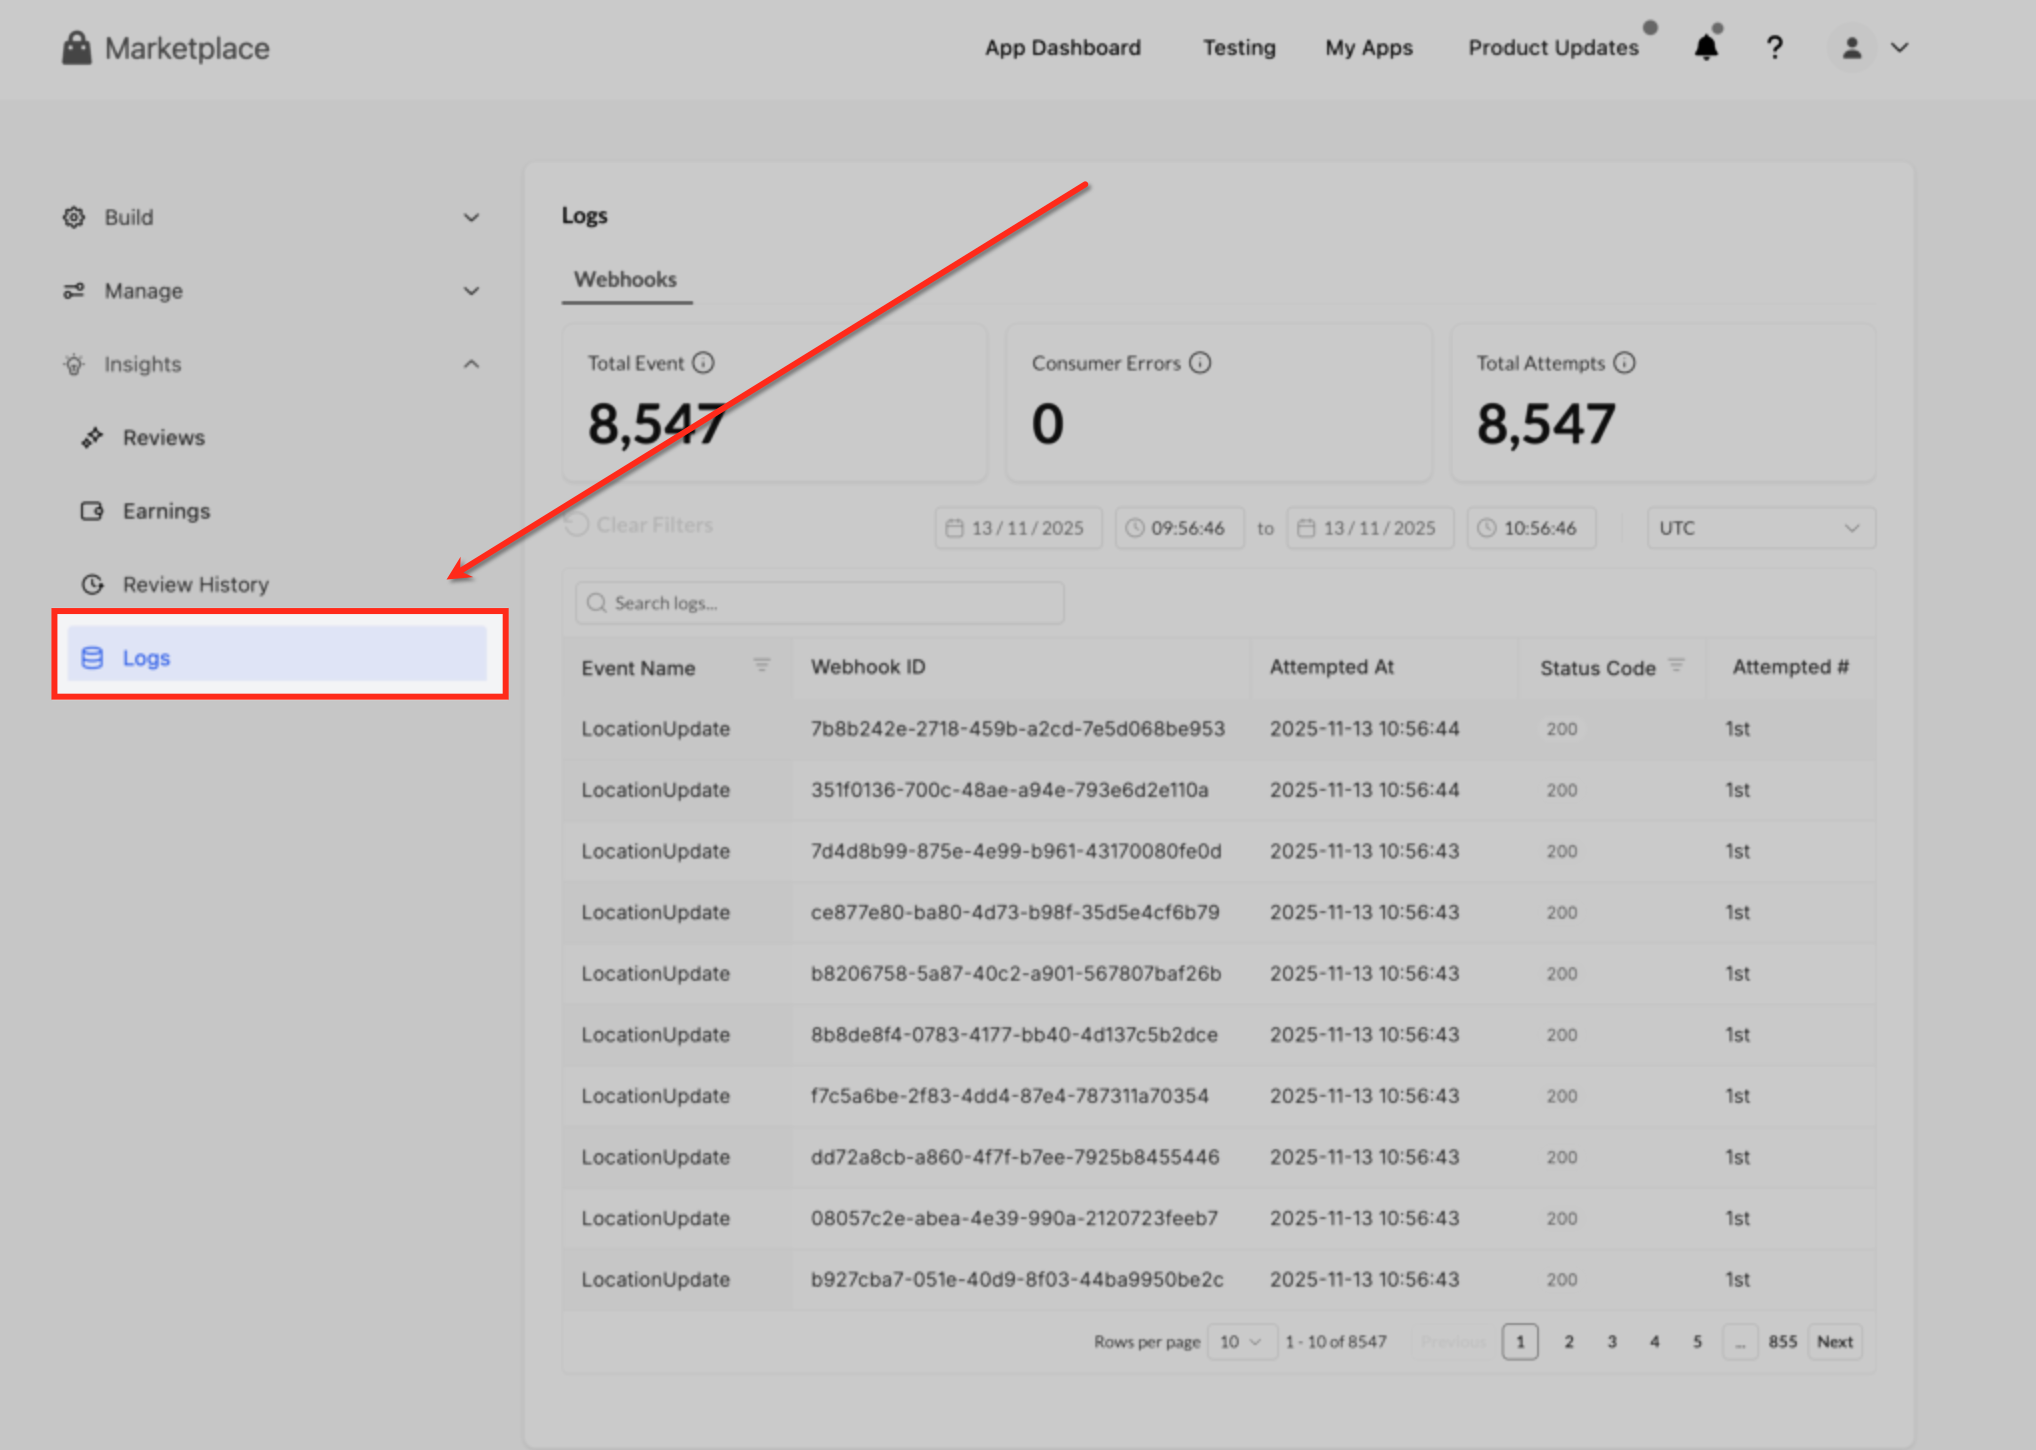
The Webhook Logs Dashboard is found under Developer Portal > Insights > Logs. It records each outbound webhook event, storing the JSON payload, HTTP response, attempt count and timestamps. The interface updates in real time, so new events appear as soon as they are sent.
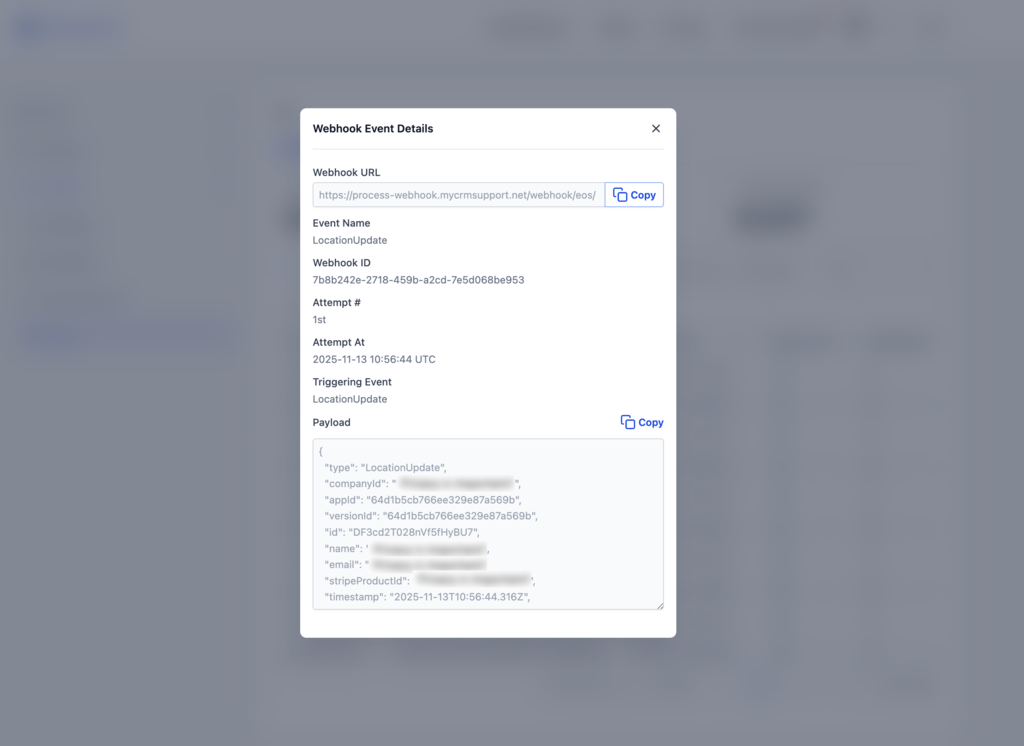
The dashboard provides a global search bar that matches any substring inside payloads, plus filters for webhook ID, event type, time range and status code. Selecting a row opens a detail panel that displays the full payload with a one click copy button, the attempt number, response code and a timeline of creation, delivery and retry events.
Users can set a personal timezone using the selector at the top of the page; the default is Central Time. The dashboard retains logs for 30 days, after which they are permanently deleted.
03How businesses use webhook logs dashboard
- SaaS startup. A developer triggers a test event from the platform, searches the dashboard for the customer email, and opens the detail panel to copy the JSON payload. They paste the payload into Webhook.site to confirm the receiving endpoint parses the data correctly.
- Digital marketing agency. When a client reports missing lead data, the agency searches the logs by the lead’s email address, reviews the response codes for each attempt, and determines whether a 429 rate limit caused retries that eventually succeeded.
- Ecommerce integration partner. The integration team monitors the dashboard after deploying a new order created webhook, filters by the “order.created” event type, and uses the copy button to export the payload for validation in Postman before moving to production.
04The numbers and rules that matter
- 30 day log retention.
- Non 429 failures retry for up to 3 days.
- Viewing logs does not count toward API rate limits.
05Before you start
- User must have permission to access the Developer Portal.
06How to set up and use webhook logs dashboard in HighLevel
Set up and use webhook logs dashboard
- Log in at marketplace.gohighlevel.com.
- Open Developer Portal, then go to Insights and select Logs.
- Choose the Webhook Logs tab.
- Optionally change the timezone using the selector in the top right corner.
- Generate a test webhook by triggering an event from your application.
- Enter a unique value, such as an email address, in the global search bar.
- Click the resulting row to display the detail panel with payload and response data.
- Press the Copy button to copy the JSON payload for further analysis.
07What it looks like in HighLevel
08Settings that matter
- Timezone selector. Controls which timezone is used to display timestamps on the dashboard; the choice is saved for the current user.
09Things to know before you rely on it
- Logs are kept for a maximum of 30 days before being permanently removed.
- Non 429 failures may retry for up to three days, extending their visibility in the logs.
- HTTP 429 failures follow the standard retry schedule and do not receive the extended window.
- The dashboard defaults to Central Time but can be changed to any supported timezone.
10How it connects to the rest of HighLevel
- Use Webhook.site to replay captured payloads for testing. Test webhooks with Webhook.site
- Set up webhook endpoints for your app using HighLevel OAuth V2. Configure webhooks with OAuth V2
- Explore additional developer tools and documentation. All developer resources
Michael's take

The Webhook logs dashboard feels like a small convenience that can become a real shift for anyone who spends time chasing down missing data. Having the payload, timestamps and retry history in one place cuts out the back and forth with support and speeds up the debugging loop.
A SaaS startup that pushes leads into a third party email service will love this. When a new contact triggers a webhook, you can fast see if the email platform accepted it or if a temporary 429 hit caused a retry.