
01Who this is for
- Marketing managers benefit because they can align email metrics such as Unsubscribed Emails with a green badge when numbers drop.
- Finance directors gain clarity by setting Cost per Lead to show green when the cost decreases.
- Customer success leads see churn rate badge turn green when churn falls, reflecting their goal.
02Trend badges, explained
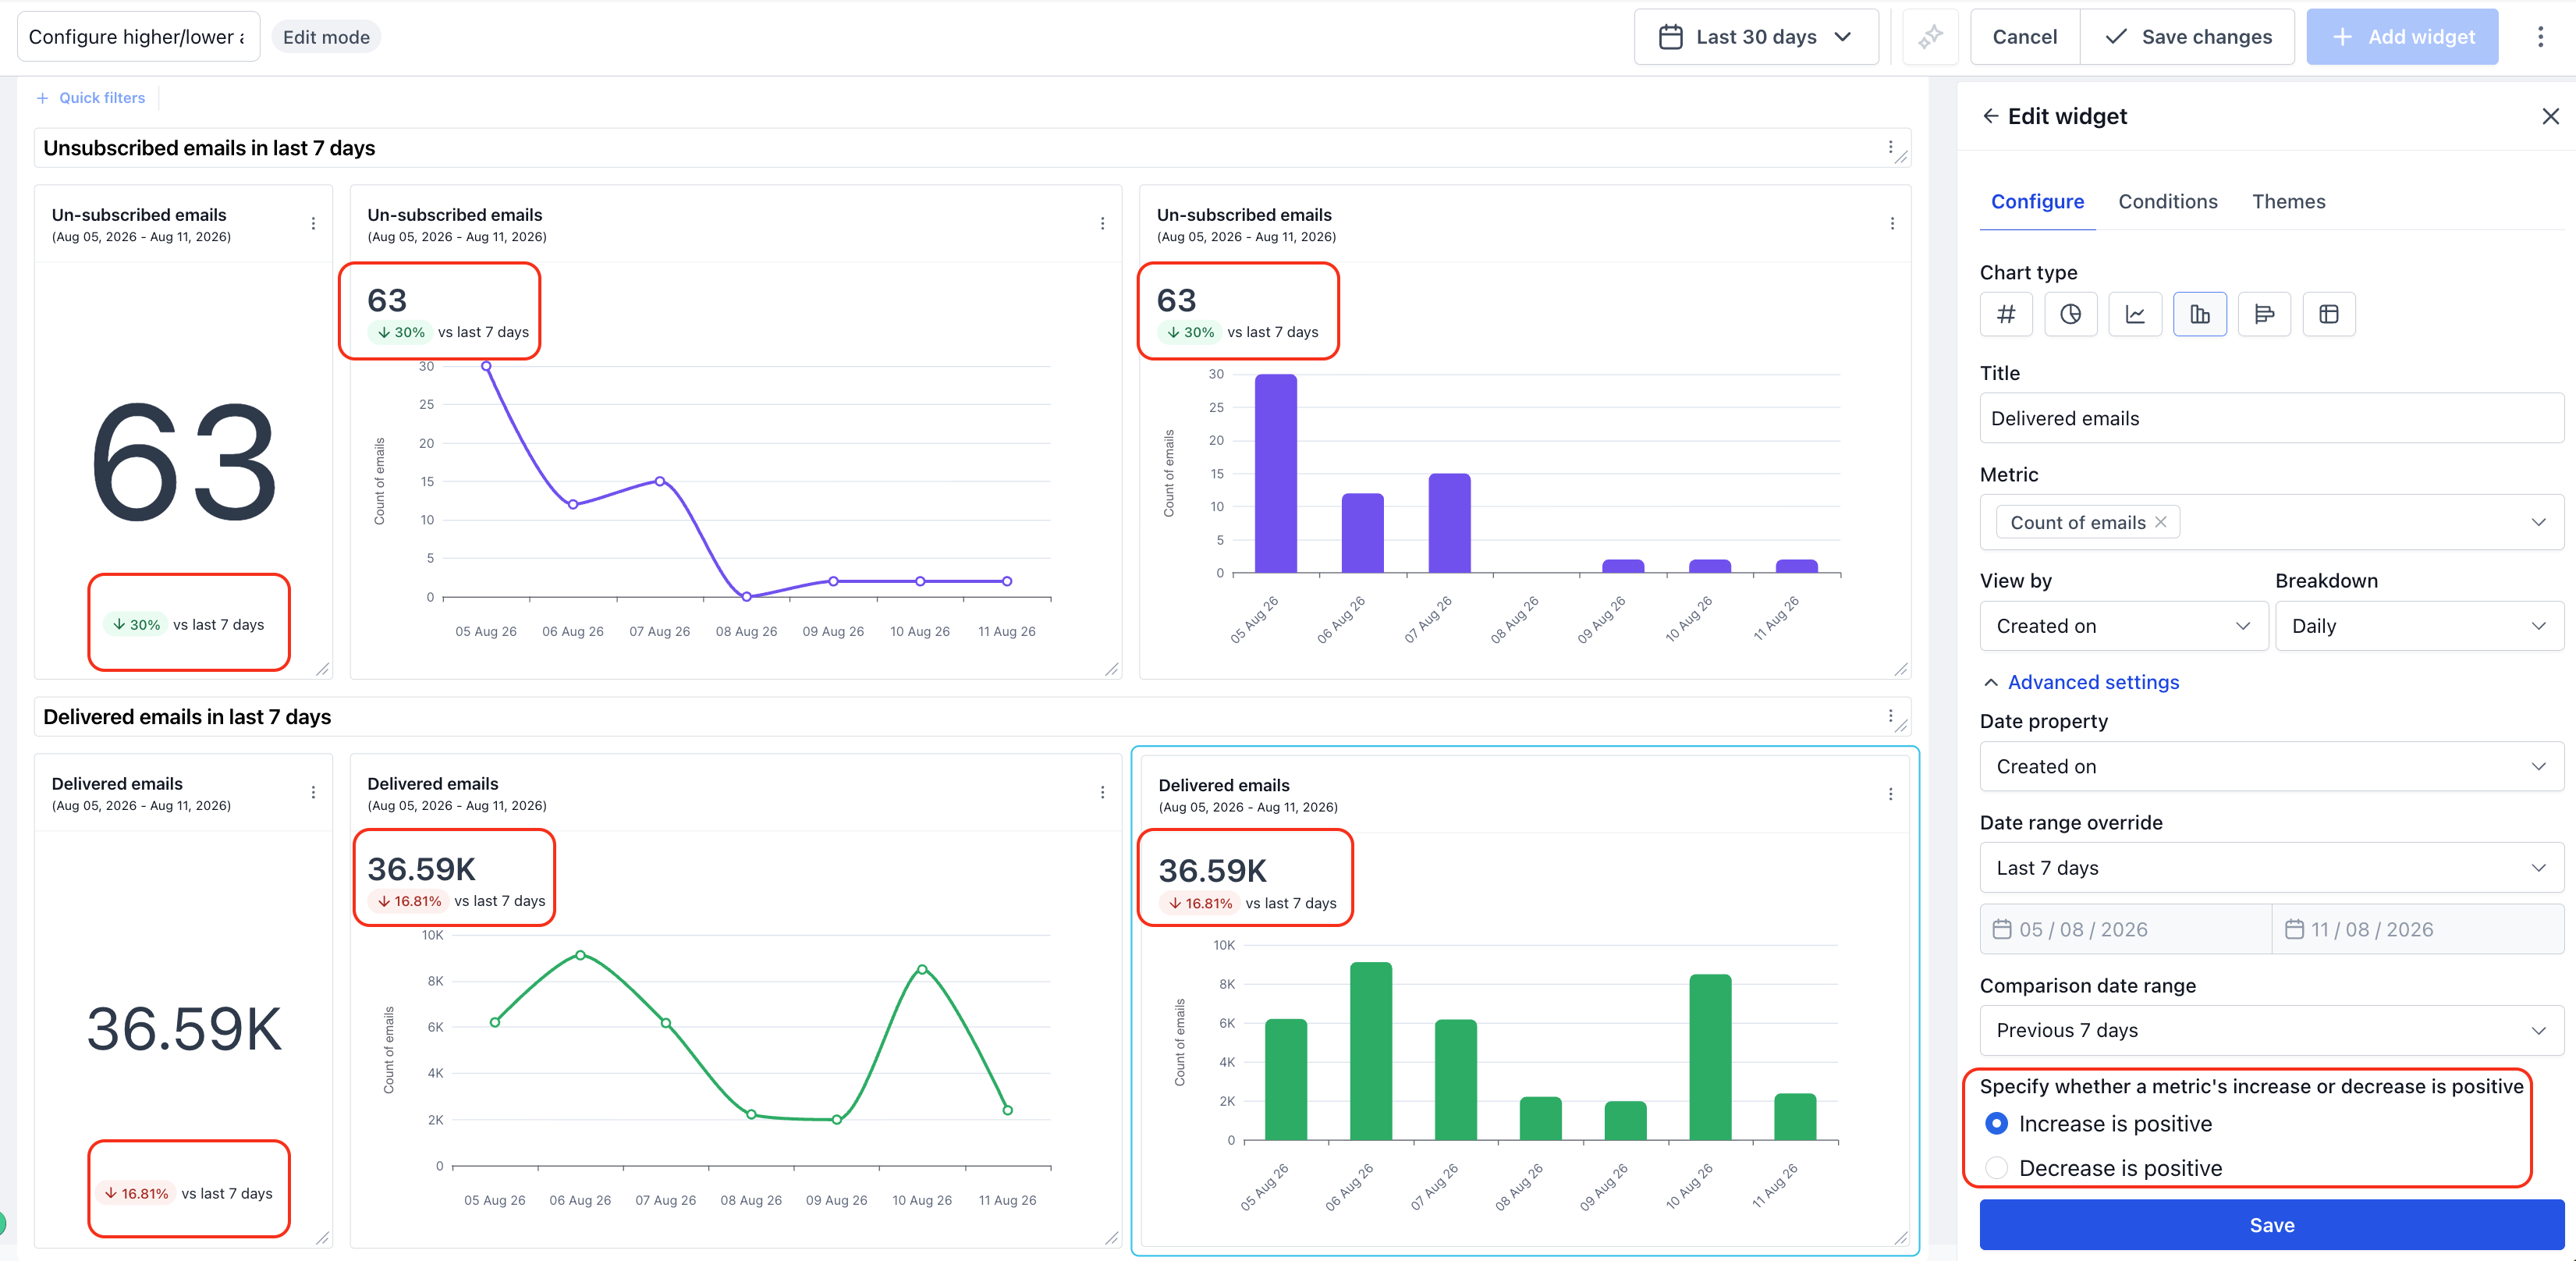
The feature lets you decide which direction, rise or fall, counts as a positive result for each widget’s trend badge. The badge, displayed beside a number, will turn green when the chosen direction occurs and red when the opposite happens. This setting lives inside the widget editor; after opening a widget, go to the Configure tab, expand Advanced settings, and you’ll find the option to mark an increase or a decrease as positive. It works the same for Number, Line, and Bar chart widgets and only influences the small trend badge, not the underlying data or other visual elements.
03How businesses use trend badges
- Email marketing agency. When tracking Unsubscribed Emails, the agency selects “Decrease is positive” so a drop in unsubscribes turns the badge green, accurately indicating improvement.
- Real estate brokerage. The brokerage monitors Bounce Rate on listing campaigns; setting the badge to treat a decrease as positive makes a lower bounce rate display with a green indicator.
- SaaS startup. The startup follows Cost per Lead; by choosing “Decrease is positive,” any reduction in cost shows a green badge, matching their cost efficiency goals.
04The numbers and rules that matter
- Requires a Comparison date range (e.g., "Previous 7 days").
05Before you start
- A comparison date range (for example, “Previous 7 days”) must be set for the widget; without it the badge has no percentage to display.
06How to set up and use trend badges in HighLevel
Set positive direction for a widget
- Open the dashboard or custom report that contains the widget you want to modify.
- Click the three dot menu on the widget and select Edit widget, or enter edit mode and select the widget.
- Navigate to the Configure tab within the widget editor.
- Expand the Advanced settings section.
- Locate the option “Specify whether a metric's increase or decrease is positive” and choose the appropriate setting.
- Click Save changes to store the new direction.
07What it looks like in HighLevel
08Settings that matter
- Specify whether a metric's increase or decrease is positive. Determines which change direction (increase or decrease) makes the trend badge turn green, indicating a positive outcome.
09Things to know before you rely on it
- The option only influences the trend badge; other widget visuals remain unchanged.
- A comparison date range must be configured for the badge to appear.
- The setting works for widgets displayed as Number, Line, or Bar charts.
10If something goes wrong
- Trend badge does not appear on the widget.. Ensure a comparison date range such as “Previous 7 days” is set for the widget.
11How it connects to the rest of HighLevel
- Learn how to customize the look of your dashboard with themes. Customizing dashboard themes
- Create reusable dashboard templates for consistent reporting. Dashboard templates
Michael's take

I appreciate being able to set which direction is considered positive for the badge.
Avoid leaving the widget without a comparison range, or the badge won’t show at all.