
01Who this is for
- Agency Founders who need a quick snapshot of overall revenue and customer growth to guide strategic decisions.
- SaaS product resellers who must monitor subscription MRR changes, expansions and churn to manage recurring income.
- Reselling teams that track product cost versus revenue to understand profit margins and make pricing adjustments.
02Dashboard metrics, explained
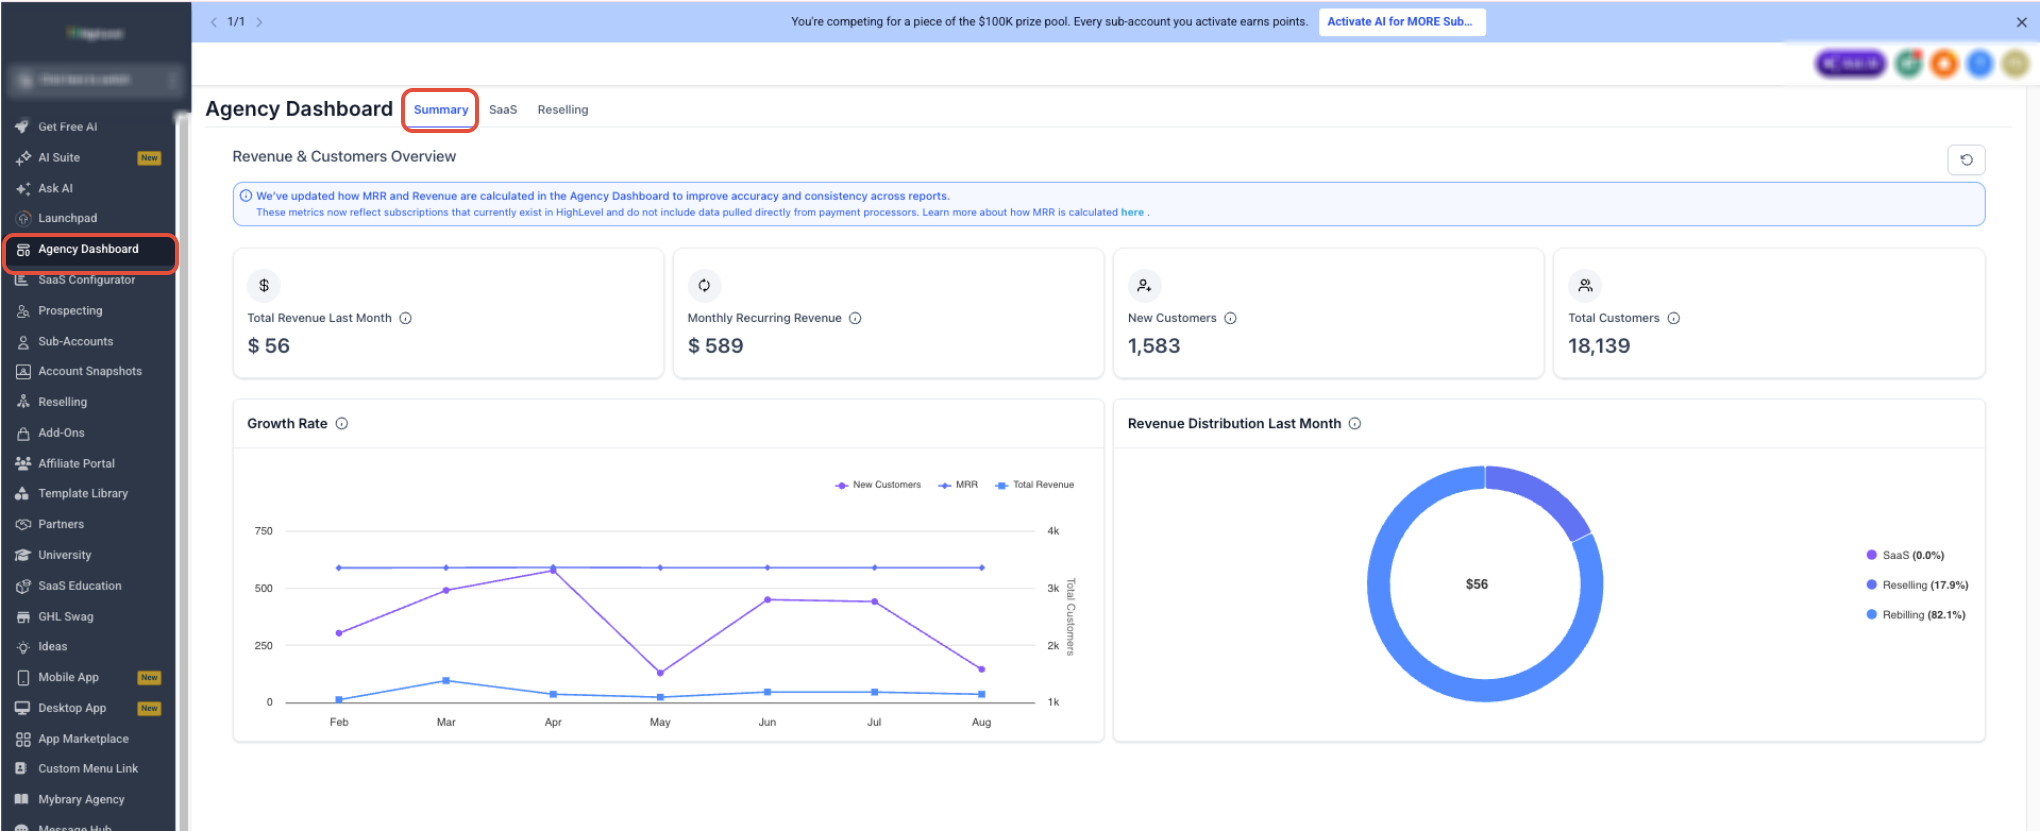
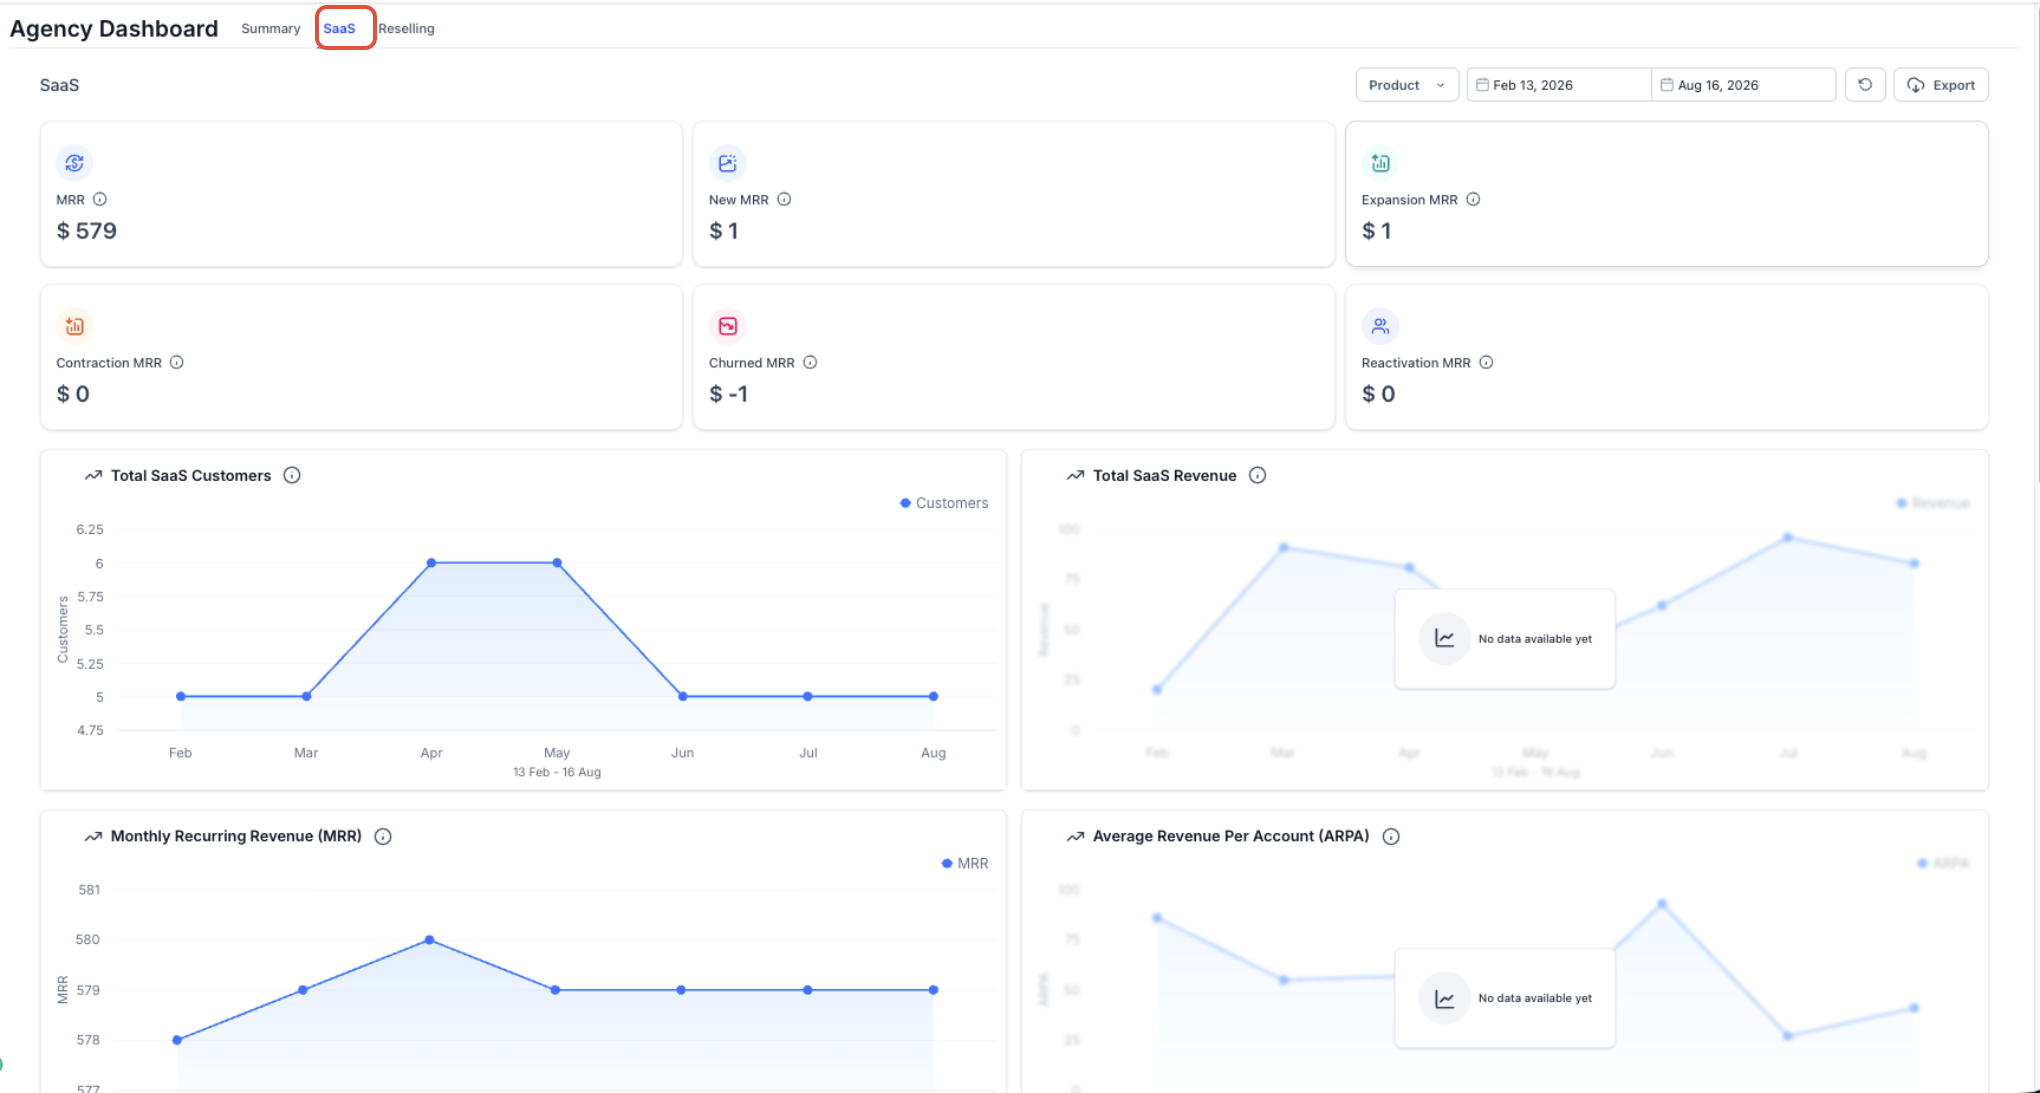
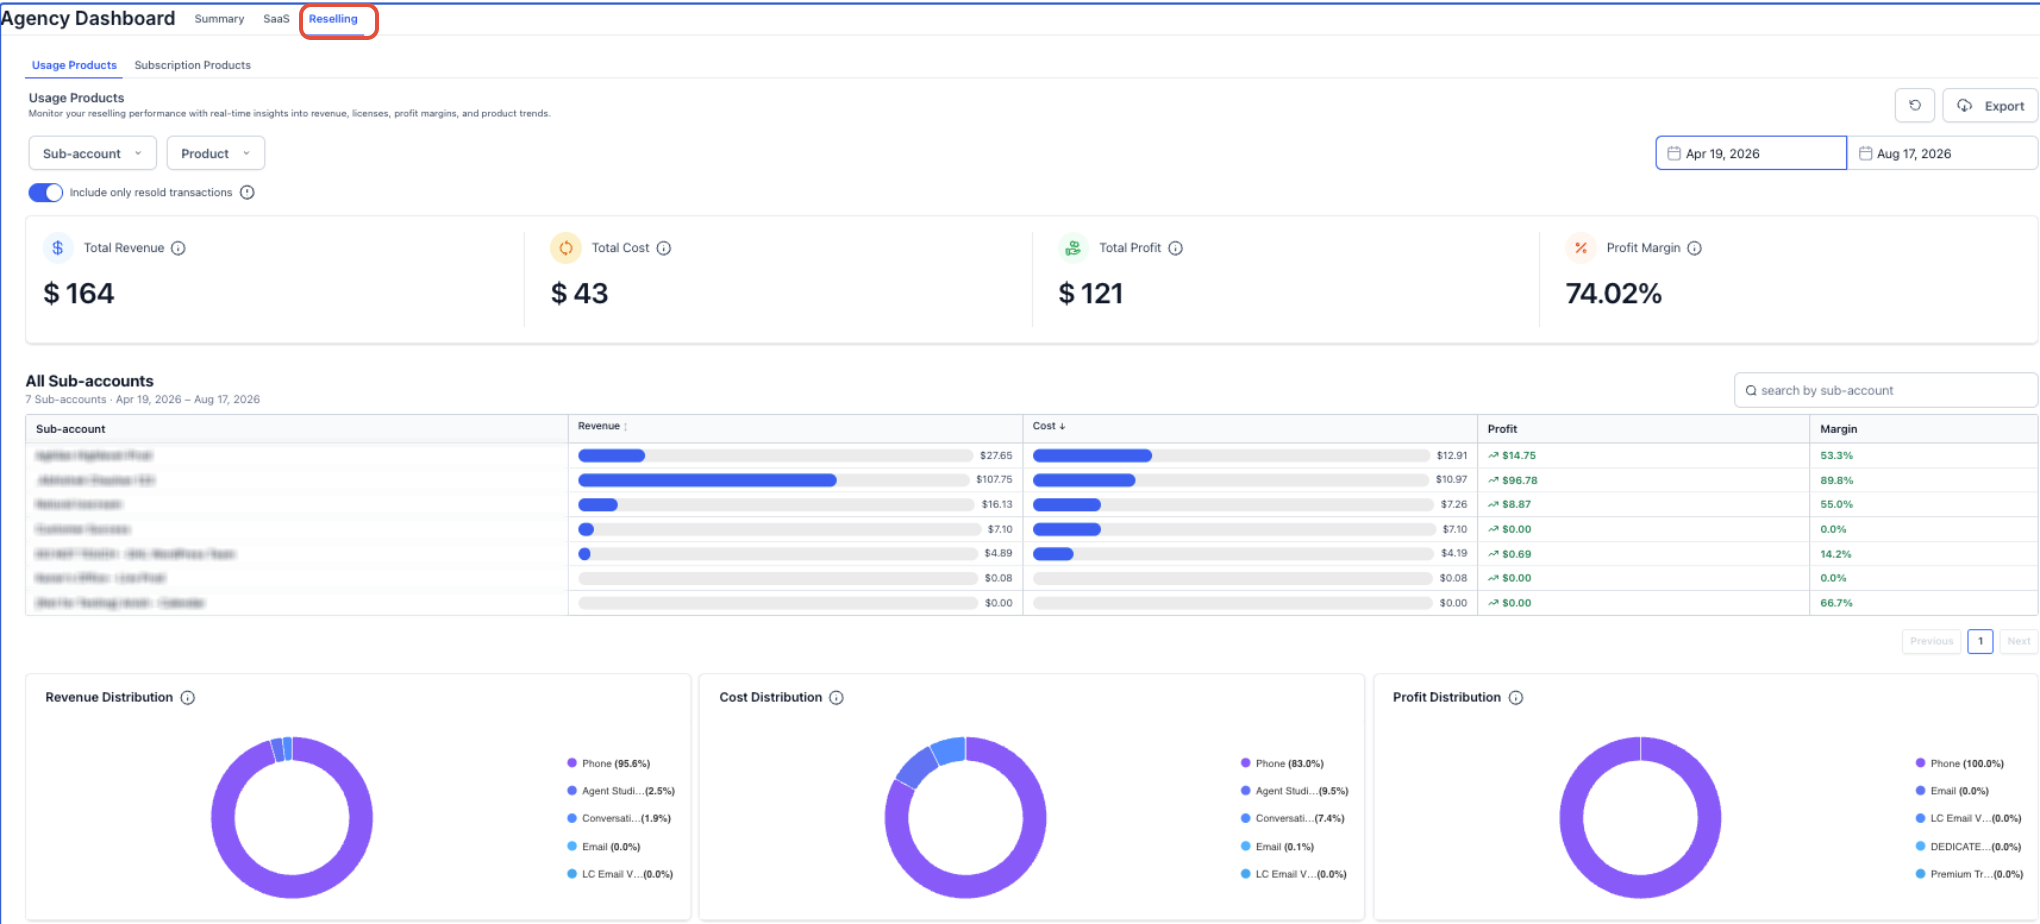
The dashboard pulls together core financial and customer metrics into one place. The Summary view aggregates total revenue, monthly recurring revenue, new customers and total customers, and displays growth trends and revenue distribution for the prior month. The SaaS view drills into subscription related MRR, showing new, expansion, contraction, churned and reactivated amounts along with trend charts for customers, revenue and ARPA. The Reselling view breaks down revenue, cost, profit and profit margin for resold products, letting you compare usage based and subscription based profitability.
All three views reside within the agency dashboard navigation. You can switch tabs, apply filters for account, product, date range or transaction type, refresh the report, and export data for deeper analysis. The metrics reflect qualifying data within the system; external subscriptions may be excluded.
03How businesses use dashboard metrics
- Digital marketing agency. The agency opens the dashboard, selects the Summary tab, and reviews total revenue and new customer counts to gauge month over month growth. It then filters by client account to see how each campaign contributes to overall revenue.
- SaaS product reseller. The reseller clicks the SaaS tab, examines the New MRR, Expansion MRR and Churned MRR figures, and uses the trend chart to spot periods of subscriber growth or loss. Adjusting the date range filter helps compare quarterly performance.
- Consulting firm offering subscription services. The firm switches to the Reselling view, confirms the product and date filters, and reads the profit margin column to evaluate which subscription packages generate the highest profitability. It can export the table for budgeting purposes.
04The numbers and rules that matter
- Average Revenue Per Account (ARPA): Average recurring revenue per qualifying SaaS customer account.
- Filters available: Account, Product, Date Range, Resold transactions.
05How to set up and use dashboard metrics in HighLevel
View summary metrics
- Open the HighLevel agency dashboard.
- Click the Summary tab.
- Review total revenue, MRR, new customers and total customers.
- Adjust filters if you need a different date range or account view.
View SaaS details
- Open the HighLevel agency dashboard.
- Click the SaaS tab.
- Examine MRR breakdowns such as New, Expansion, Contraction, Churned and Reactivation.
- Look at the trend charts for customers, revenue and ARPA.
View reselling data
- Open the HighLevel agency dashboard.
- Click the Reselling tab.
- Confirm the account, product, date range and transaction filters are set as desired.
- Review revenue, cost, profit and profit margin values for each customer.
- Export the data if further analysis is required.
06What it looks like in HighLevel
07Settings that matter
- Account filter. Limits the report to transactions associated with the selected account.
- Product filter. Shows data only for the chosen product or product group.
- Date Range filter. Defines the period over which revenue, cost and other metrics are calculated.
- Resold transactions filter. Includes or excludes specific resold transaction types from the calculations.
08Things to know before you rely on it
- MRR calculations use only qualifying subscriptions that exist inside the HighLevel system; subscriptions created outside the system may not be counted.
- Totals in the Reselling view change whenever you apply or modify filters such as account, product, date range or transaction type.
09If something goes wrong
- Dashboard metric appears inaccurate. Verify the selected tab, date range, account, product and transaction filters, then confirm that the underlying subscriptions or transactions meet the qualification rules.
10How it connects to the rest of HighLevel
- HighLevel agency dashboard overview of summary, SaaS and reselling metrics Dashboard overview
- SaaS analytics in the HighLevel agency dashboard SaaS analytics
- HighLevel agency rebilling dashboard access and filter steps Rebilling dashboard
Michael's take

Most people stare at the big numbers and think they tell the whole story, but they often miss the filters that shape those numbers. Looking at a total without confirming the date range or product selection can lead to wrong conclusions.
I would first lock in the exact date range and product set I need, then jump to the view that matches my question, Summary for a quick health check, SaaS for subscription trends, or Reselling for profit margins. That way the numbers you see are the ones that matter.