
01Who this is for
- Agency owners who need to monitor rebilling performance across many client accounts and services.
- Finance managers who must reconcile revenue, vendor costs and profit on a regular basis.
- Product teams that want to see usage trends for specific service categories such as Phone or AI Products.
02Agency dashboard for rebilling, explained
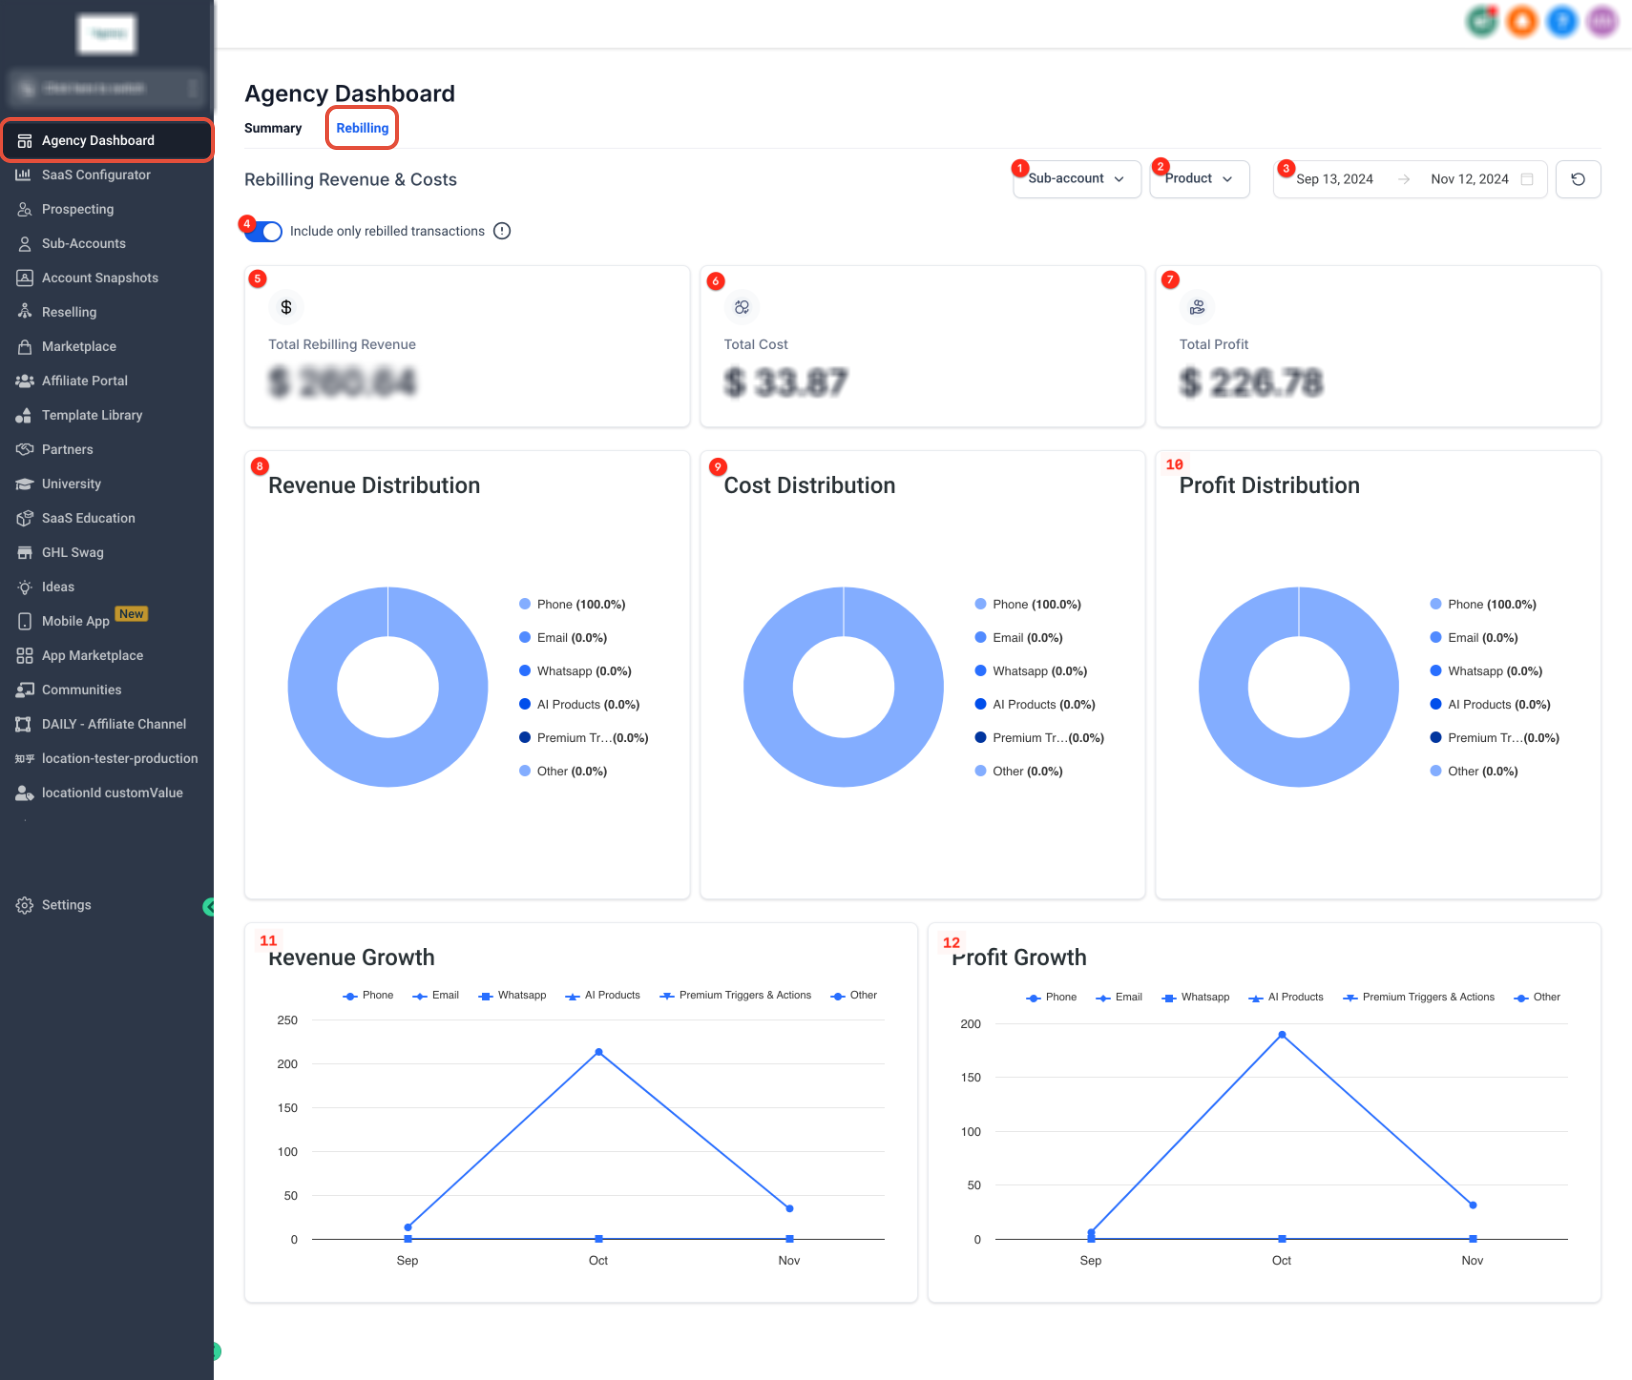
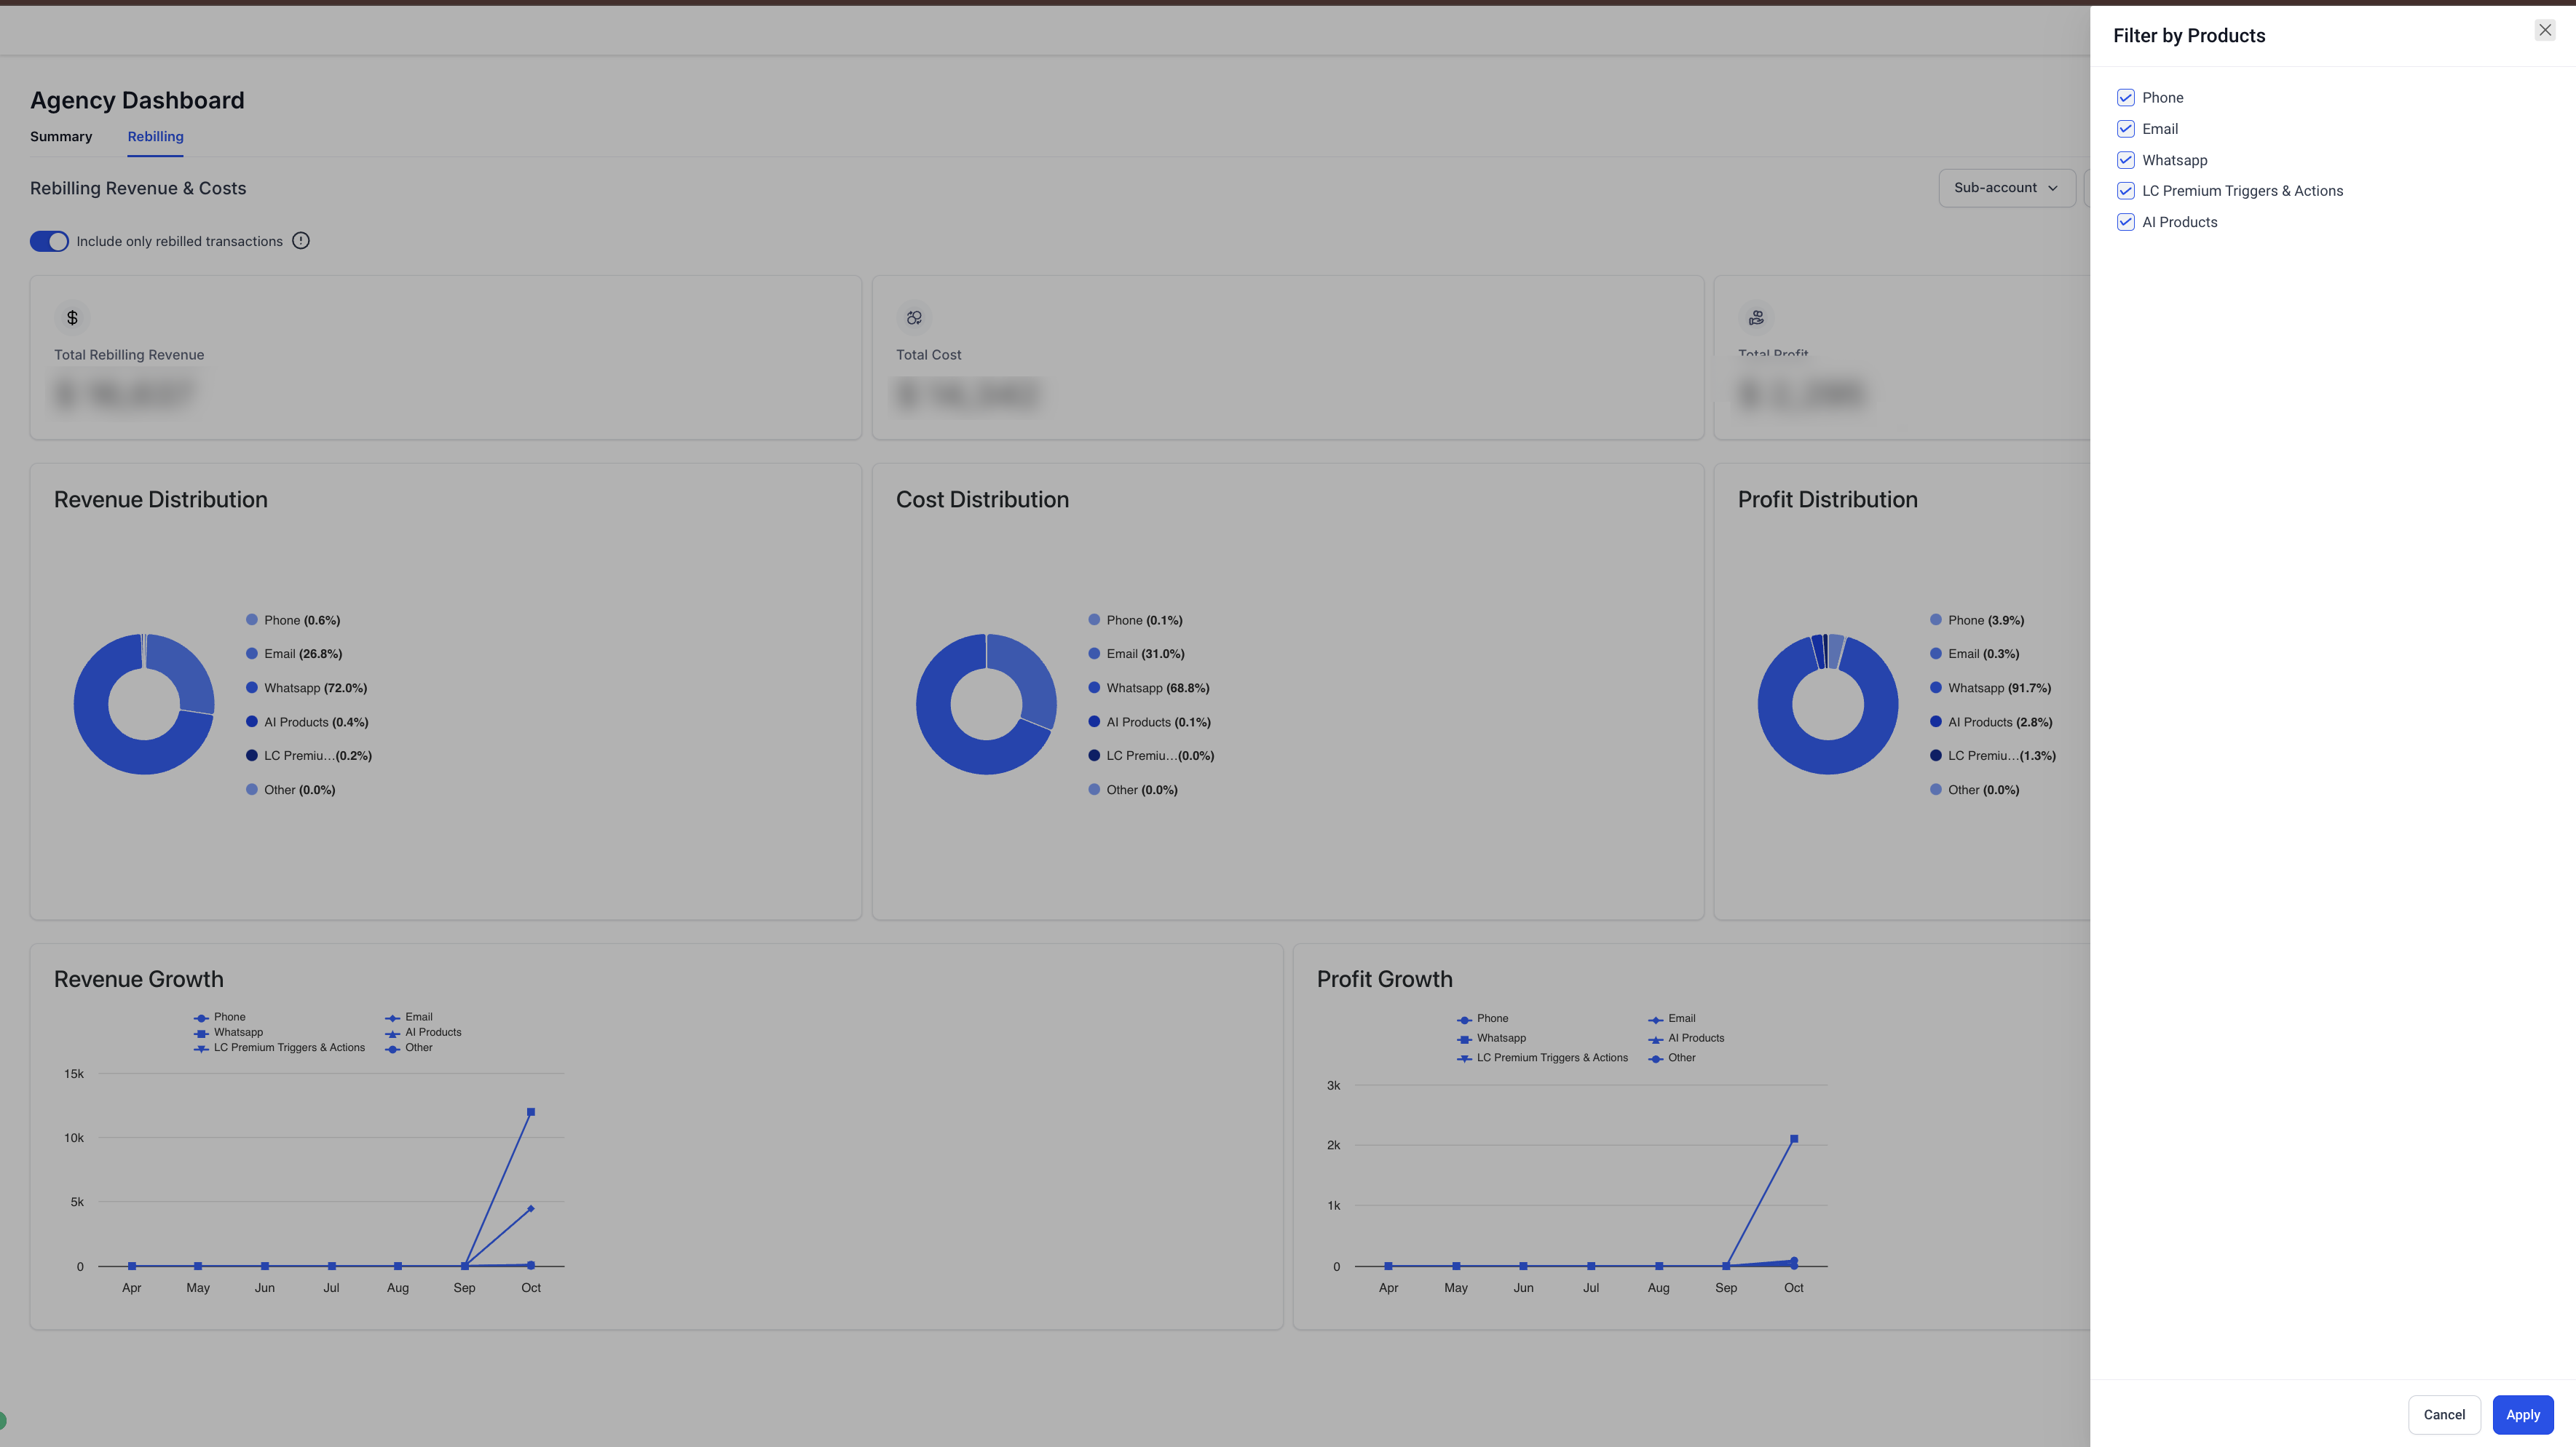
The Rebilling view sits inside the Agency Dashboard under the left hand navigation. It shows a high level summary of revenue, cost and profit, plus distribution and growth charts. Controls at the top let you narrow the view by subaccount, product category and a custom date range, and you can choose to include only transactions that were successfully rebilled.
Data displayed covers the most recent six months and reflects the rebilling configuration you have set up. Negative revenue may appear when refunds, cancellations or prorated adjustments occur. Exporting the view provides raw transaction rows, which you can manipulate in a spreadsheet to calculate profit manually.
03How businesses use agency dashboard for rebilling
- Digital marketing agency. The agency selects the subaccounts that represent its client businesses, filters for the Email service category, and chooses the last quarter as the date range. The resulting profit figure helps the agency decide whether to adjust pricing for that service.
- SaaS reseller. The reseller applies the product filter for AI Products, enables the Include only rebilled toggle, and exports the CSV. In a spreadsheet the reseller adds a Profit column by subtracting usage cost from charge to see margins per client.
- Managed IT provider. The provider picks multiple subaccounts, selects the Phone service, sets a custom date range covering six months, and refreshes the dashboard. The distribution chart reveals which phone plans generate the most revenue and cost.
04The numbers and rules that matter
- Include Only Rebilled Transactions toggle limits data to successfully charged transactions.
05Before you start
- The dashboard only shows data from the most recent six months.
- Metrics depend on the rebilling setup and the transaction data that is available.
- Financial values may differ from external processors because of filters, refunds, fees or timing.
06How to set up and use agency dashboard for rebilling in HighLevel
Open the rebilling view in the agency dashboard
- Sign in to Agency View.
- Choose Agency Dashboard from the left side menu.
- Click the Rebilling tab at the top of the dashboard.
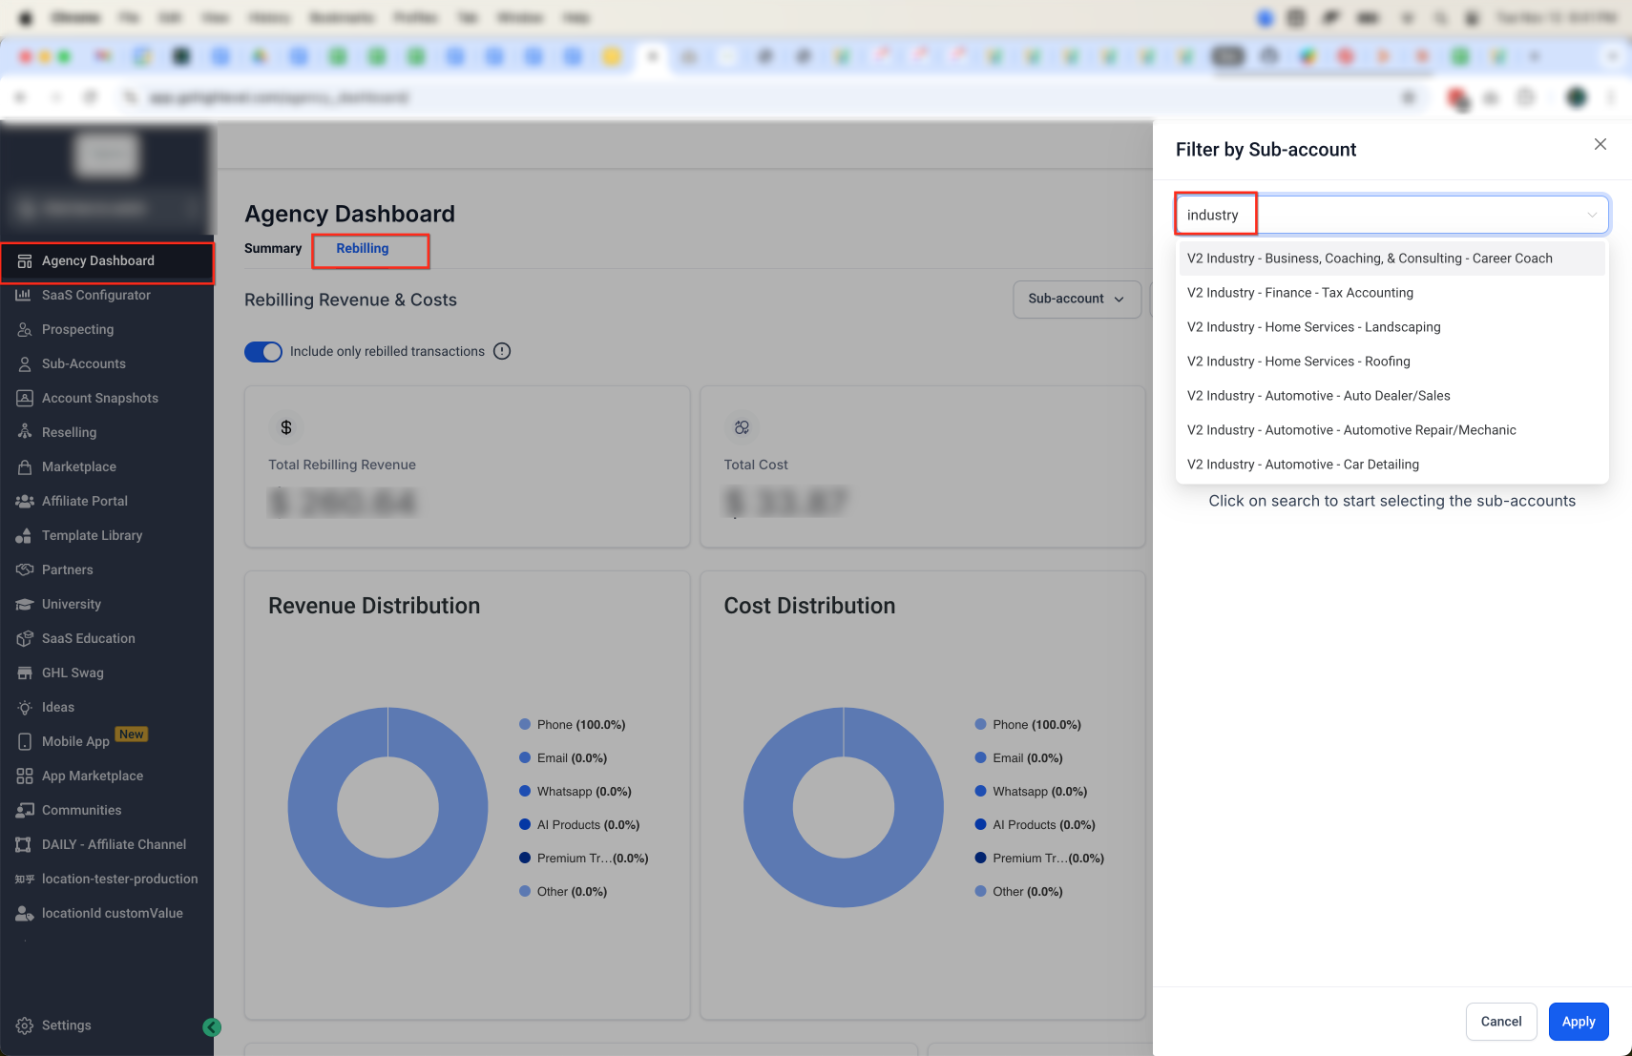
Apply filters to narrow the rebilling data
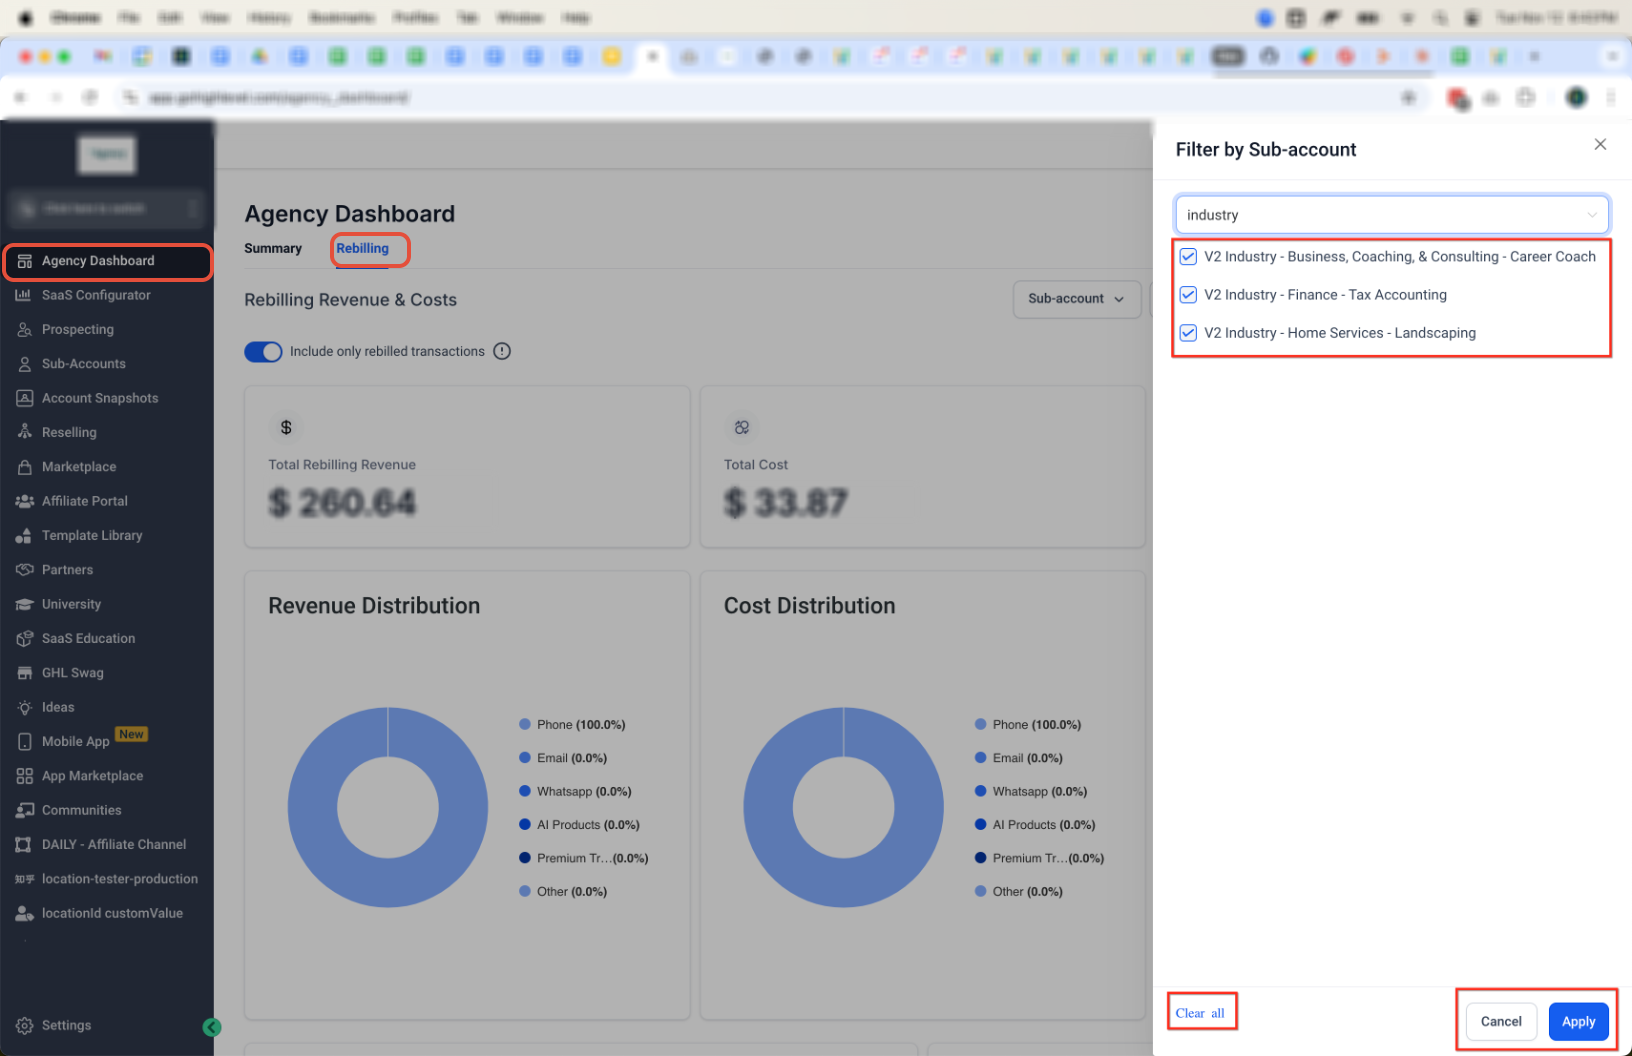
- Use the subaccount filter to search for and select the desired accounts.
- Choose the service category with the product filter.
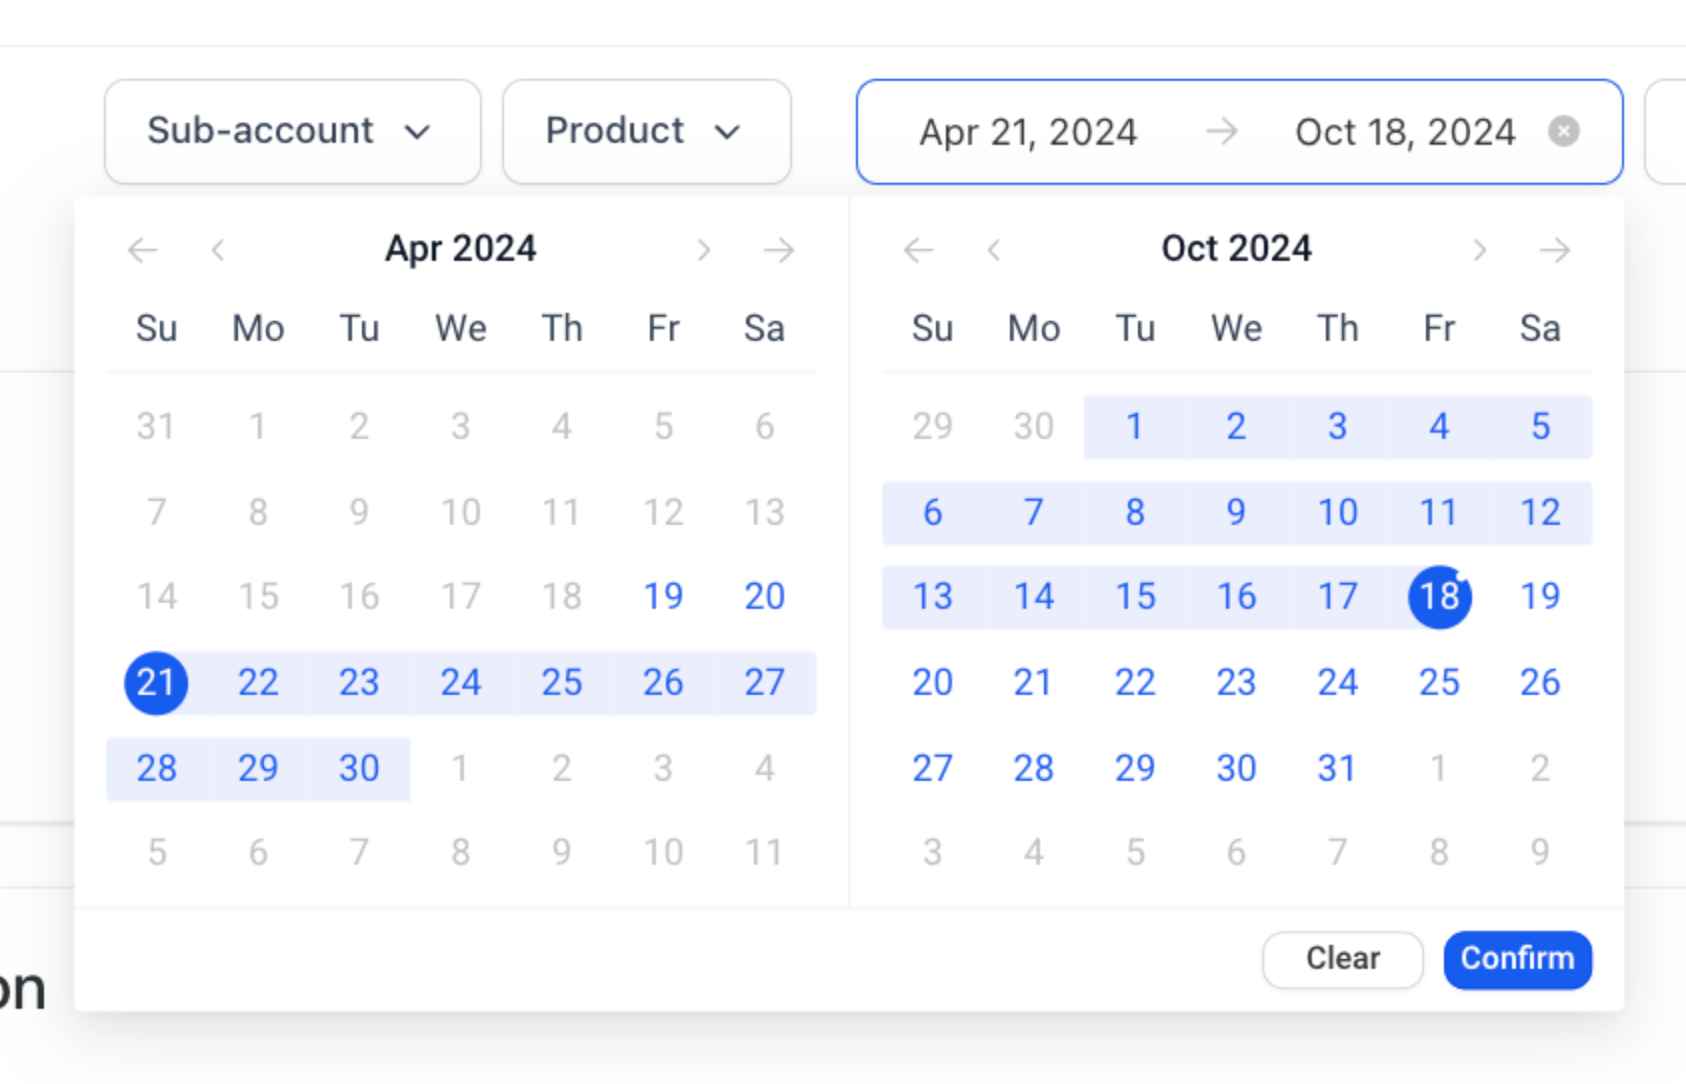
- Set a custom start and end date in the date range selector.
- Press Confirm to load the filtered results.
- Toggle Include only rebilled transactions on if you want to see only successful charges.
Export filtered data
- After applying the desired filters, click the Export button.
- Save the CSV file to your computer.
- Open the file in a spreadsheet program to calculate profit or create custom reports.
07What it looks like in HighLevel
08Settings that matter
- Include only rebilled transactions. When turned on, the dashboard counts only transactions that were successfully charged; when off, it also shows costs that were not rebilled.
09Things to know before you rely on it
- Only six months of rebilling data are available in the dashboard.
- Profit is not pre calculated in exported files; you must compute it yourself.
- Negative revenue can appear because of refunds, cancellations or prorated adjustments.
- Auto Recharge amounts are wallet top ups and are not comparable to the cost or revenue shown.
10If something goes wrong
- Dashboard totals differ from the exported CSV. Confirm that both the dashboard and the export use the same subaccount, product and date range filters before comparing numbers.
- Numbers do not match Stripe reports. Remember that Stripe includes processing fees, direct refunds and settlement timing, which the dashboard does not reflect.
- Revenue shows as a negative amount. Check recent refunds, cancellations or prorated adjustments that may have reduced the revenue figure.
- Exported file lacks a Profit column. Calculate profit manually by subtracting the Usage Cost column from the Charge column in your spreadsheet.
- Only six months of data are visible. The system currently limits reporting to the most recent six months; older periods cannot be displayed.
- Profit appears lower than expected. Verify the selected date range, product and subaccount filters, and whether the Include only rebilled toggle is set correctly.
- Some transactions are missing from the view. Ensure the correct filters are applied, the date range includes the transaction date, and that the transaction falls within the six month window.
11How it connects to the rest of HighLevel
- See the full range of metrics in the Agency Dashboard overview. Agency dashboard overview
- Explore SaaS analytics that complement rebilling data. SaaS analytics
- Review pricing options and eligibility for the dashboard features. HighLevel pricing
Michael's take

Many users assume the dashboard will automatically give them profit numbers they can use straight away. The export file doesn’t contain a profit column, so you have to add it yourself after you download the CSV. That step is easy, but it’s easy to overlook. If I were setting this up, I would first lock in the exact subaccount, product and date filters I need, then keep the “Include only rebilled transactions” toggle on. This helps ensure the numbers you see align with the profit you calculate. After that I’d pull the export, add a Profit column in my spreadsheet and run a quick pivot to compare the dashboard totals with my calculations.