
01Who this is for
- Founders who need quick insight into each funnel step to assess marketing effectiveness.
- Agency owners managing multiple client sites and requiring a centralized way to compare performance.
- Ecommerce operators who track sales and revenue per page to identify high value content.
02Funnel statistics, explained
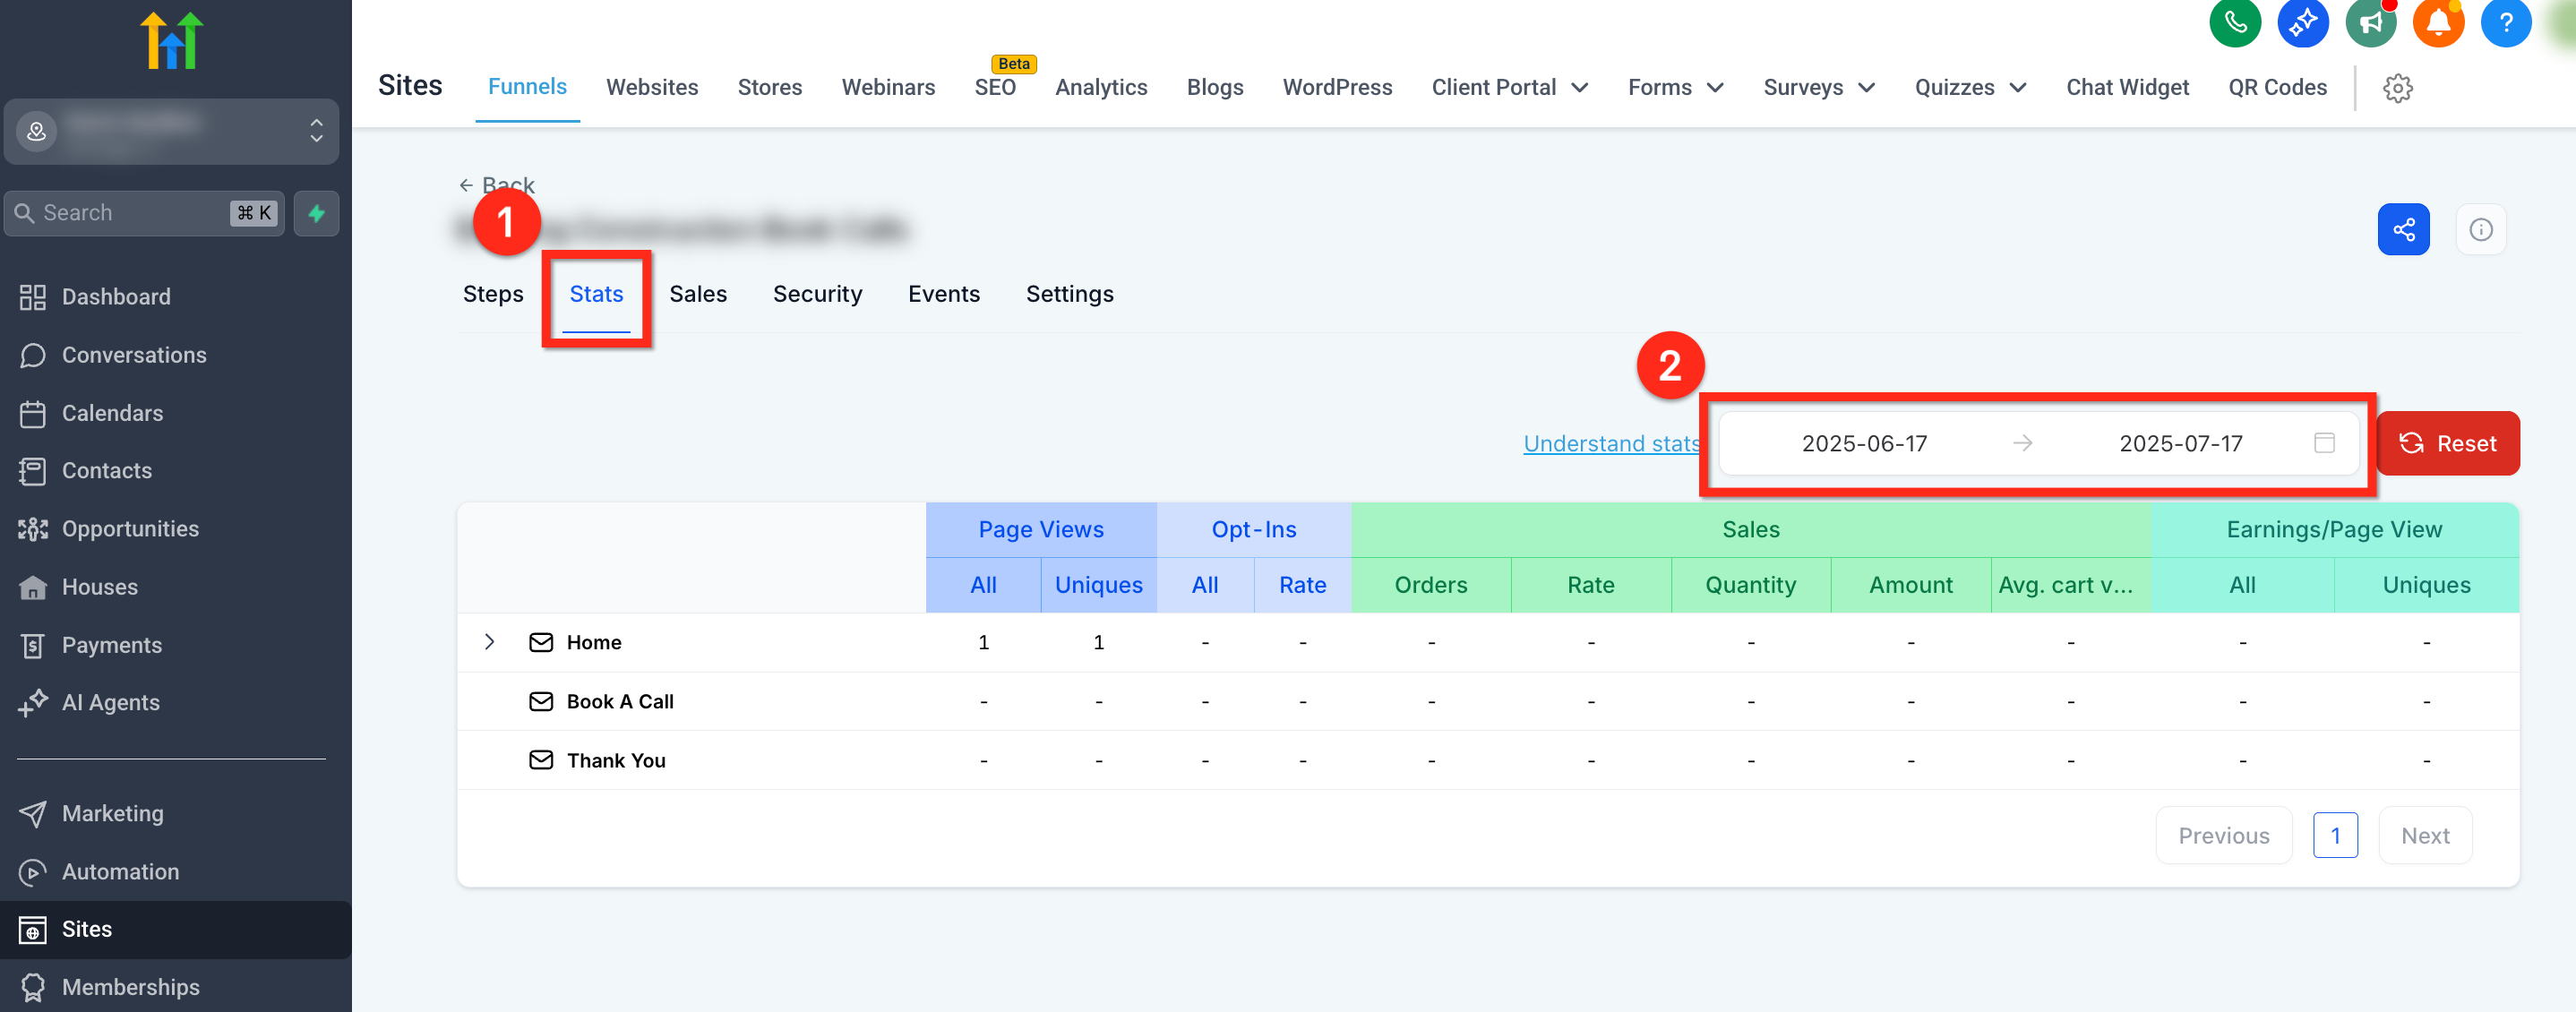
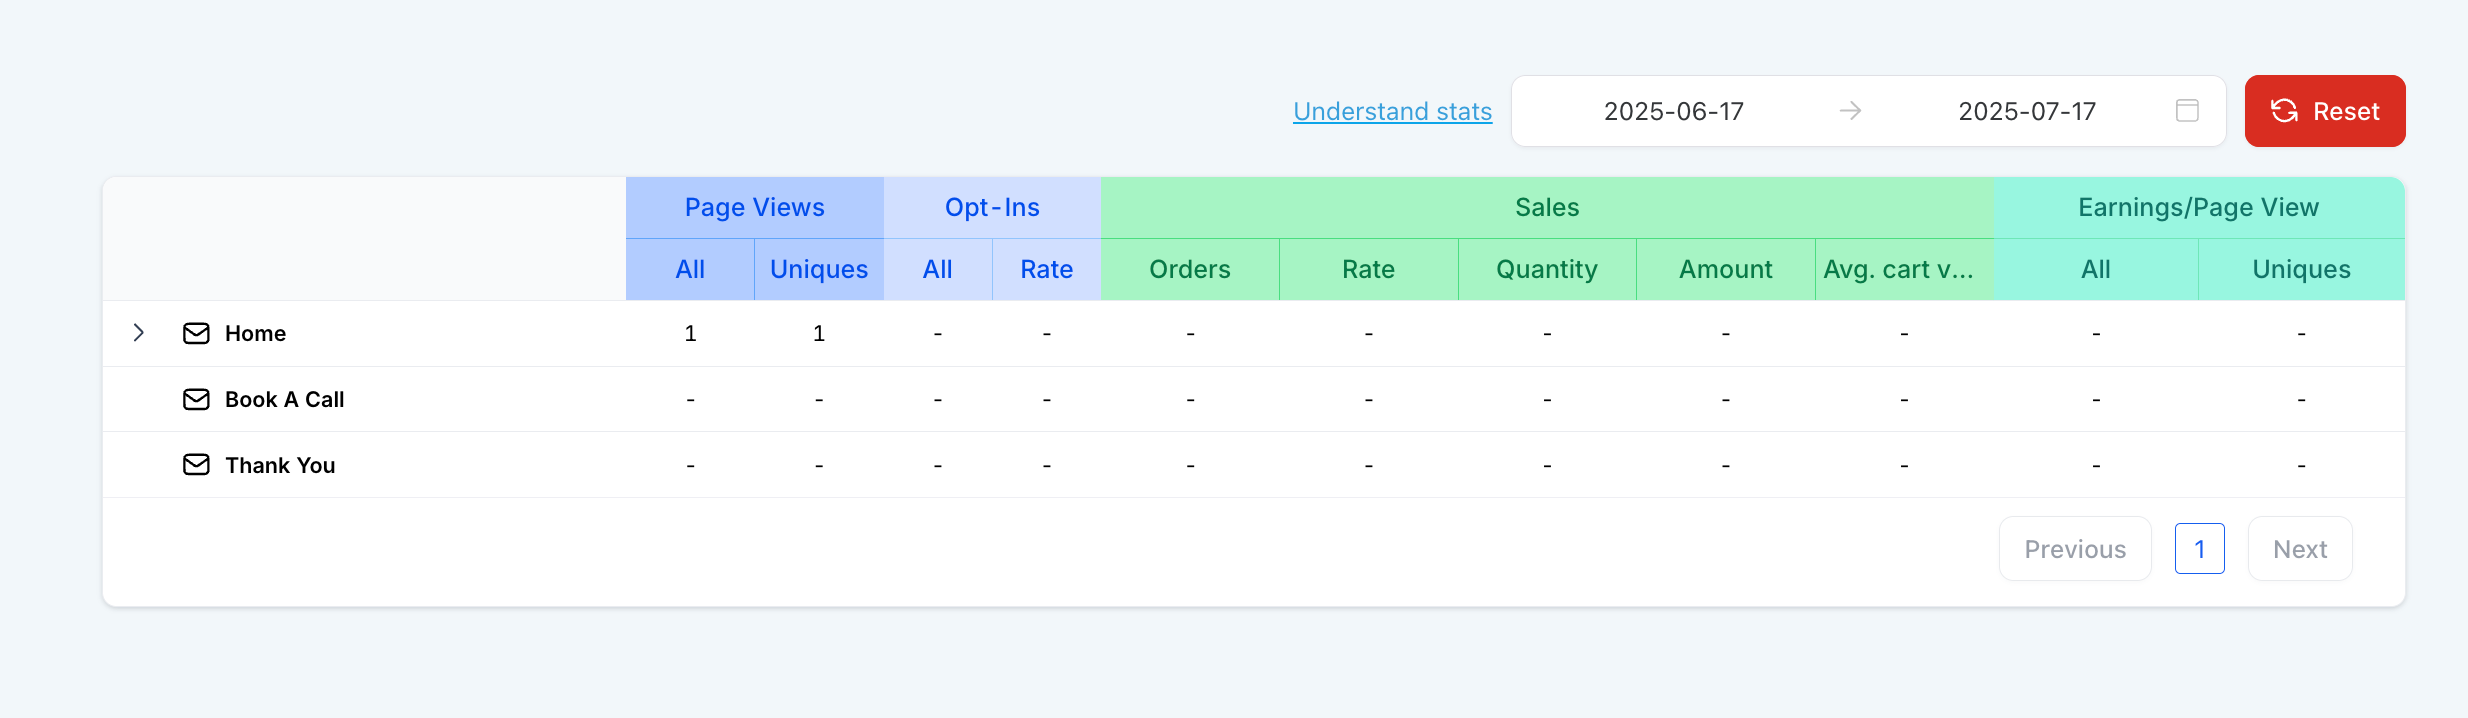
Funnel statistics are a built in reporting view inside each funnel or site. After opening a funnel in edit mode, the Stats tab displays a table with columns for page name, total and unique views, opt in counts and rates, sales counts, conversion rates, total sales value and earnings per page view. The data can be filtered by any custom date range using the timeline drop down in the upper right corner.
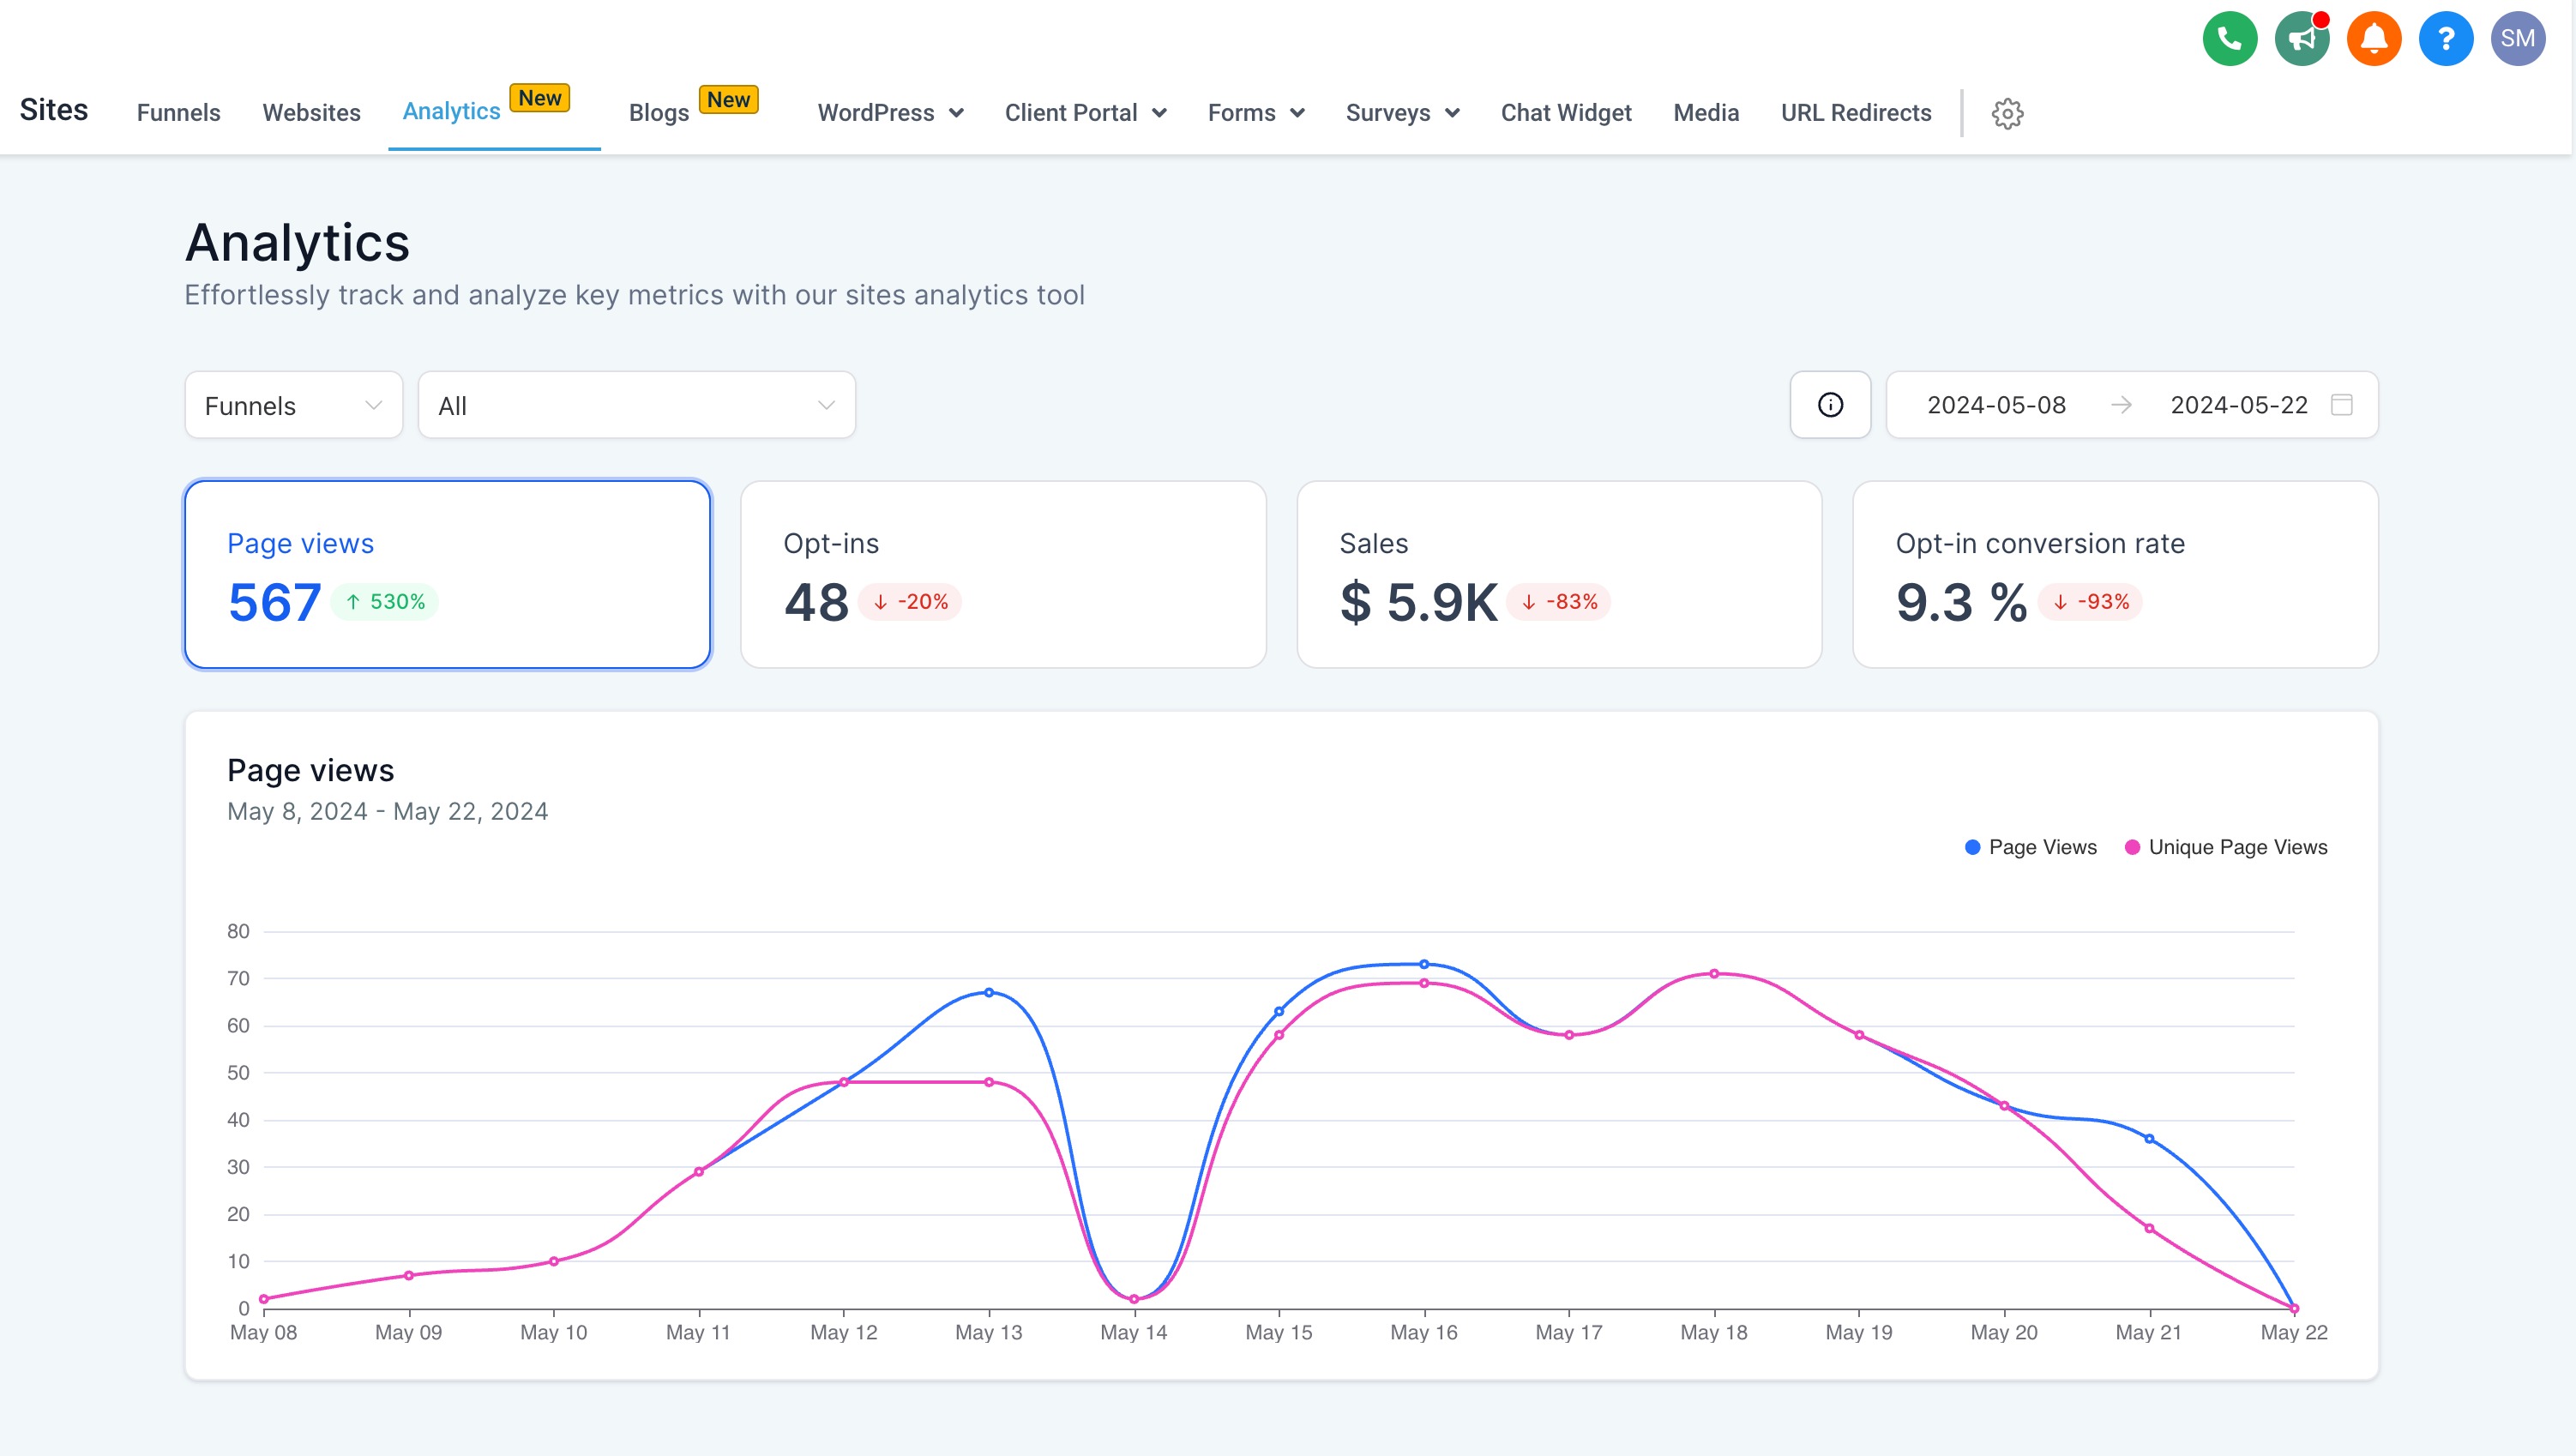
The feature lives within the funnel editor, not on a separate dashboard. For a broader, visual overview across all funnels and websites, the Analytics dashboard is available under Sites > Analytics, offering graphs and segmentation tools.
03How businesses use funnel statistics
- Digital marketing agency. The agency opens the Stats tab for each client’s funnel, selects a month long date range and reviews opt in rates and sales values per page. This helps the team spot underperforming steps and plan improvements.
- Online course creator. The creator filters the funnel statistics to the launch week, examines unique page views and earnings per view to understand which sales page generated the most revenue per visitor.
- Local service business. The business views the Stats tab for its appointment booking funnel, checks the opt in count and rate for the contact form, and uses the data to adjust the call to action wording.
04The numbers and rules that matter
- Opt ins Rate = (Opt ins * 100) / Unique page views.
- Sales Rate = (Number of product sold * 100) / Unique page views.
05How to set up and use funnel statistics in HighLevel
Access funnel statistics
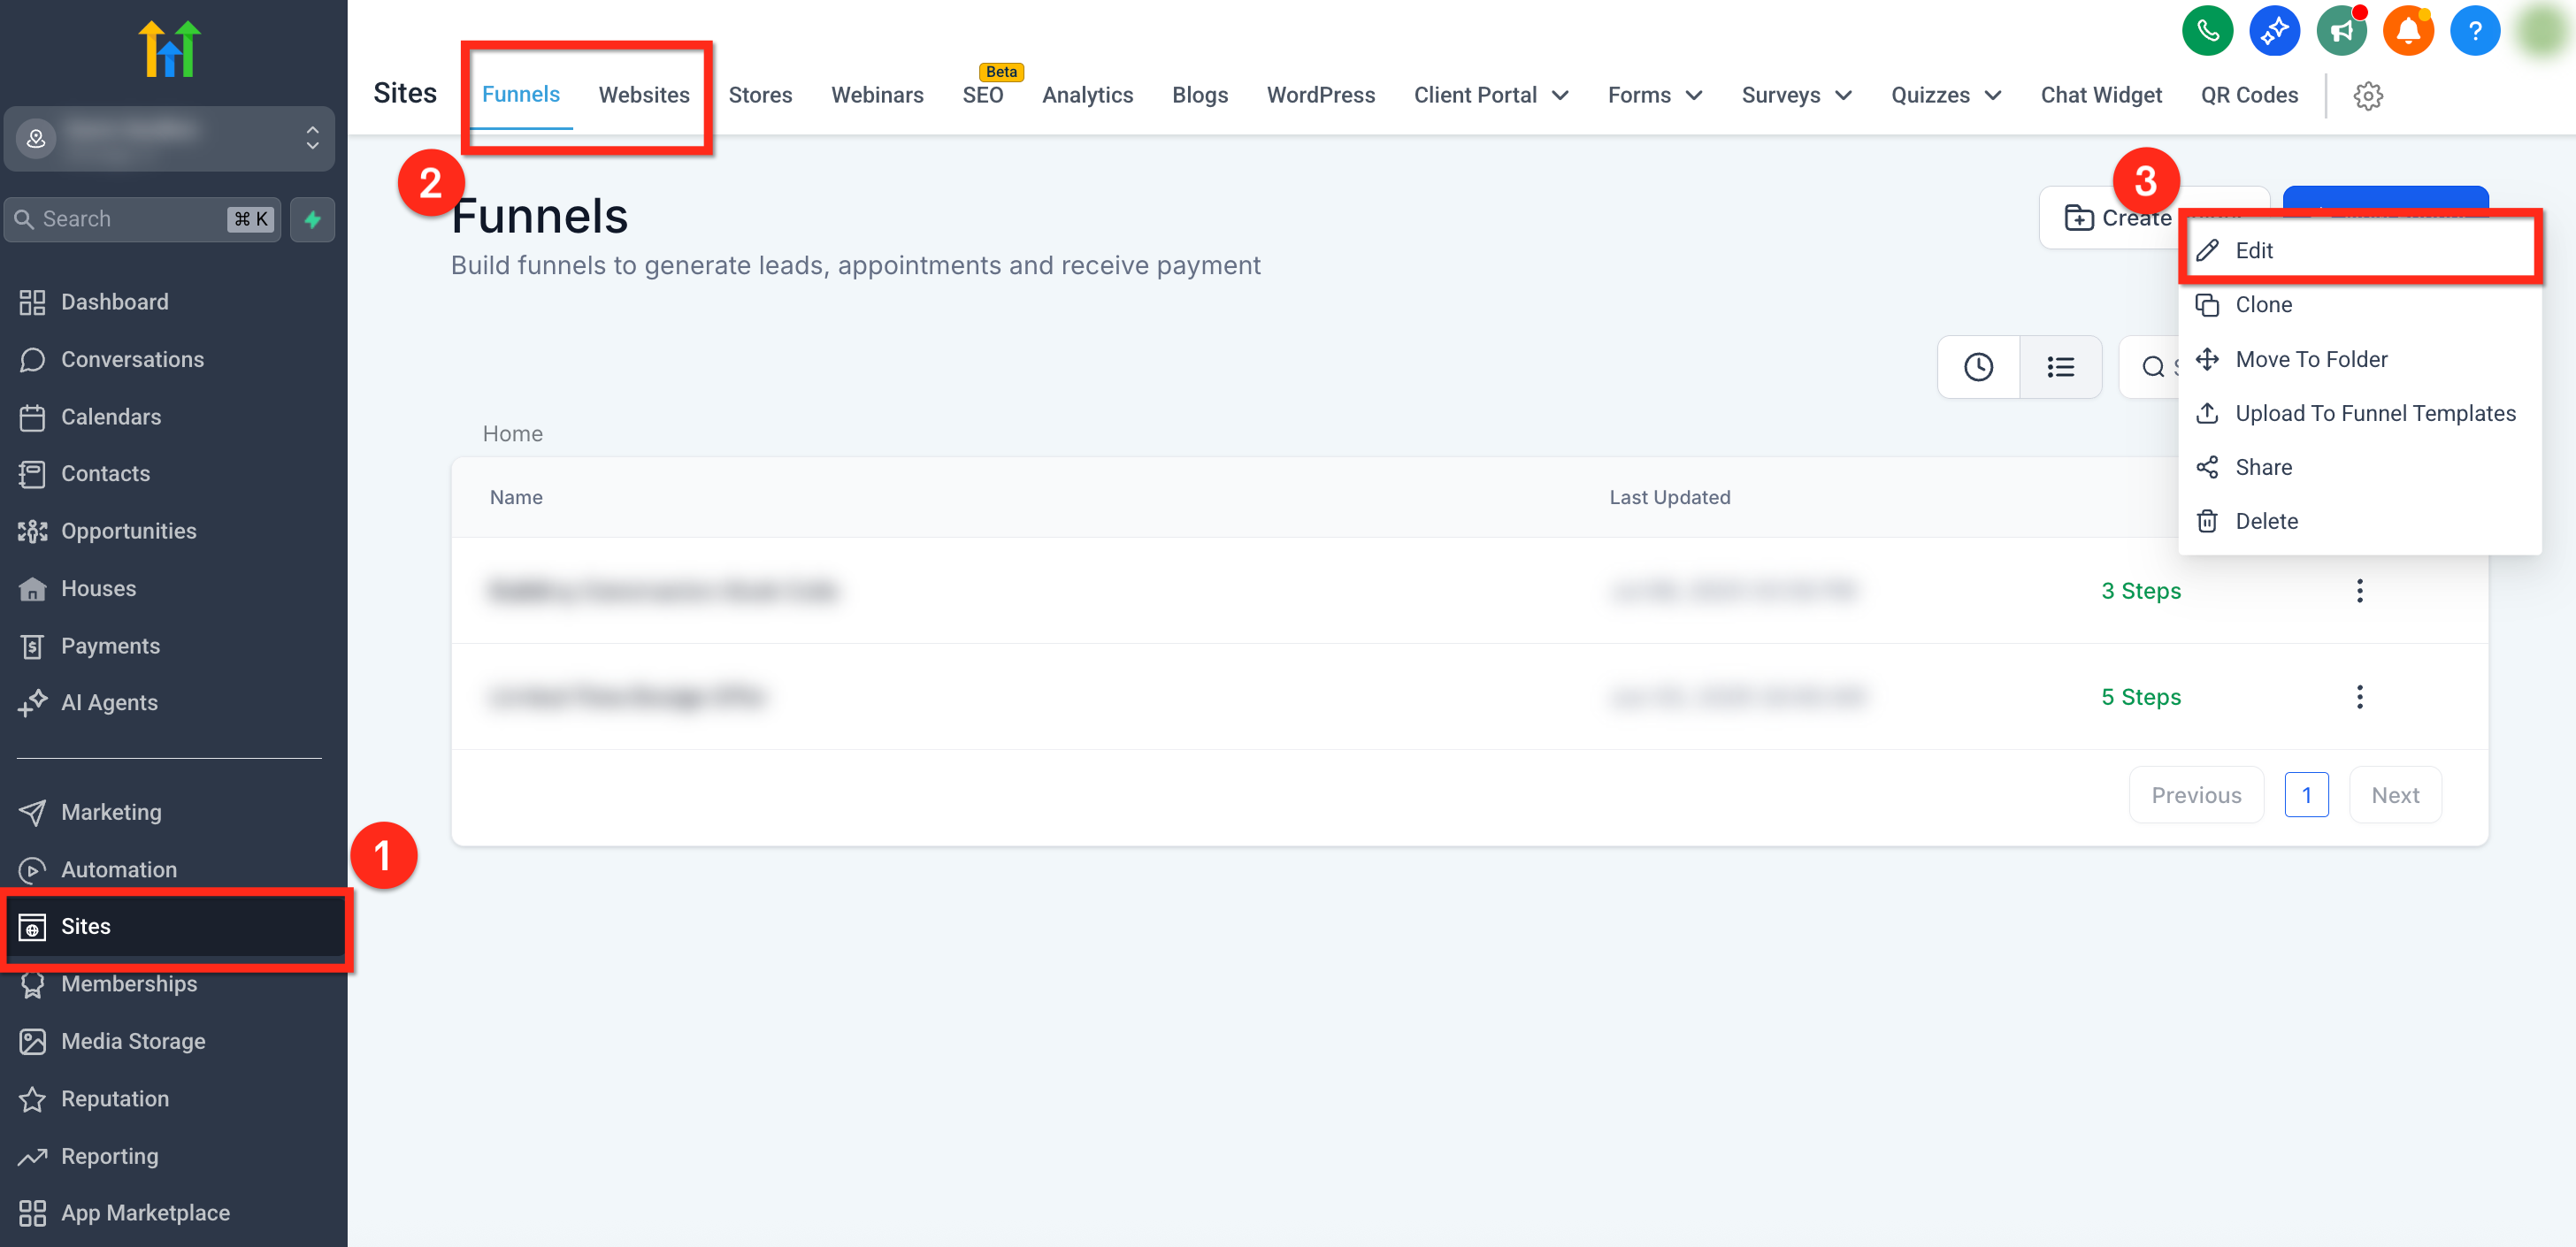
- Select Sites from the left navigation menu.
- Choose Funnels or Sites from the top navigation ribbon.
- Click the three dot menu next to the desired funnel or site and pick Edit.
- In the secondary navigation bar, click the Stats tab.
- Use the timeline drop down in the upper right corner to set a custom date range.
06What it looks like in HighLevel
07How it connects to the rest of HighLevel
- Add tracking code to funnels and websites Add tracking code
- Add a two step order form in HighLevel funnels Two step order form
- HighLevel pricing and plans Pricing
Michael's take

If your business runs only simple landing pages with no sales or you already use a dedicated analytics suite, adding Funnel Statistics may add little value. In those cases the extra time to check another dashboard might not justify the effort.