
01Who this is for
- Marketing managers can monitor cross platform engagement to decide where to allocate resources.
- Social media agencies benefit by reviewing client account performance from one view.
- Small business owners gain quick insight into which posts drive the most reach without leaving HighLevel.
02Social Planner advanced analytics, explained
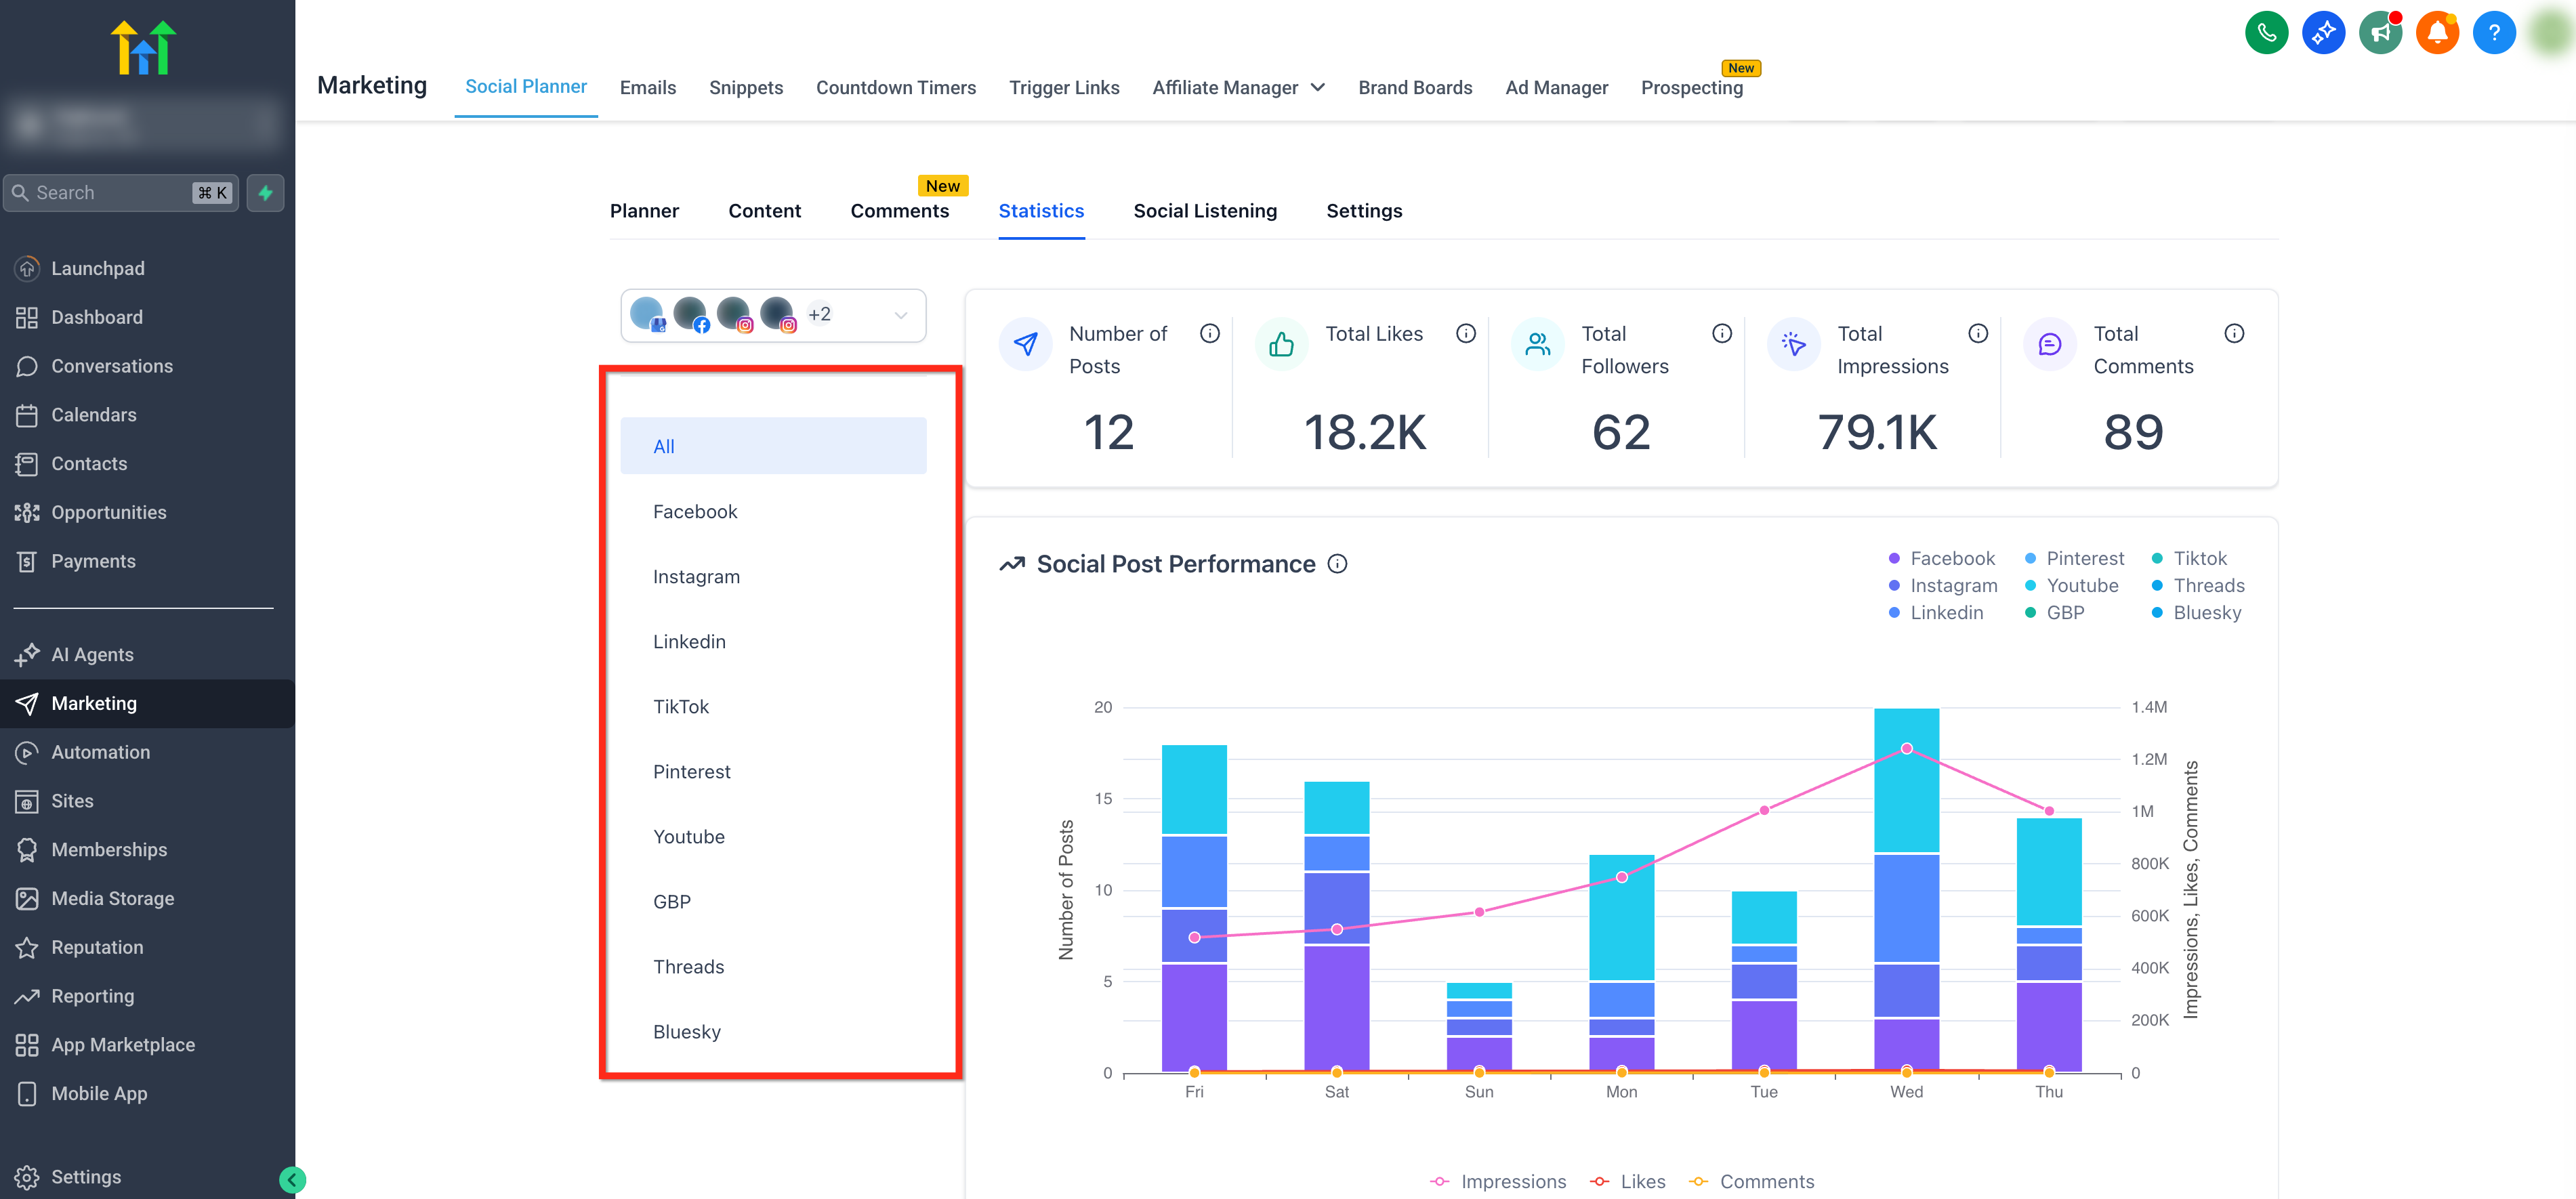
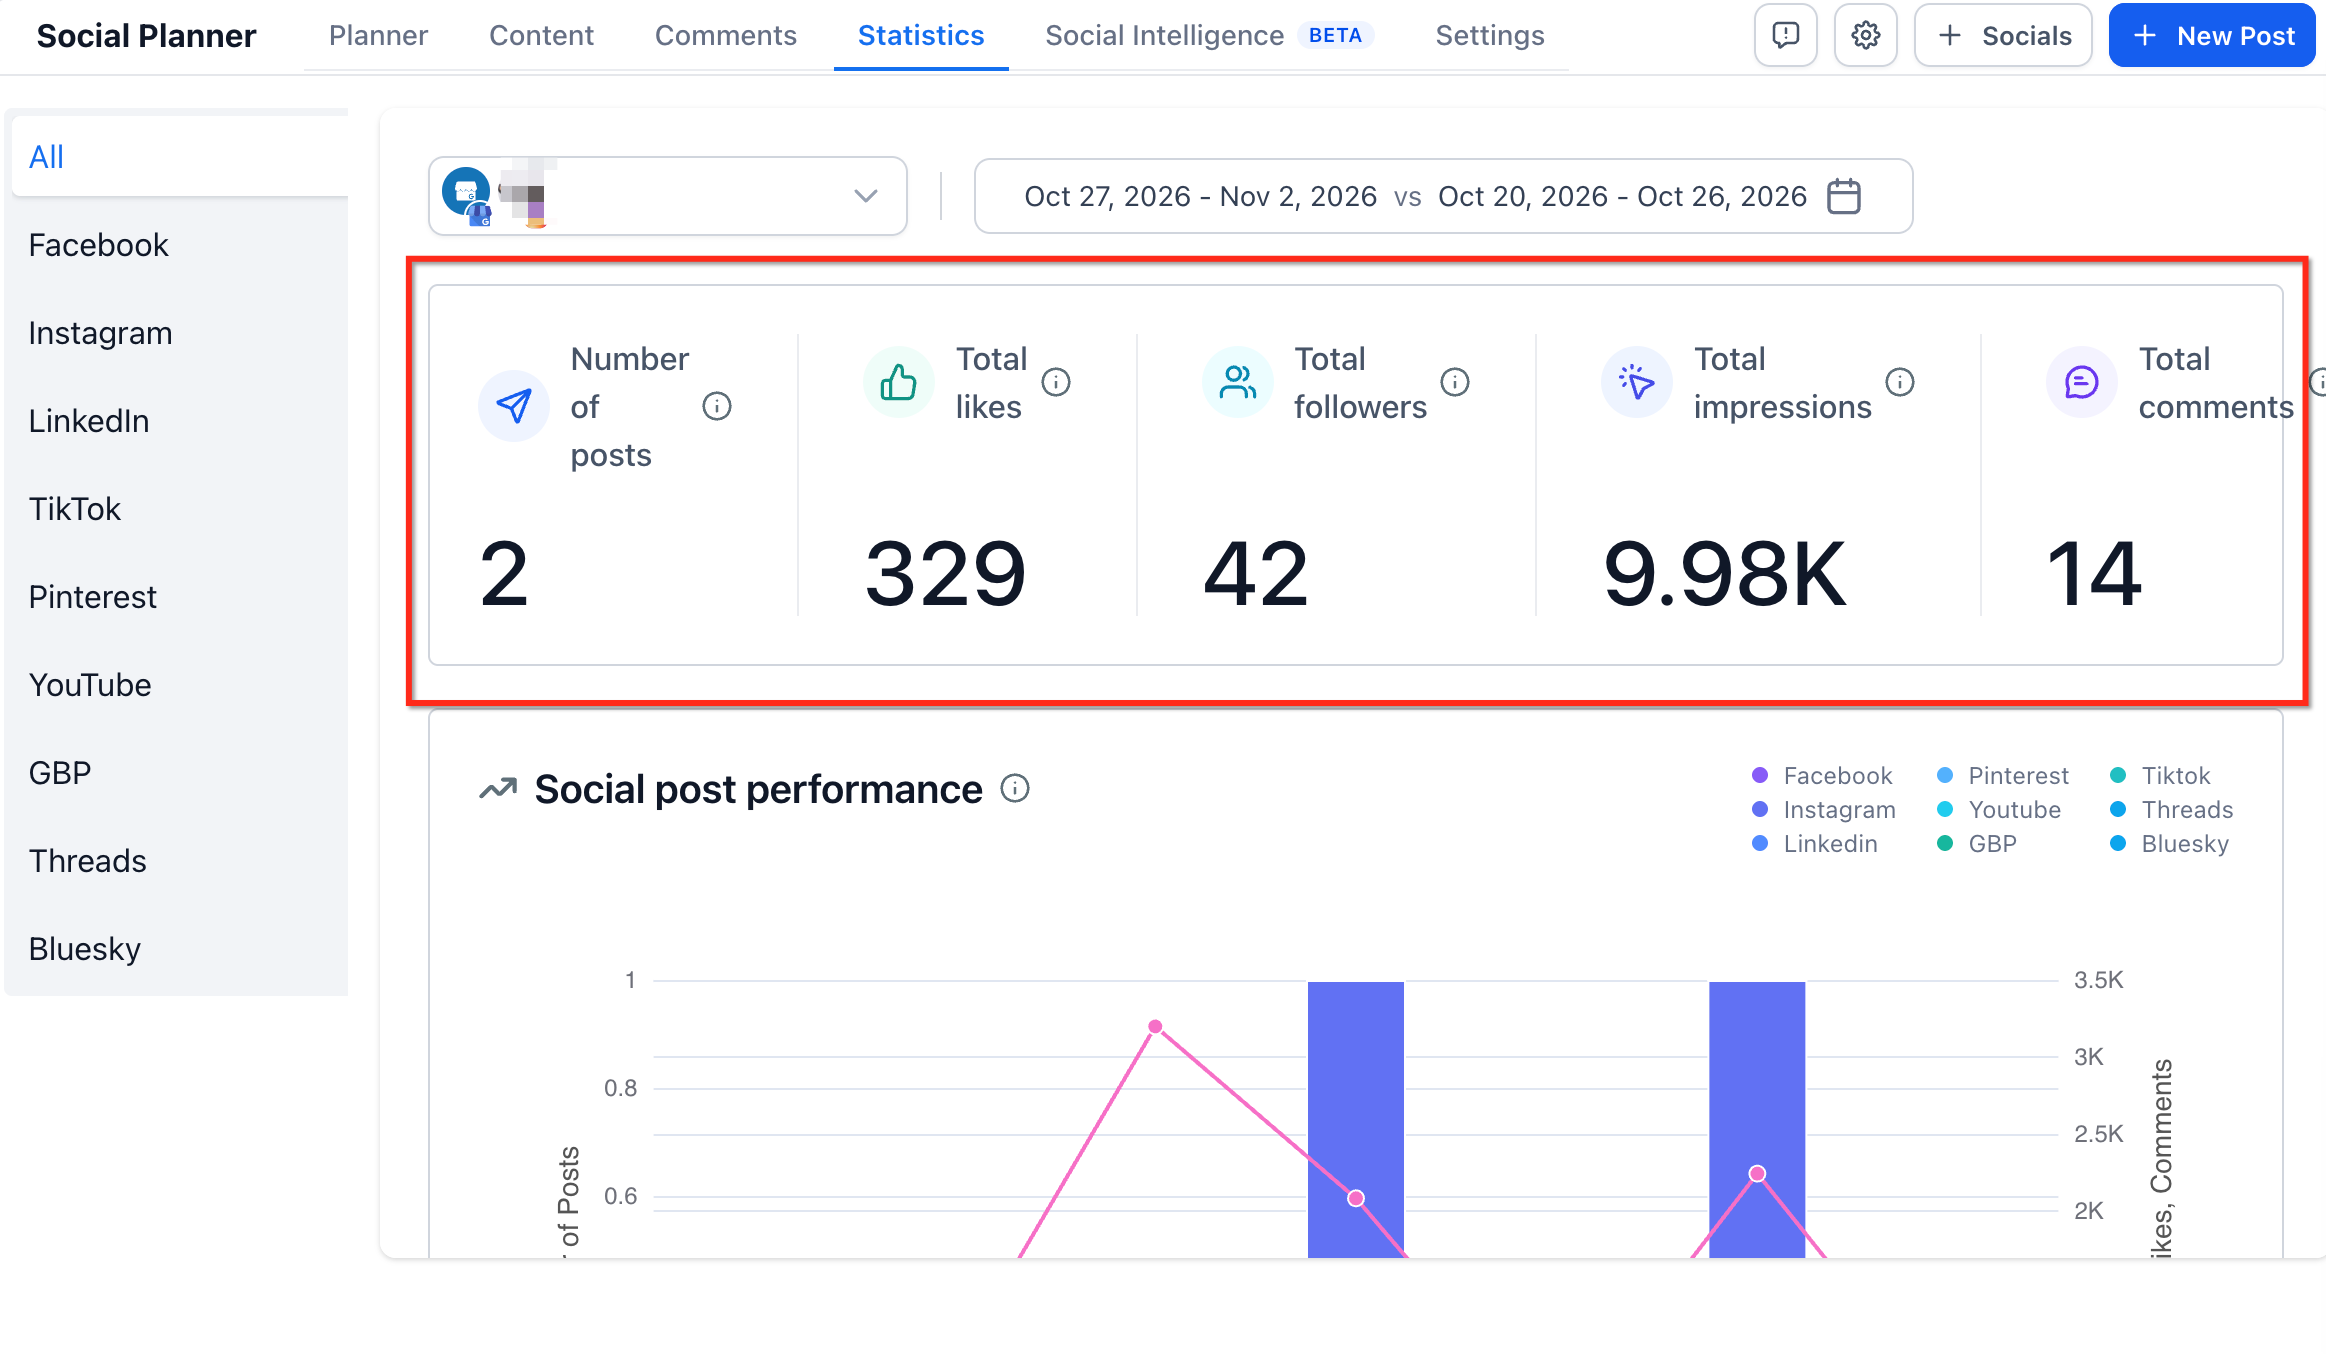
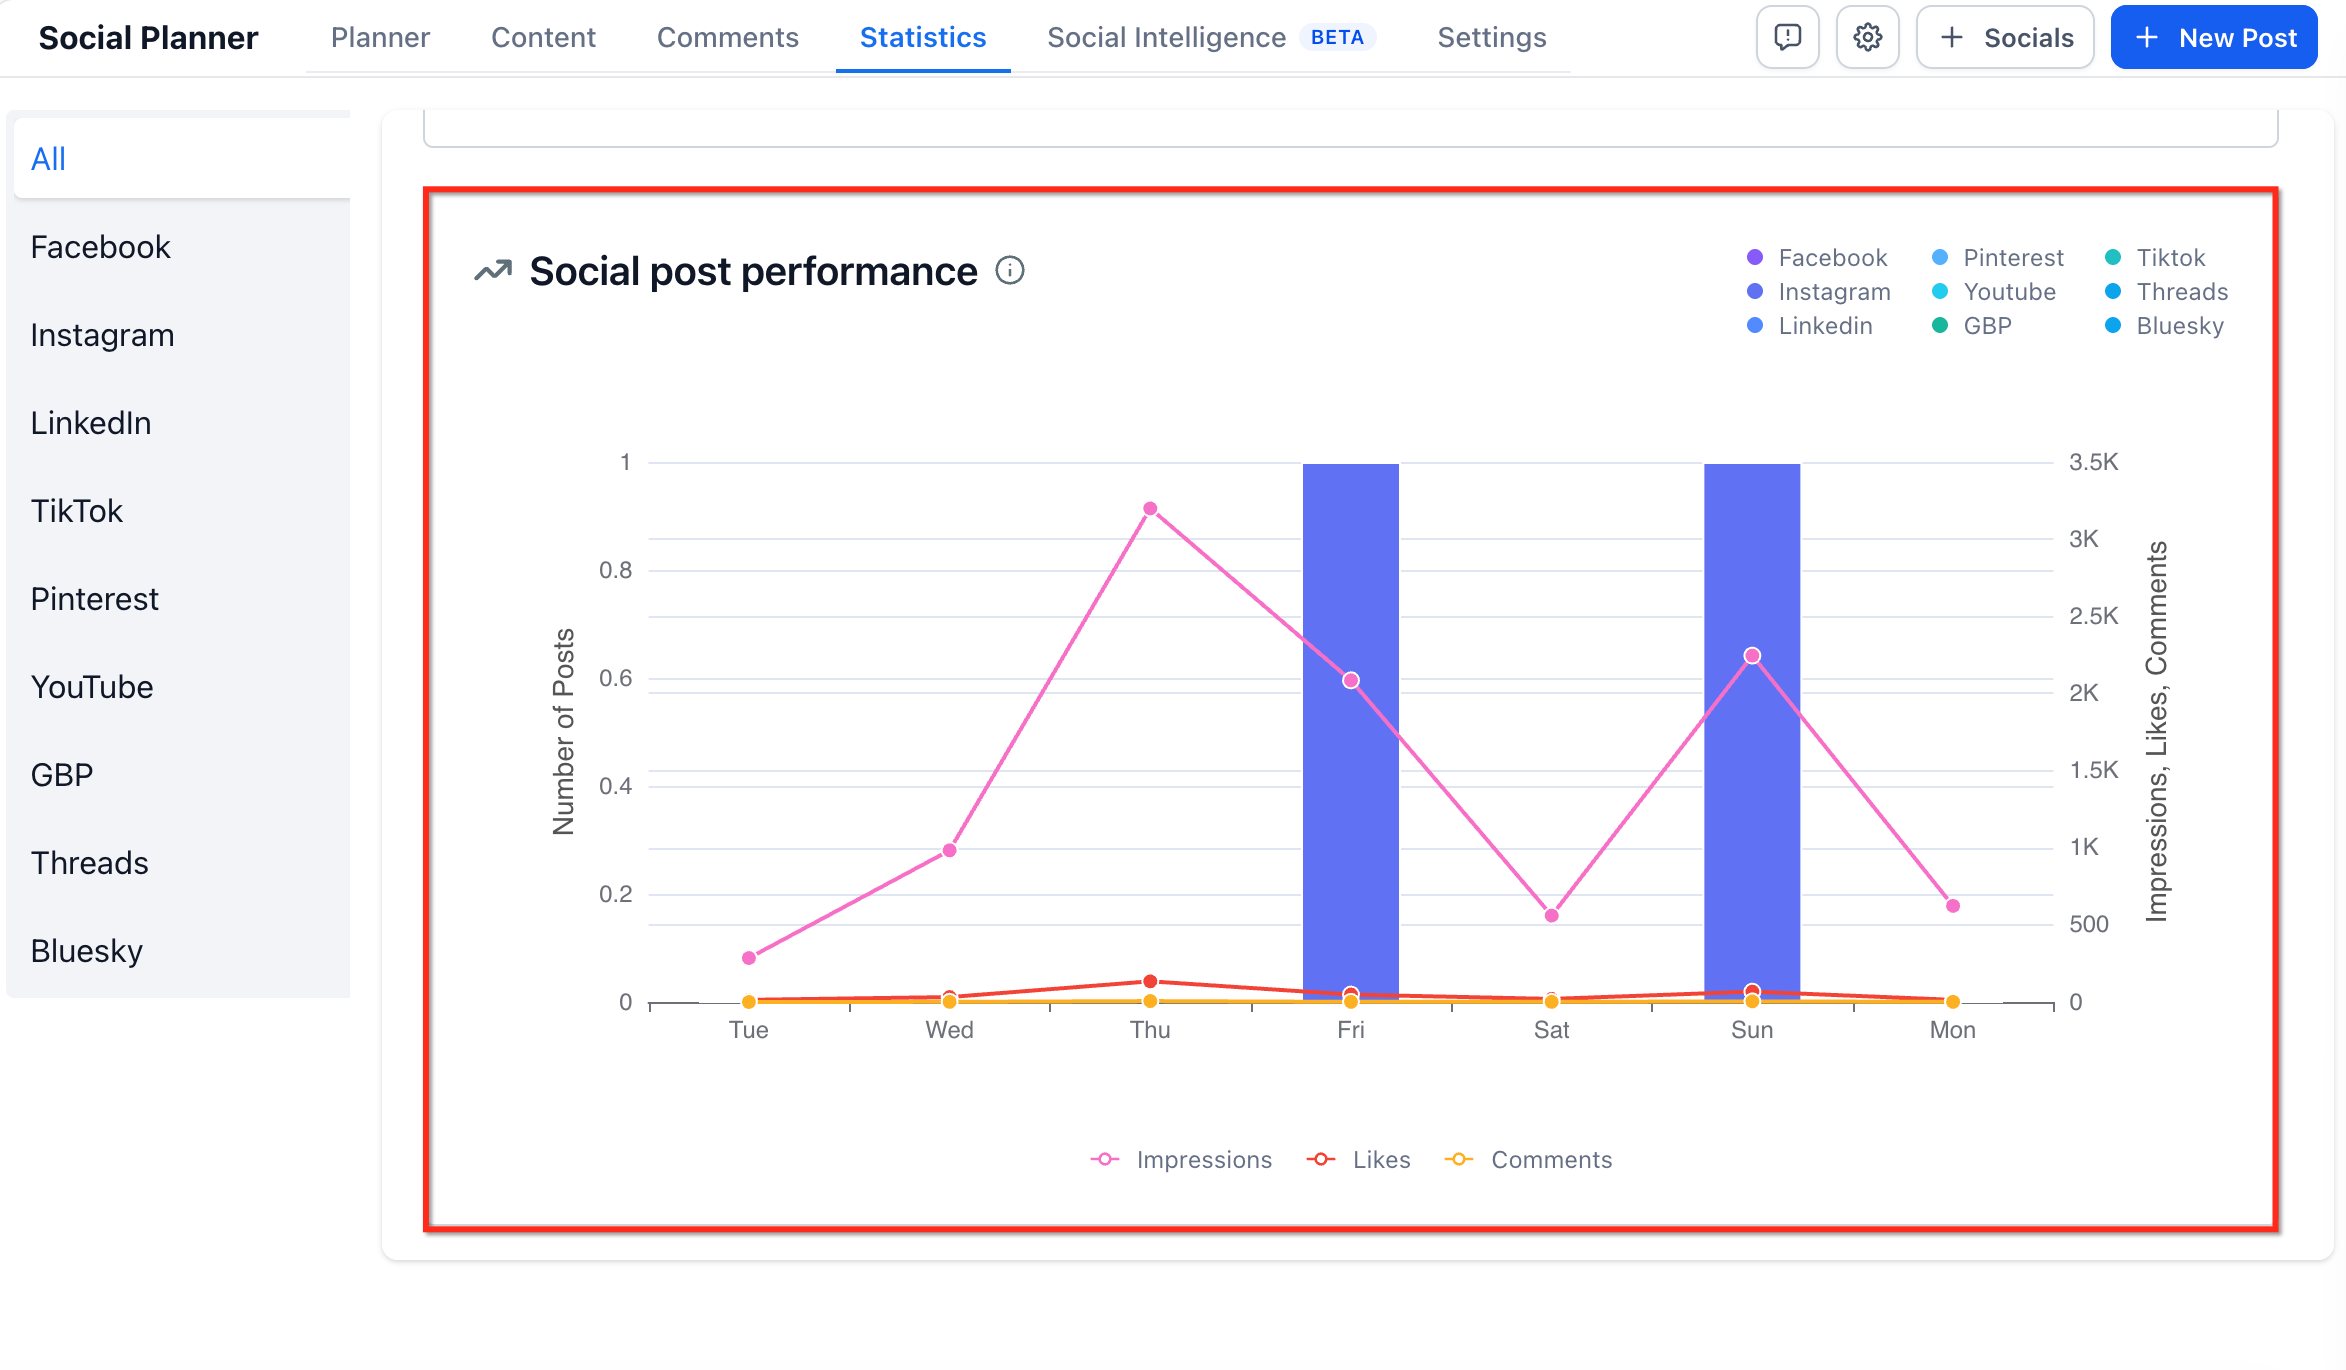
Advanced Analytics aggregates data from all supported social networks and displays it on a unified dashboard. The dashboard presents key performance indicators such as total posts, likes, comments, followers, impressions and reach. Interactive graphs show weekly posting trends and daily engagement totals.
Metric availability differs by platform. For example, Facebook and Instagram provide likes, comments, followers and Instagram demographic data, while Threads and Bluesky offer limited metrics. Some platforms introduce a one day delay before data appears, and TikTok Business accounts may take two days.
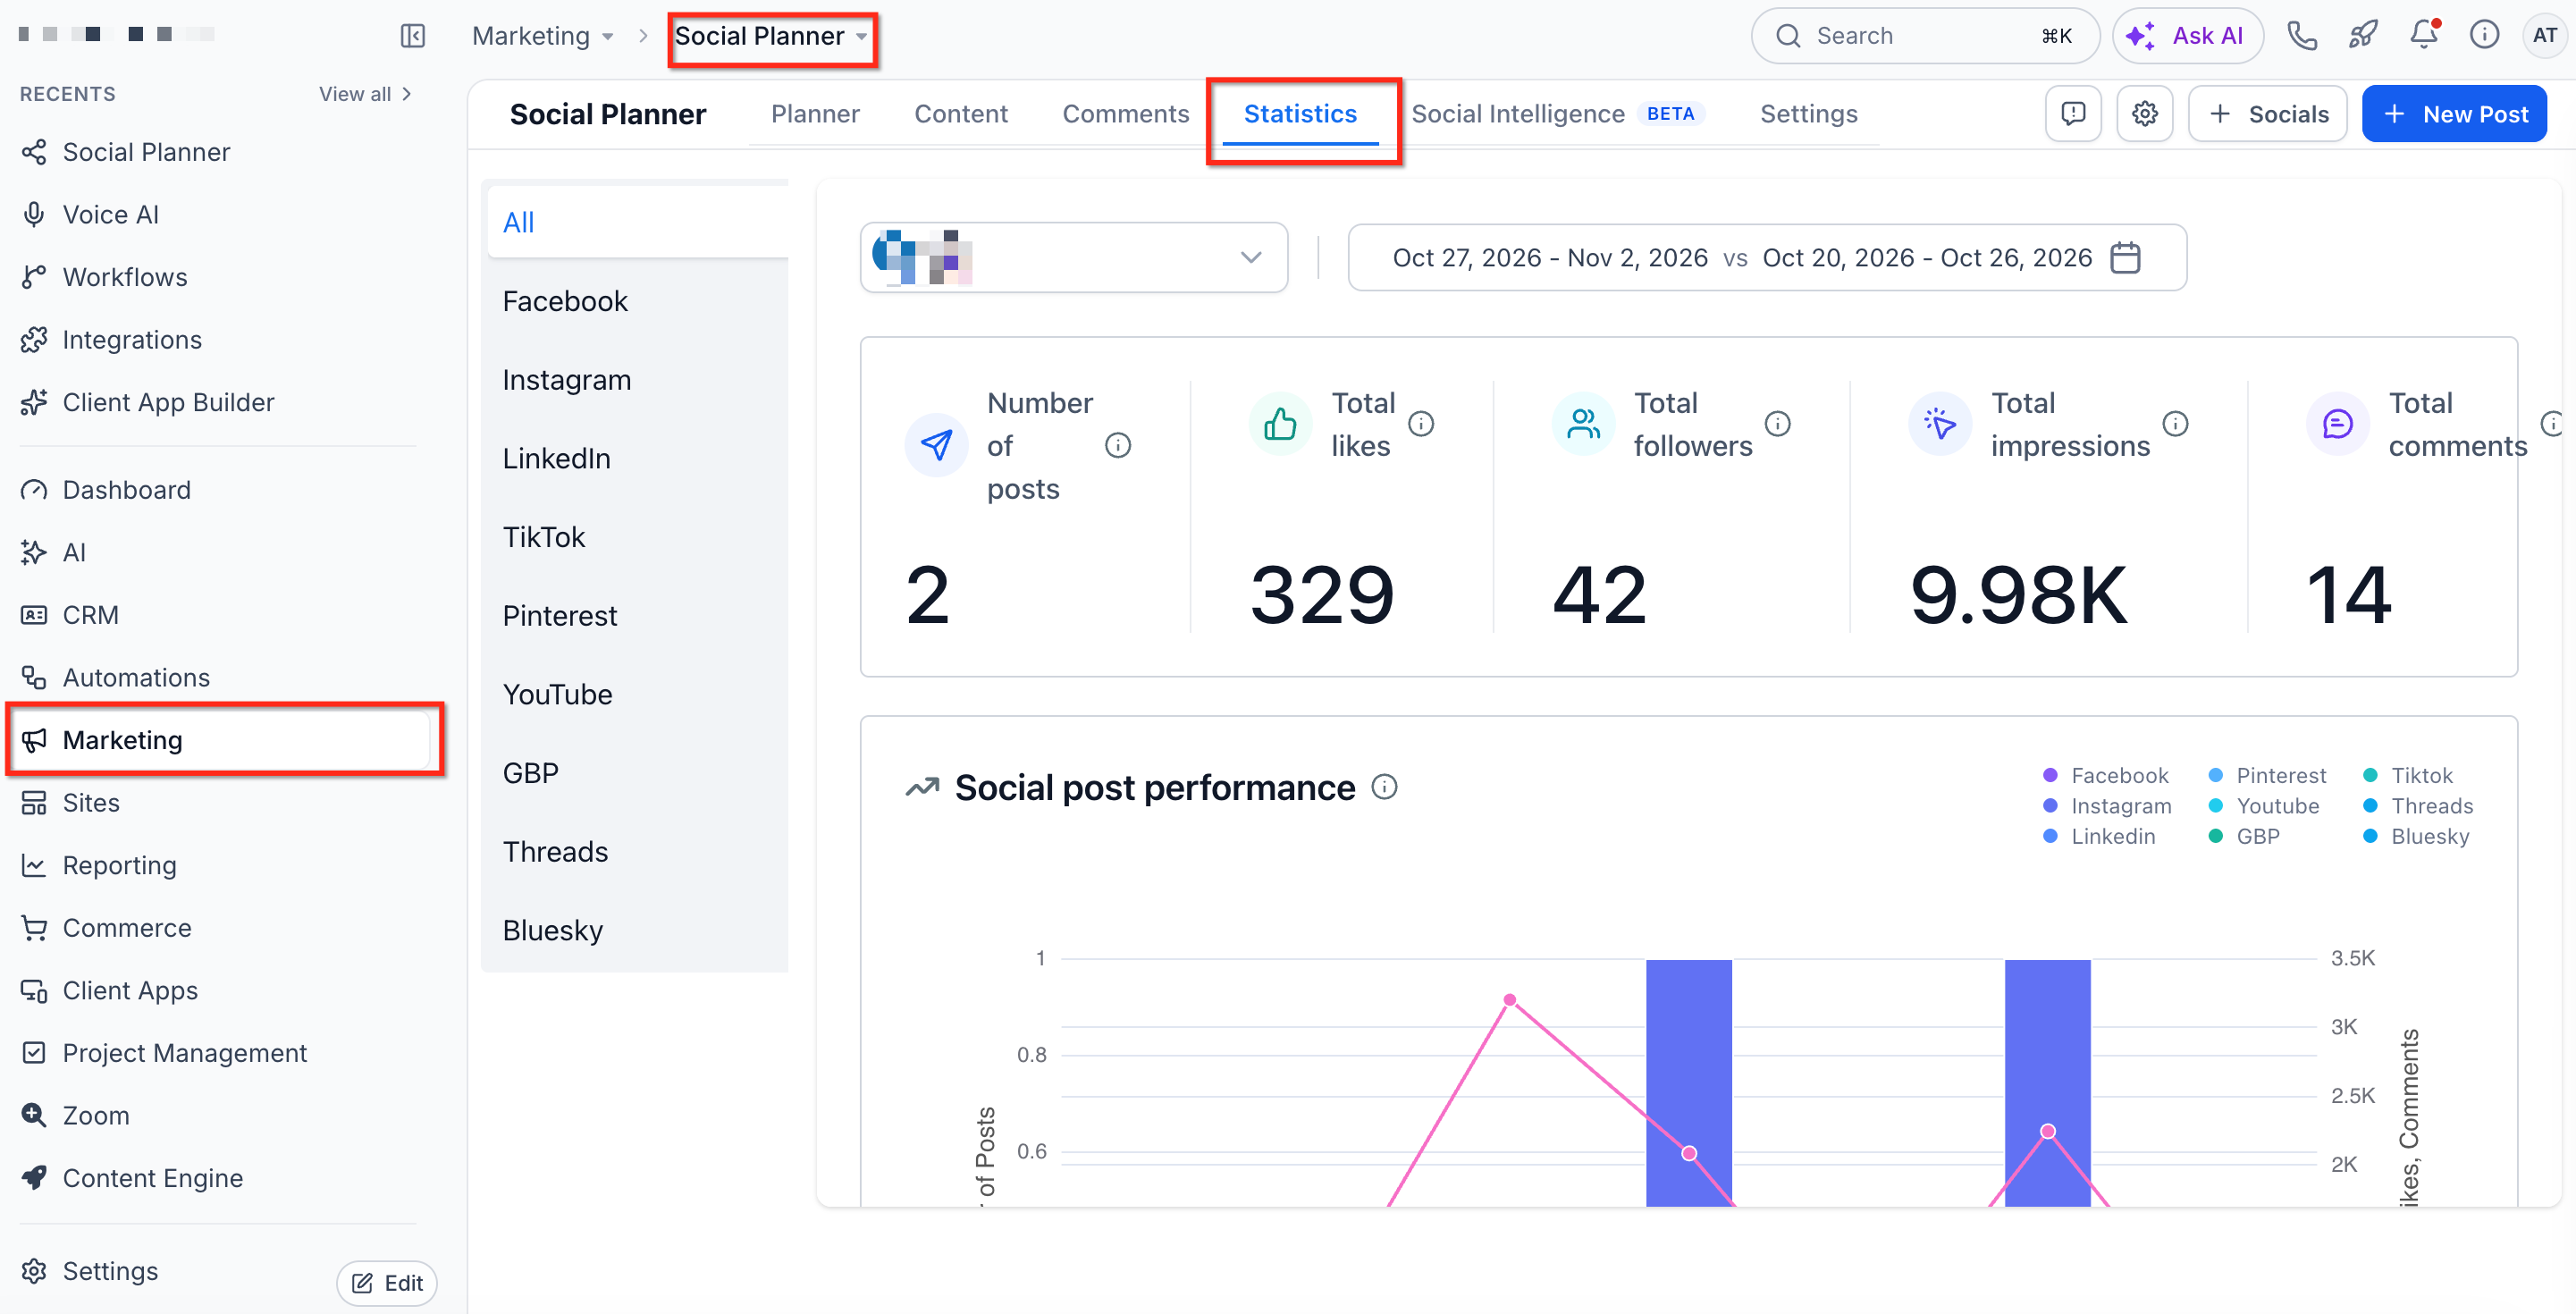
The analytics view lives under Marketing > Social Planner > Statistics. From there you can filter results by individual accounts or by platform, and you can open a post’s details modal to see post specific statistics for supported networks.
03How businesses use Social Planner advanced analytics
- Restaurant owner. The owner connects the restaurant’s Facebook, Instagram and Google Business Profile accounts, then opens the Statistics page to track weekly post reach and impressions. By filtering to the Instagram account, they see age and gender demographics to tailor menu promotions.
- Fitness studio. The studio links its TikTok Business and LinkedIn page accounts, accesses Advanced Analytics, and uses the platform selector to compare engagement levels. The studio reviews the Top Performing Posts report to identify which class videos generate the most likes and comments.
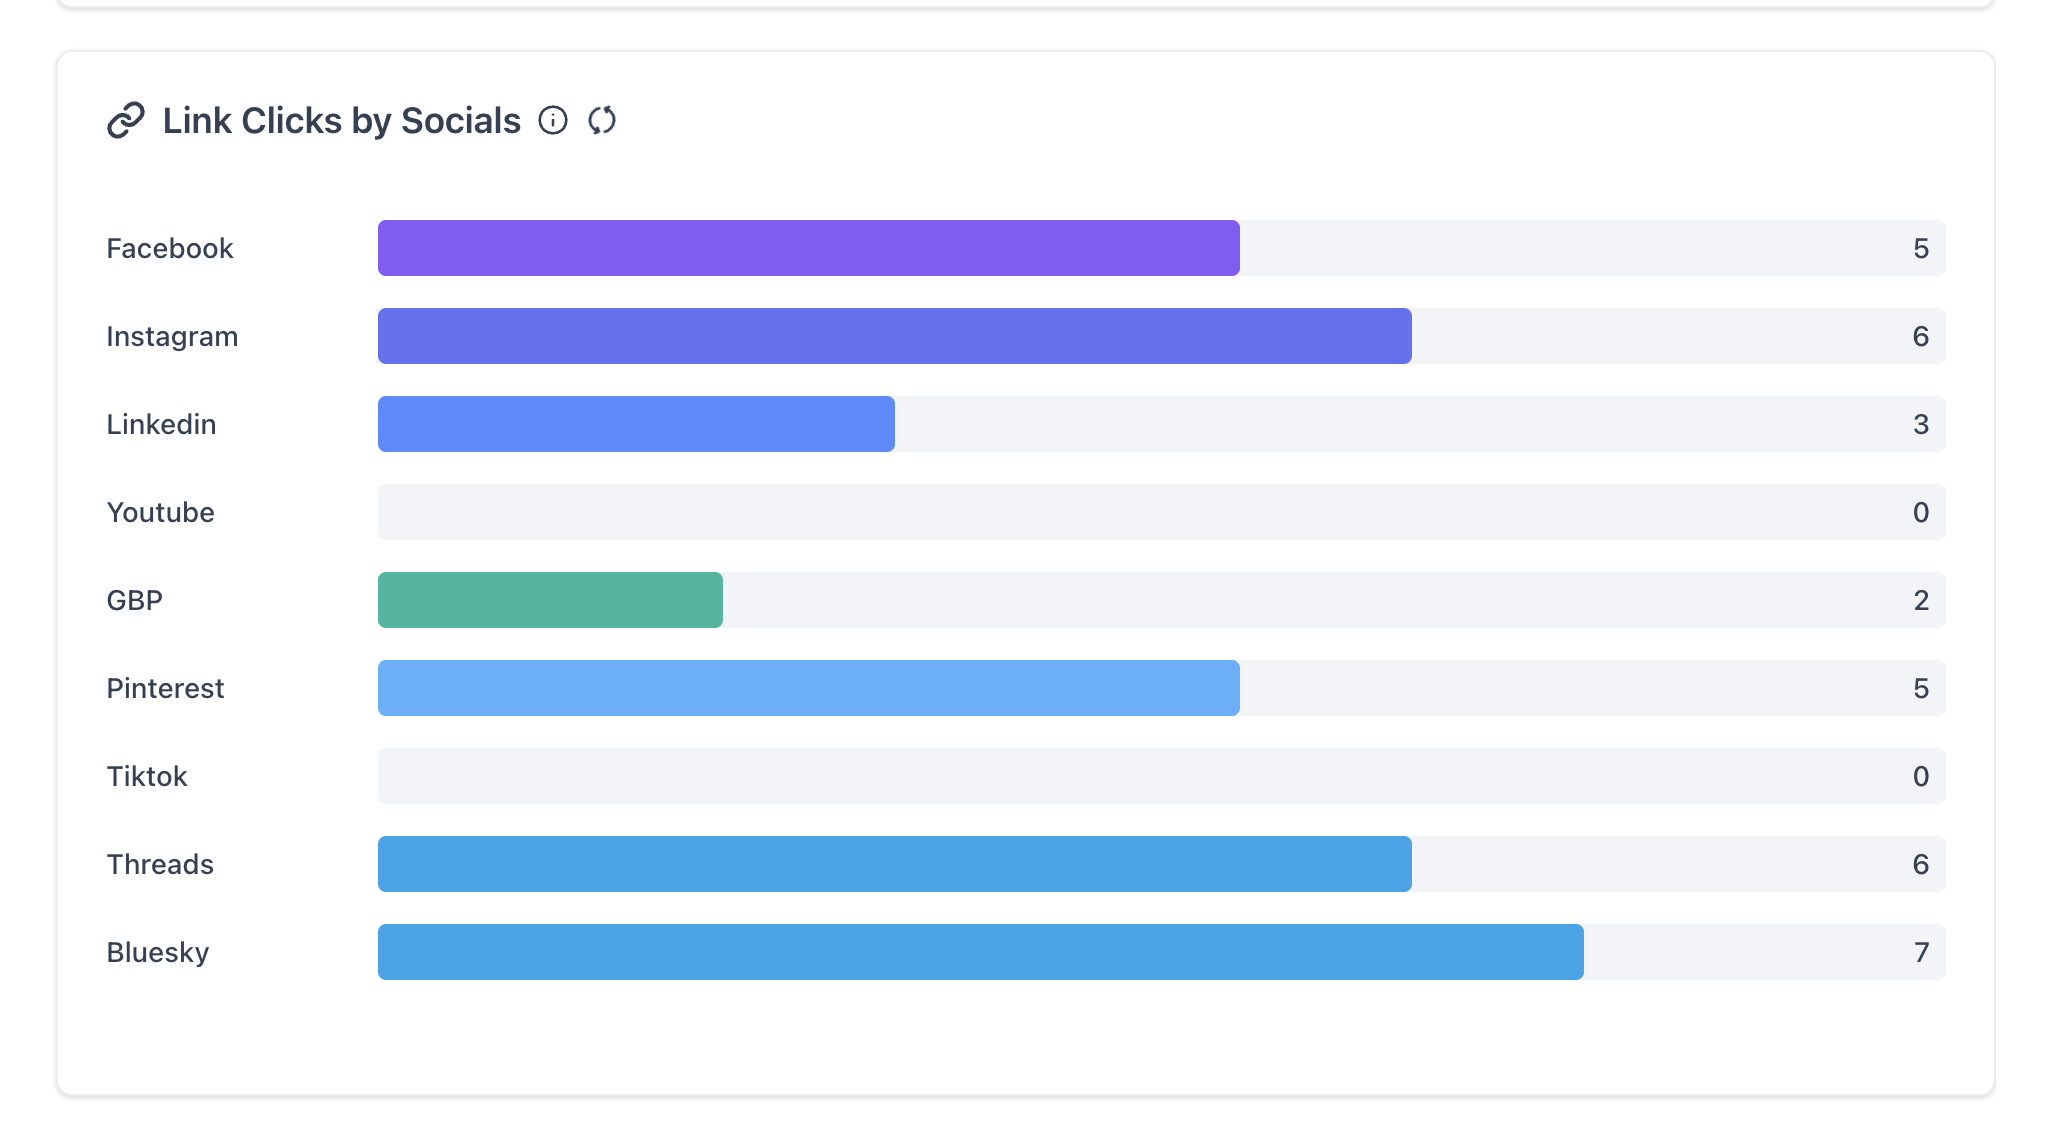
- Ecommerce boutique. The boutique creates shortened links in the Social Planner, publishes posts on Facebook and Pinterest, then checks the Link Clicks report in the analytics dashboard. Filtering by Facebook shows the number of clicks each product link receives, guiding future ad spend.
04The numbers and rules that matter
- Supported platforms: Facebook, Instagram, LinkedIn, YouTube, Pinterest, TikTok, Google Business Profile, Threads and Bluesky.
- TikTok supports only BUSINESS profiles; data may take 1 to 2 days to appear.
- Pinterest data may take n 2 days to reflect correctly.
- LinkedIn supports only Pages; follower data may be delayed n 2 days.
- Threads does not support impressions, post reach, follower count, gender data or advanced engagement metrics; metrics have a T 1 day delay except post count.
- Bluesky supports impressions only; follower metrics, demographics and advanced engagement breakdowns are not supported; T 1 day delay except post count.
- Instagram demographics require at least 100 followers; below that threshold demographic metrics are unavailable.
- Metric availability varies by platform (e.g., Likes are unavailable on Pinterest, Impressions unavailable on LinkedIn).
05Before you start
- Social accounts must be connected to the Social Planner with appropriate permissions.
- For link click tracking, shortened links must be generated through the Social Planner.
06How to set up and use Social Planner advanced analytics in HighLevel
Open the Advanced Analytics dashboard
- Select Marketing, then Social Planner, and finally Statistics to view the analytics screen.
Filter data by platform or account
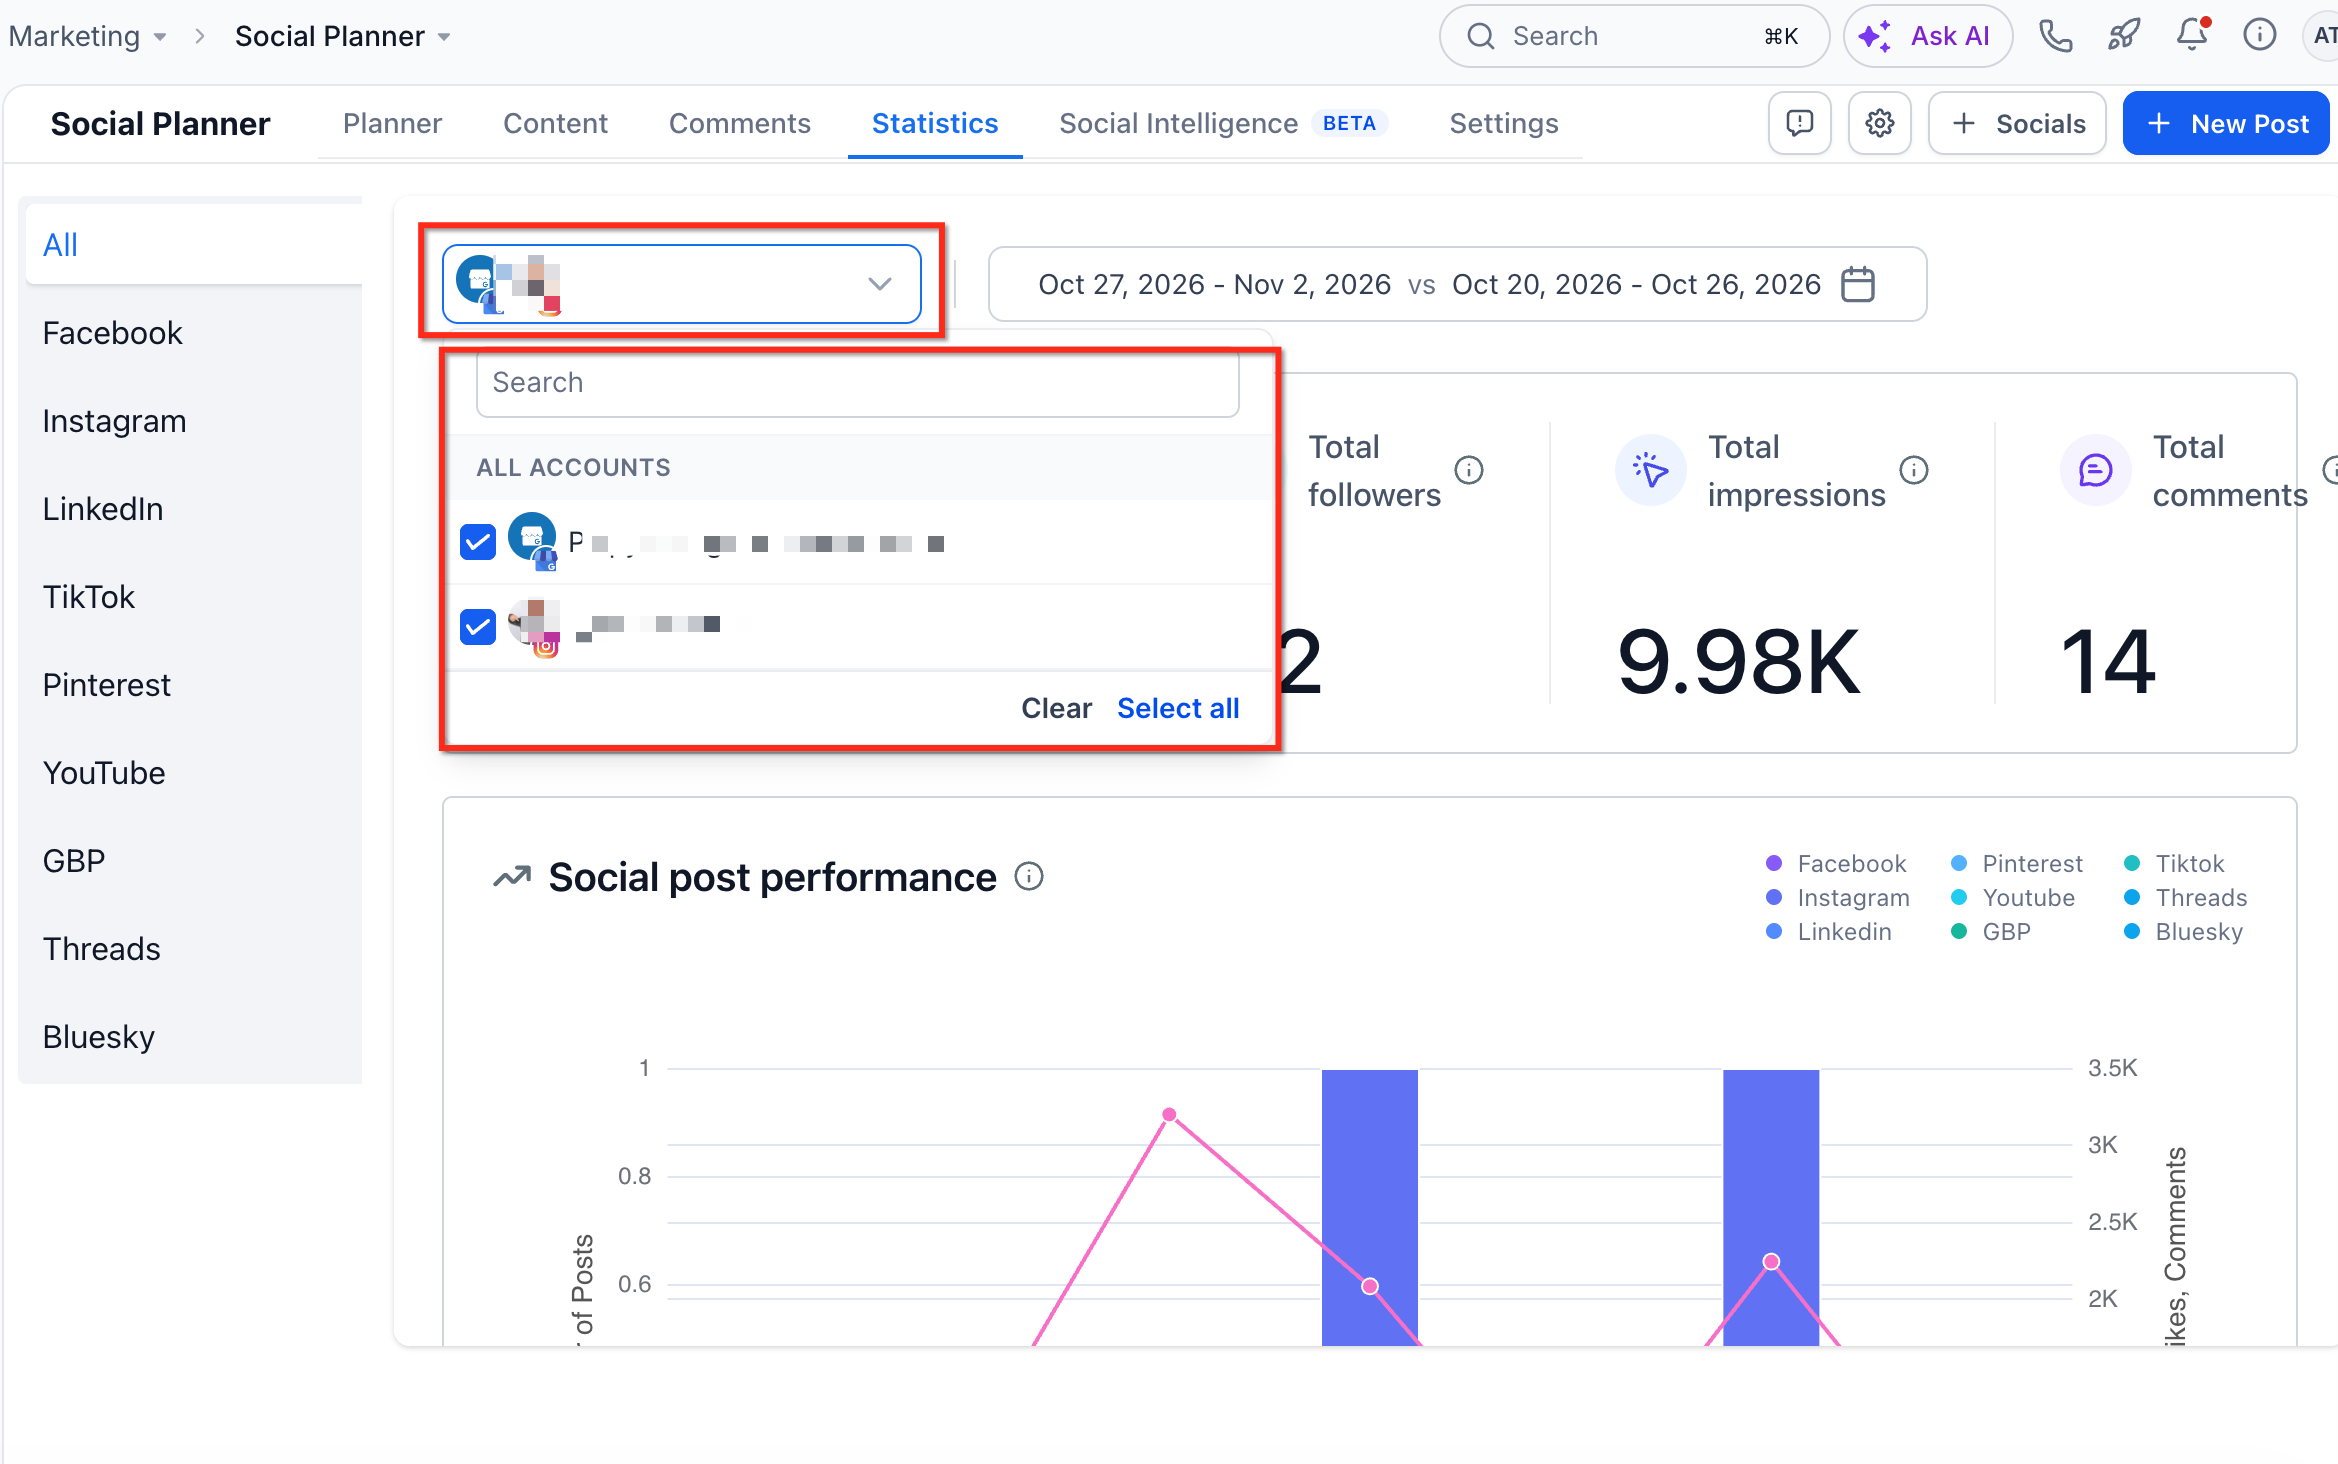
- Click the dropdown at the upper left, check the boxes for the desired accounts, and use the selector bar on the left to choose a specific platform or All for a combined view.
View post specific statistics
- In List View, click a post to open its details modal and see likes, comments, shares and other metrics for supported platforms.
07What it looks like in HighLevel
08Things to know before you rely on it
- Metric availability varies per platform; demographics are only available for Instagram when the account has at least 100 followers.
- TikTok Business data may be delayed by one to two days; Pinterest data can take two days.
- Threads does not provide impressions, reach, follower counts or demographic breakdowns.
- Bluesky currently offers only impressions; follower and demographic data are unavailable.
- Post specific stats are only shown for Facebook, Instagram, TikTok personal and LinkedIn page posts.
09How it connects to the rest of HighLevel
- Learn how to connect Facebook pages for analytics collection. Connect Facebook
- Set up Instagram integration to access demographics and engagement data. Connect Instagram
- Add a Google Business Profile to include call and direction metrics in analytics. Connect Google Business Profile
Michael's take

Most people think the dashboards will fast show every metric for every platform. In reality, each network limits what it shares and often adds a delay of a day or more. I would first verify which platforms deliver the data you need, then set up the filter to focus on those accounts.
Once you know the data flow, use the KPI overview to spot weekly shifts, then drill down into the Top Performing Posts report to reuse the winning content. A quick sanity check of the reauthentication alerts ensures your numbers stay current.