
01Who this is for
- Agency owners who need a single place to monitor financial results from app reselling, because the dashboard shows revenue, cost and profit per app.
- Account managers at agencies who track app adoption and profitability across subaccounts.
02Marketplace earnings dashboard, explained
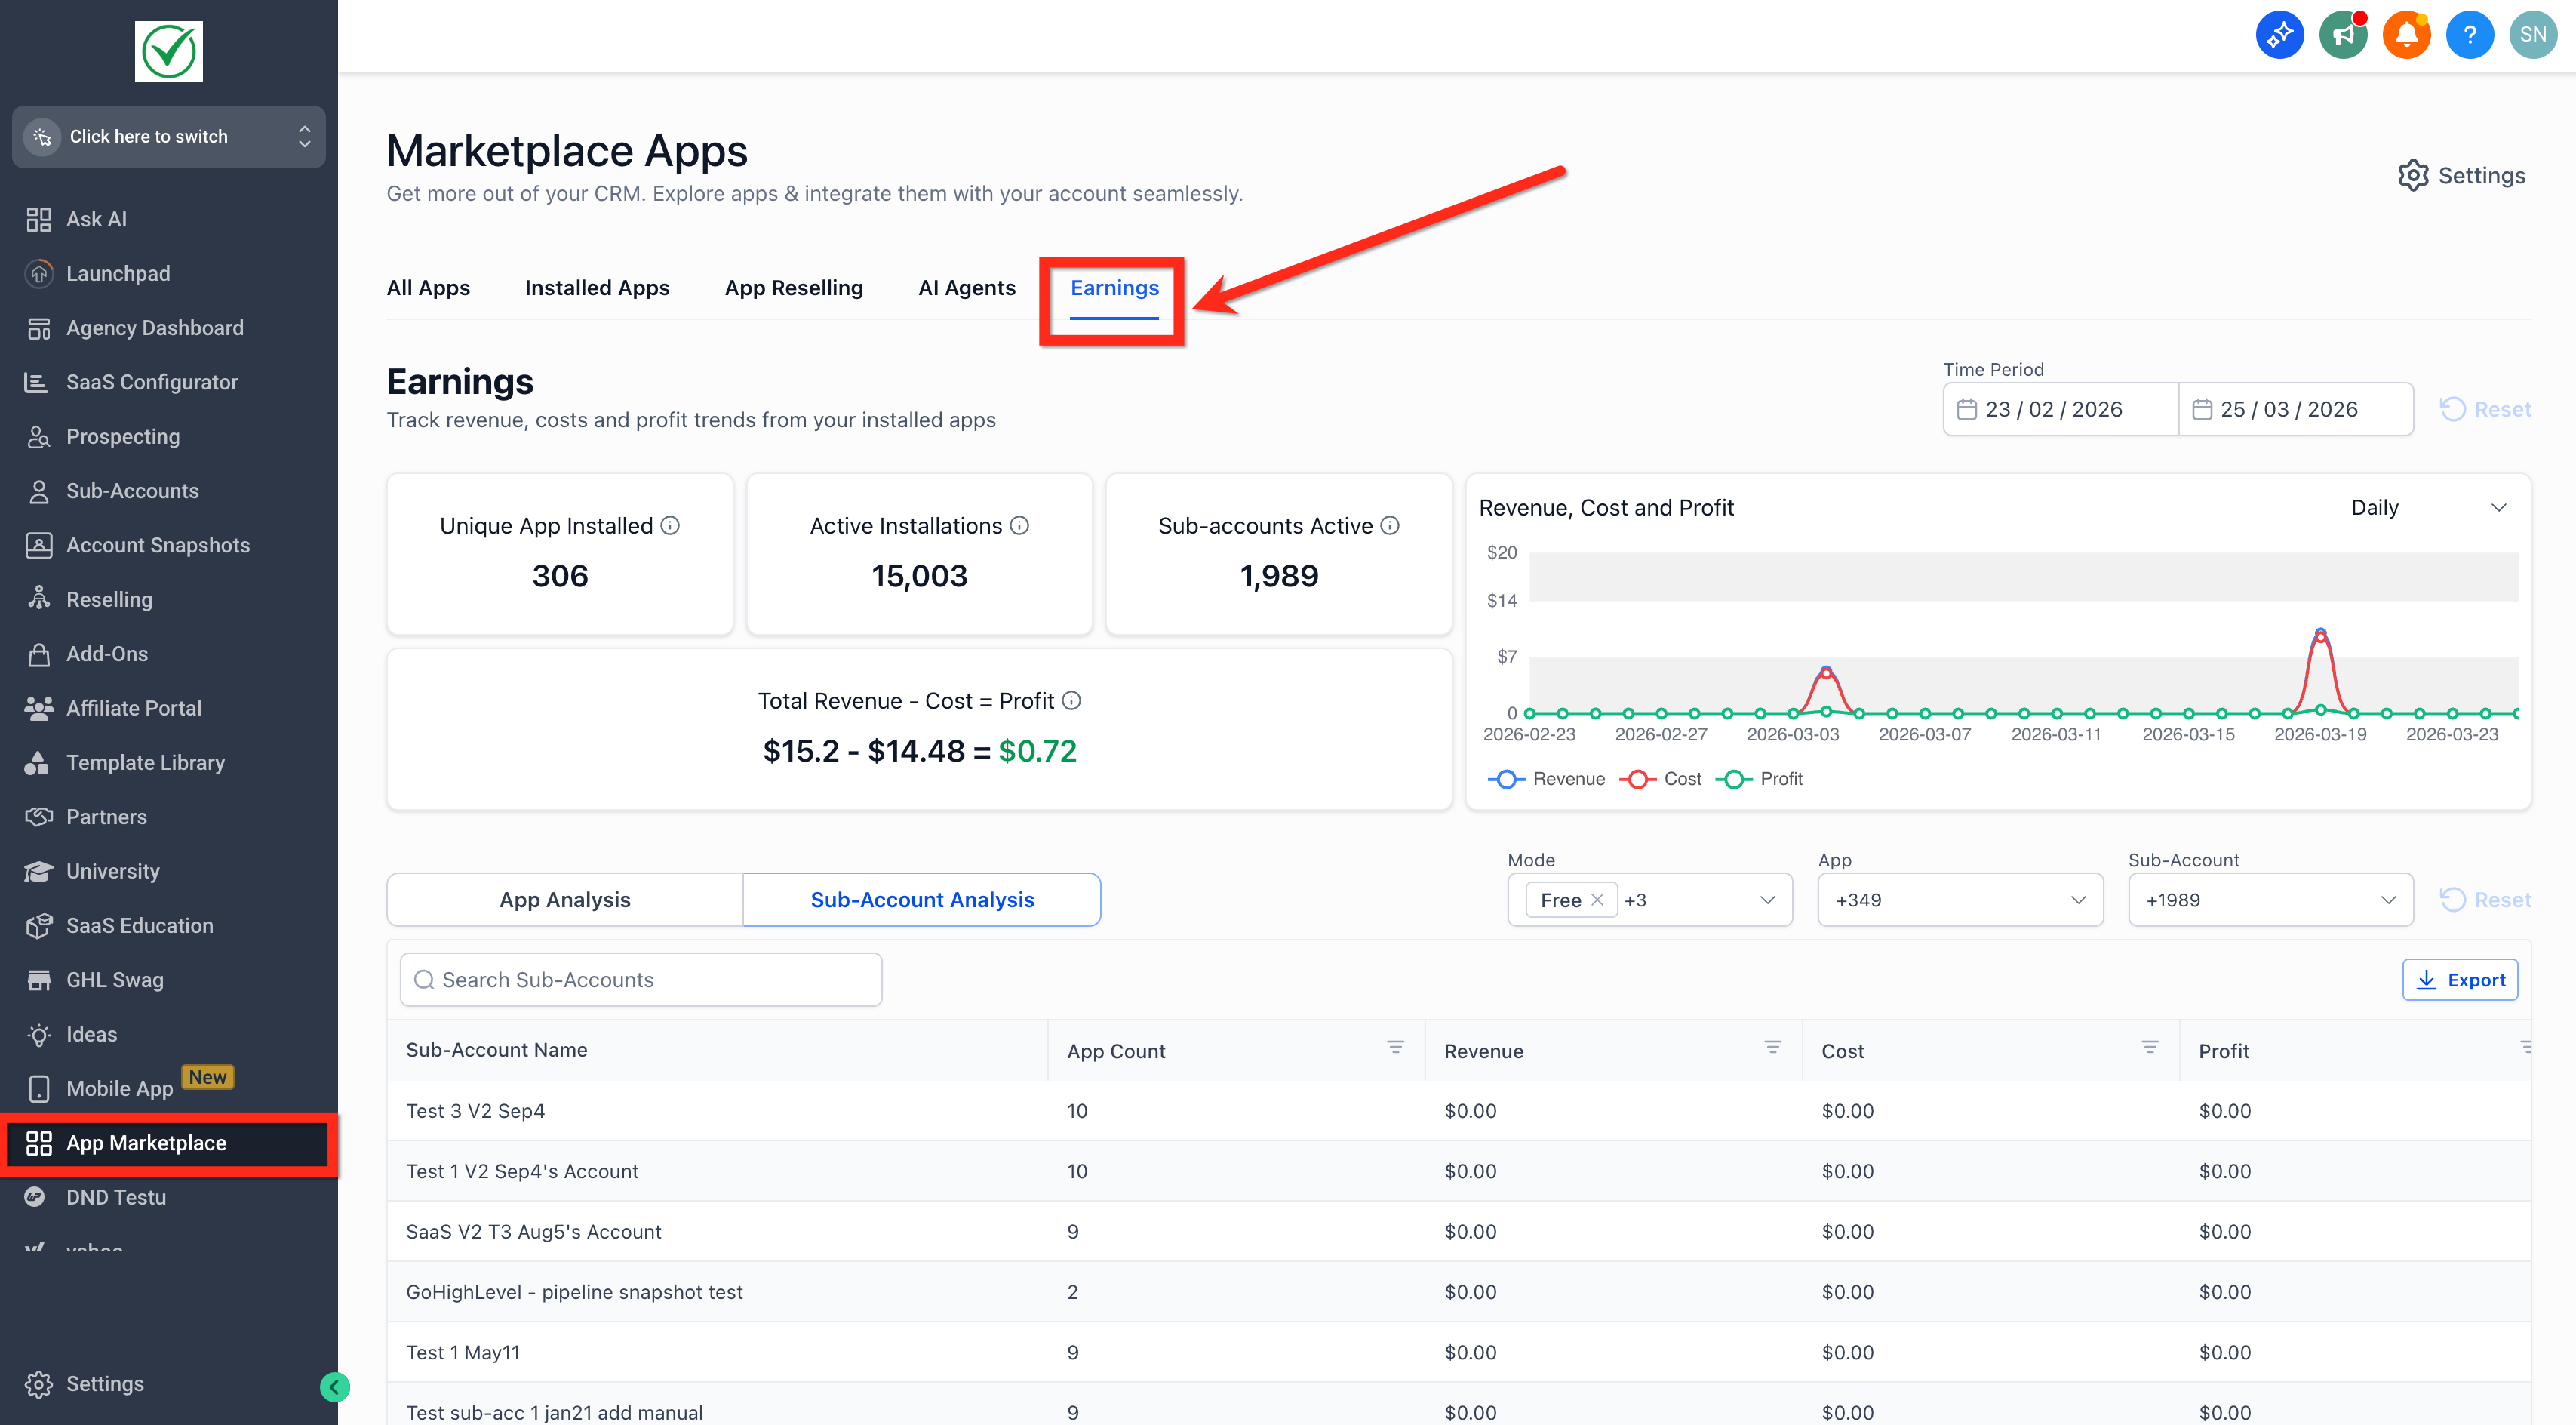
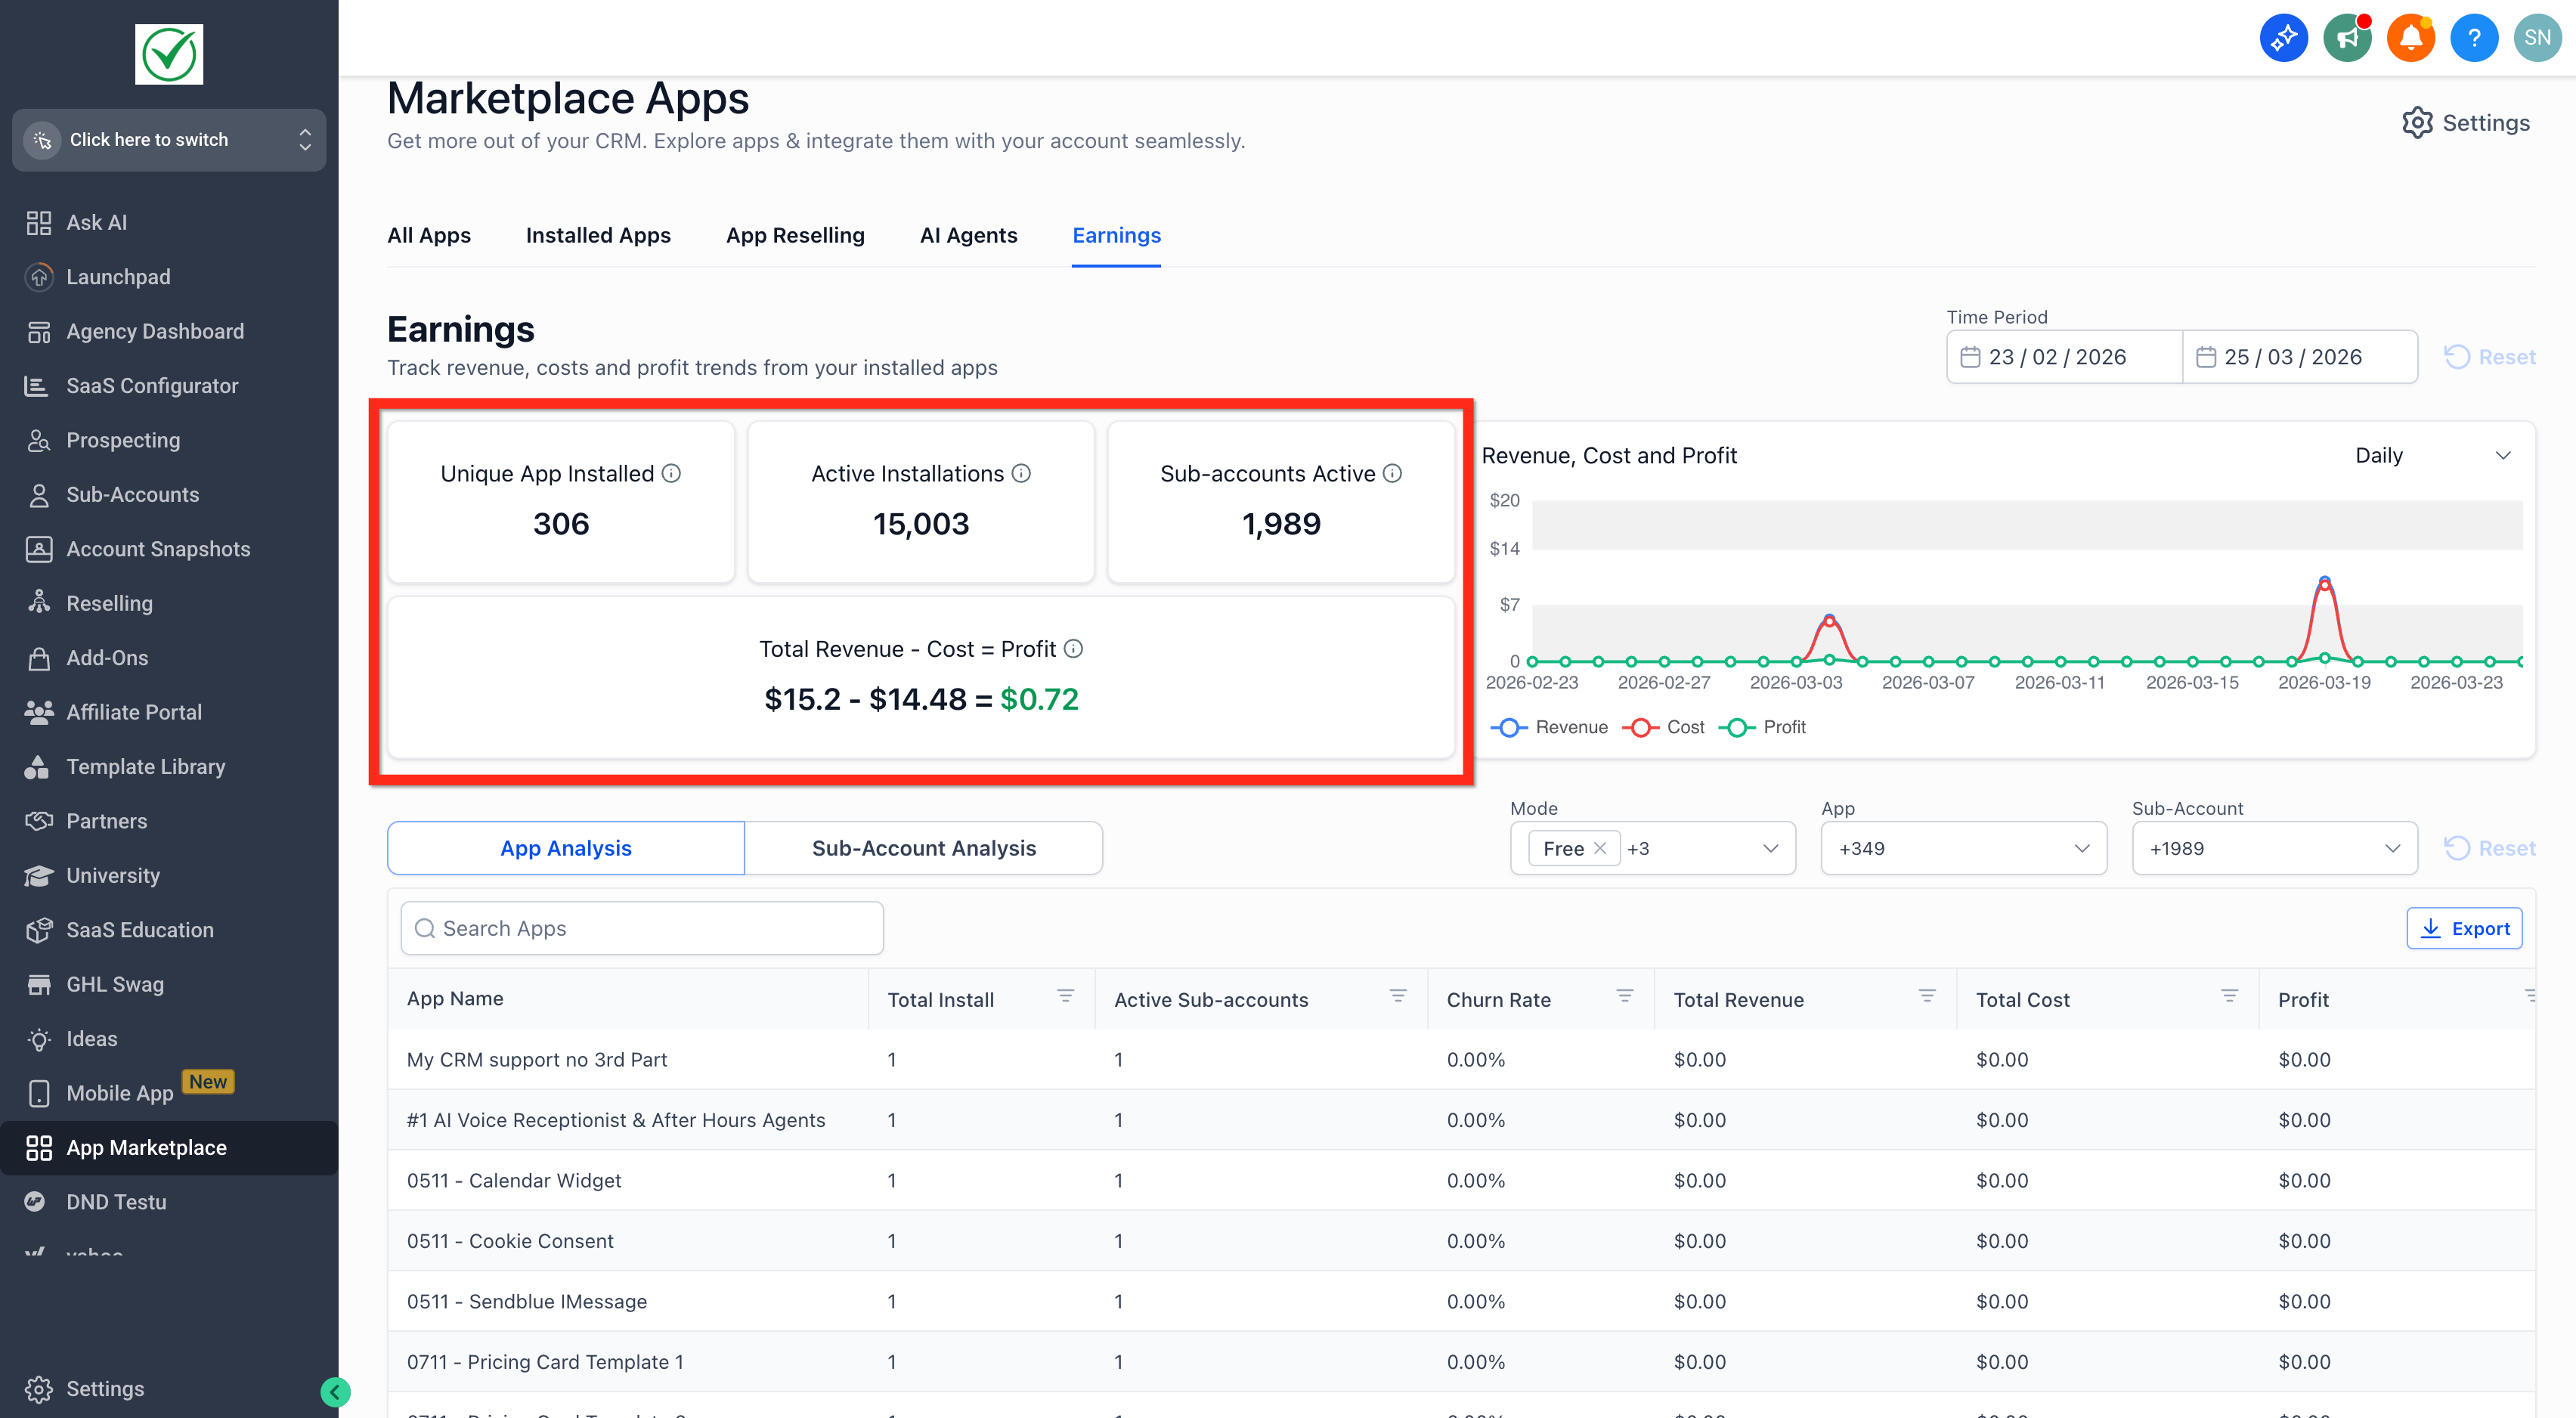
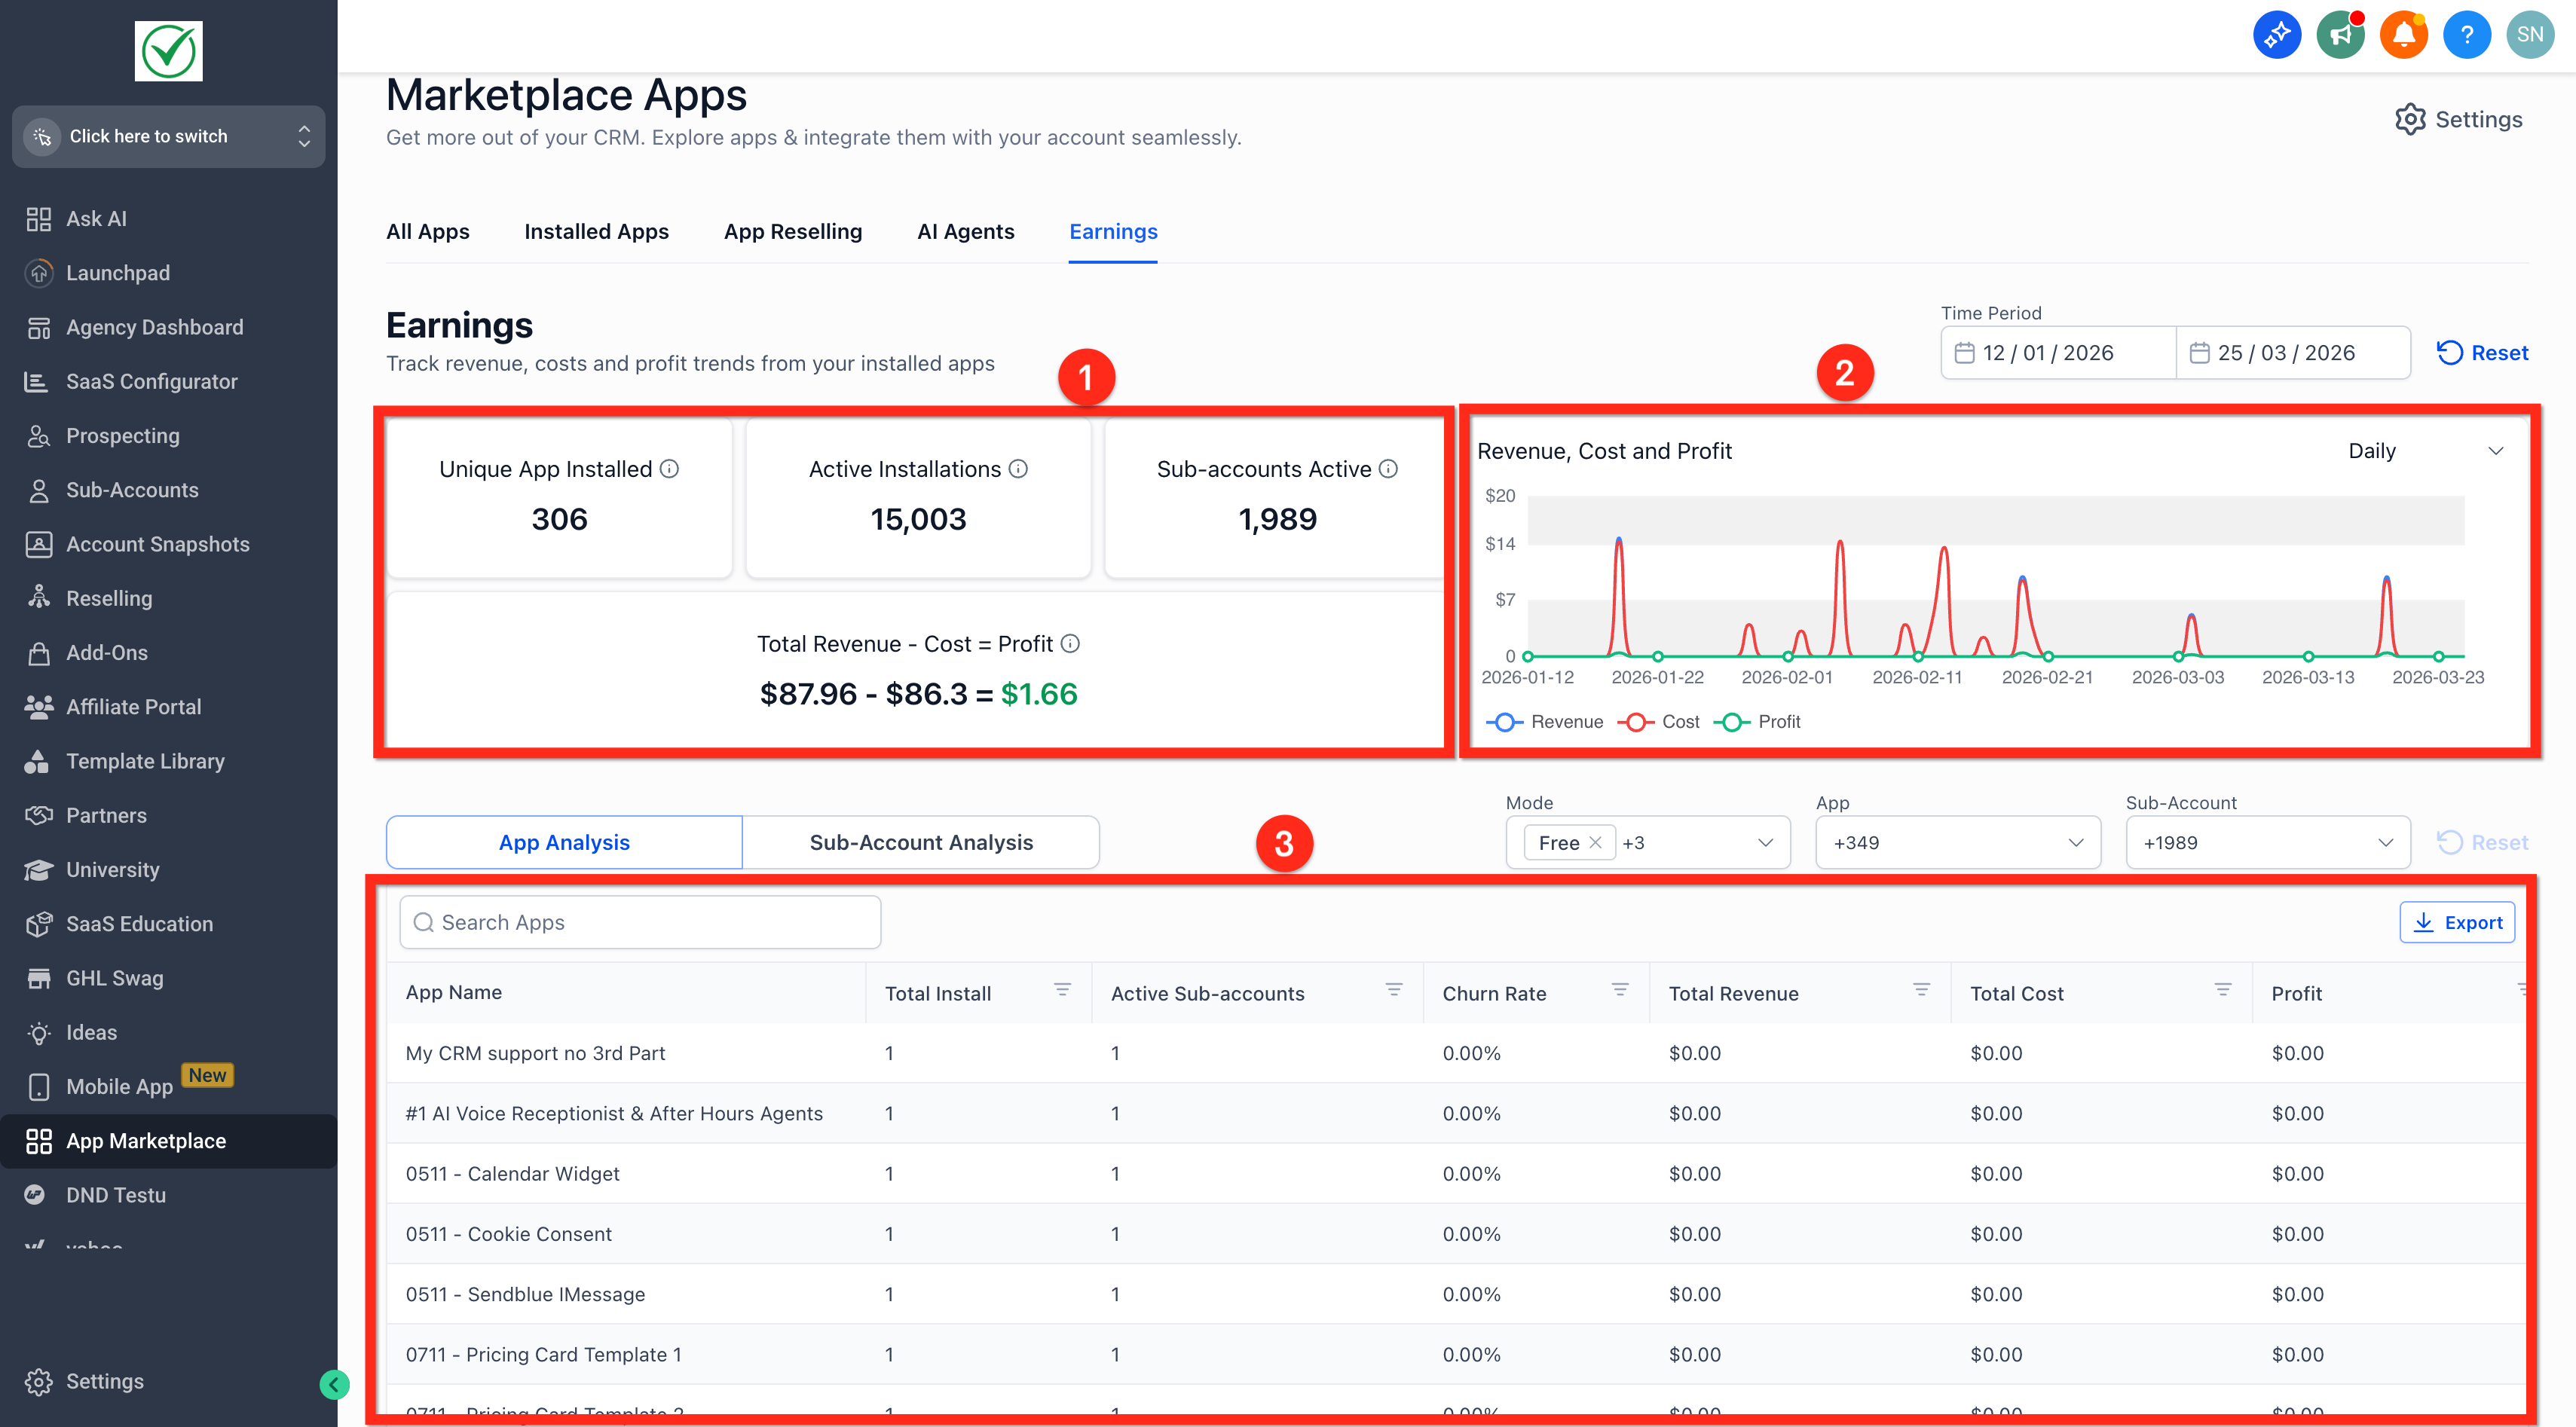
The Earnings Dashboard lives inside an agency account under the App Marketplace > Earnings tab. It pulls together installation counts, revenue generated, app related costs and the resulting profit. The top area displays four summary cards that give a snapshot of unique apps installed, active installations, subaccounts with apps and net profit for the selected period.
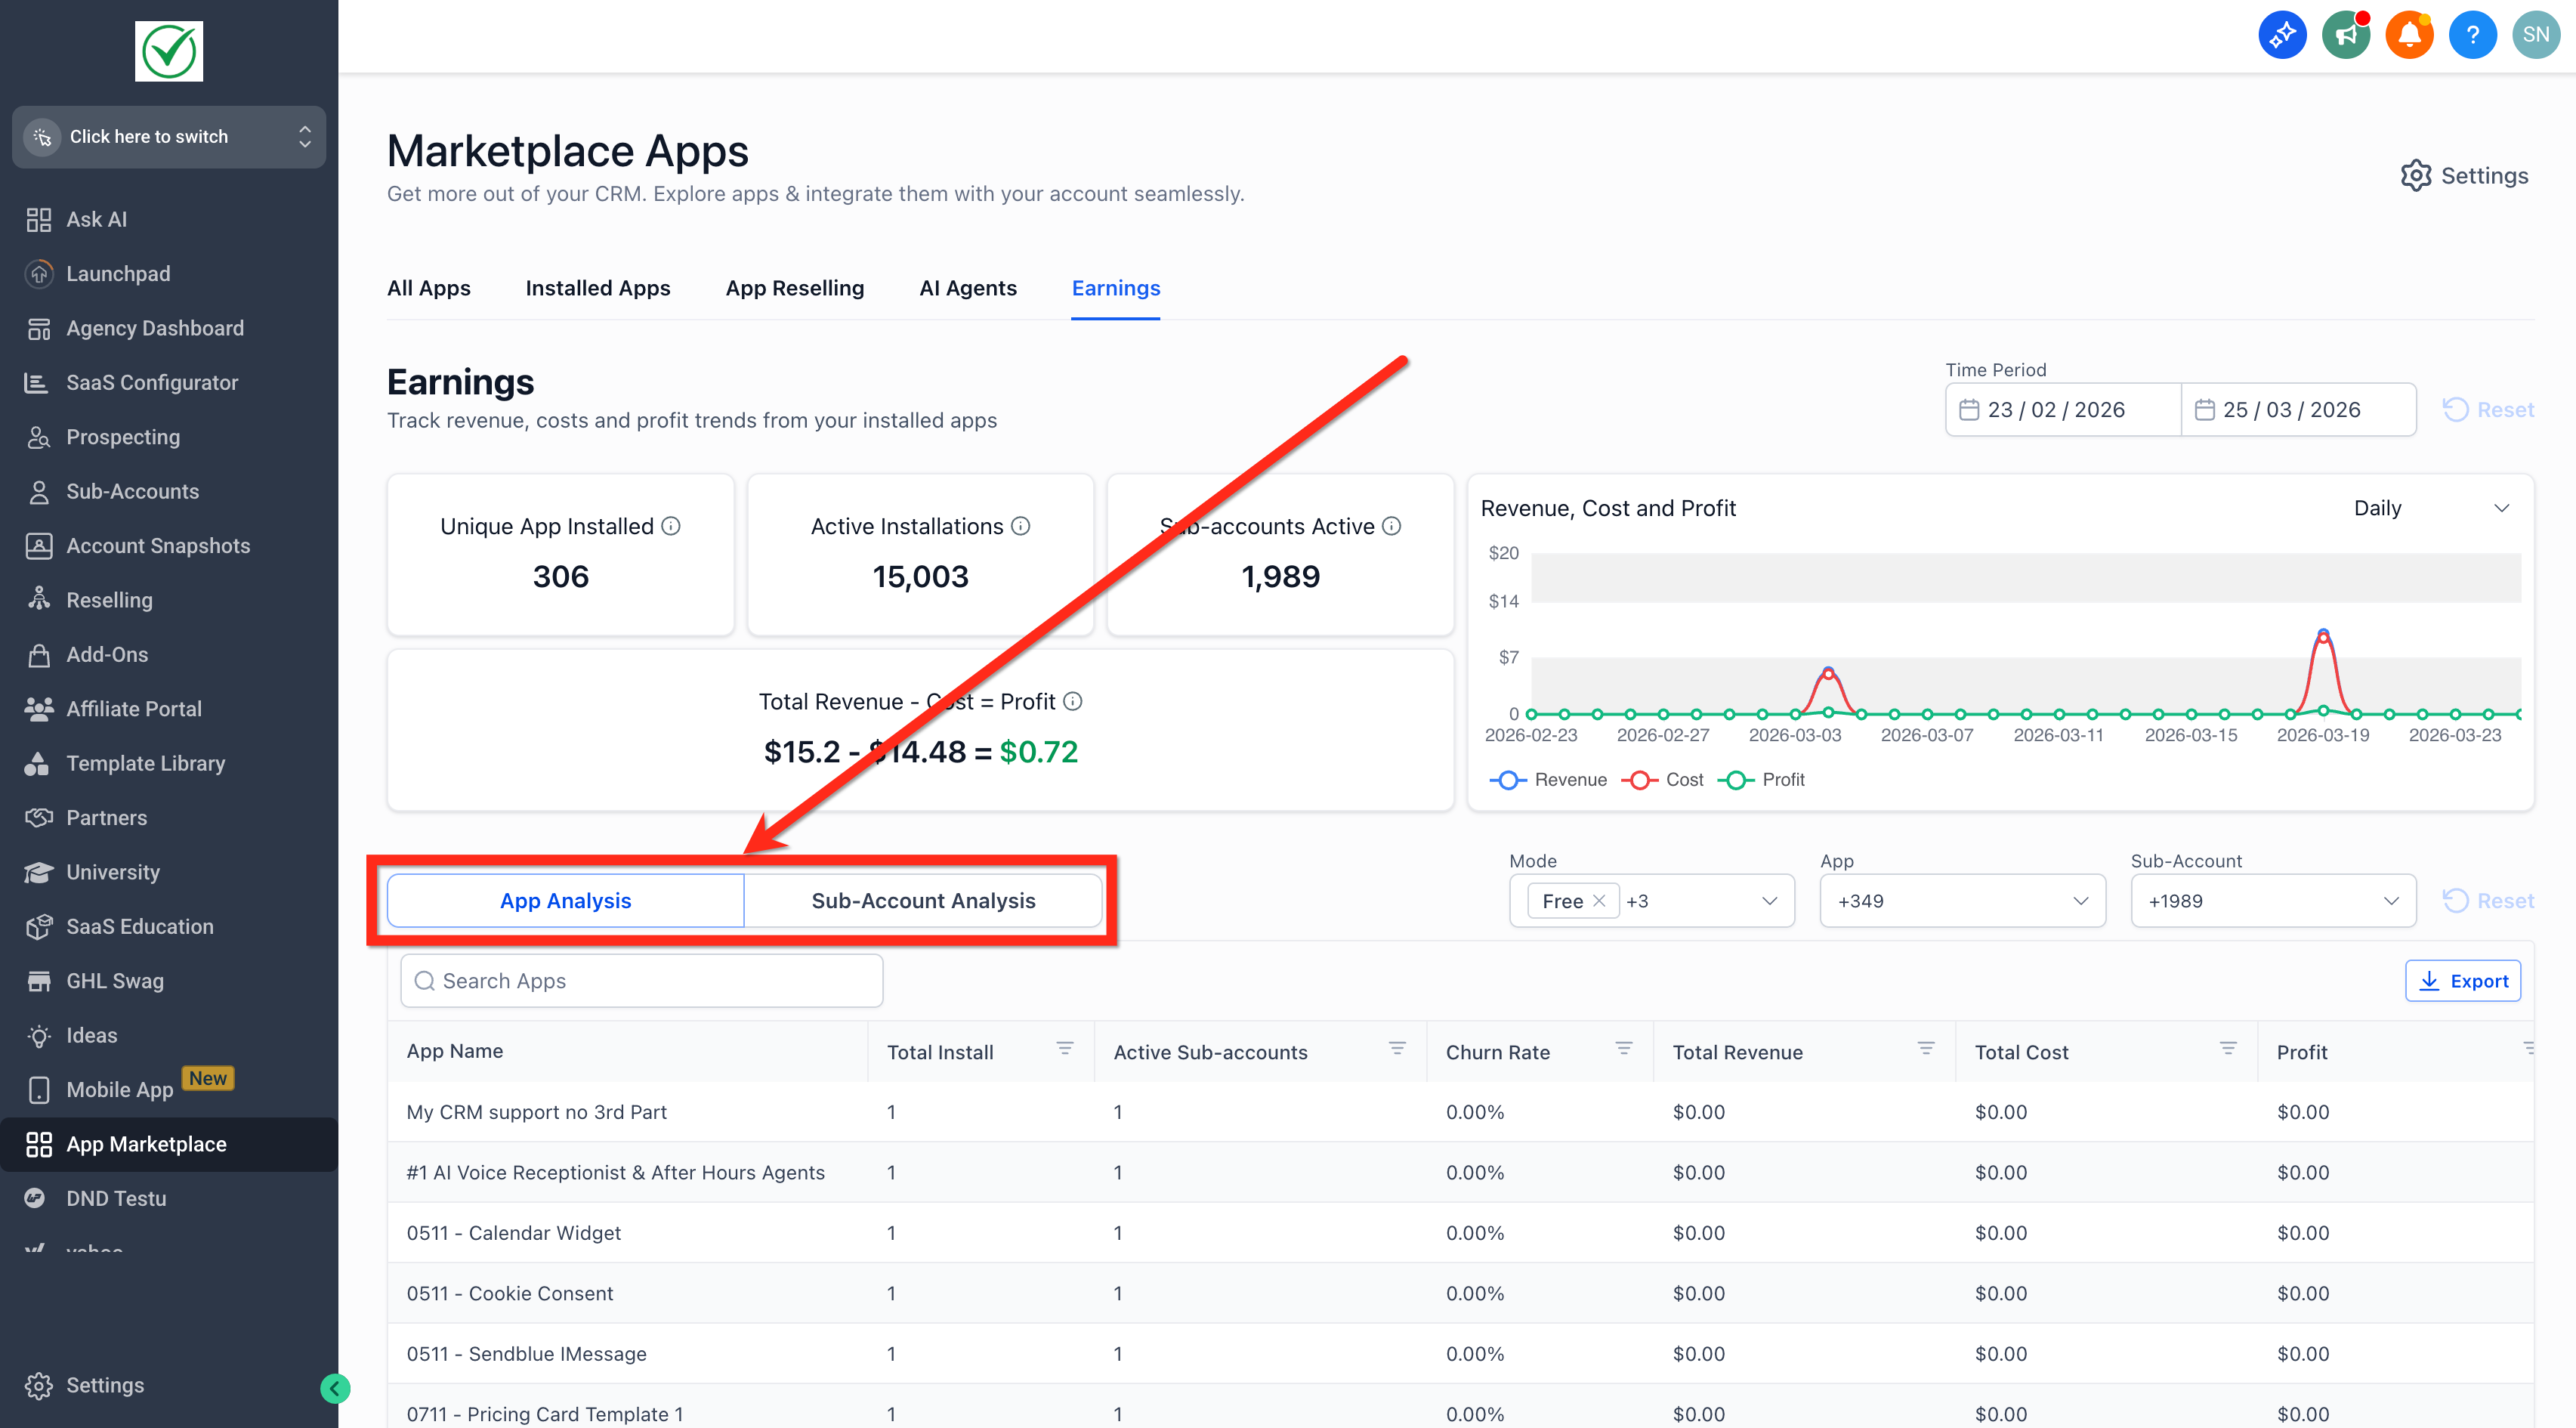
Below the cards a line chart plots revenue, cost and profit over the chosen time frame. The chart and the table update automatically when filters change. Two analysis tabs let you switch between App Analysis, which shows metrics per app, and Subaccount Analysis, which shows the same metrics per client subaccount. An Export button lets you download the filtered view as a file.
03How businesses use marketplace earnings dashboard
- Digital marketing agency. The agency opens the Earnings Dashboard, selects the last month as the time period, and filters by the subscription mode to see which subscription based apps generate the most profit. They then export the table to share with the finance team.
- Agency reseller. The reseller selects specific subaccounts in the filter to compare how each client is using marketplace apps, reviewing the revenue and cost columns to understand each client’s margin.
- Coaching firm. The firm toggles to App Analysis, picks a free app from the App filter and checks the churn rate column to see how many of its clients stop using the app after initial installation.
04The numbers and rules that matter
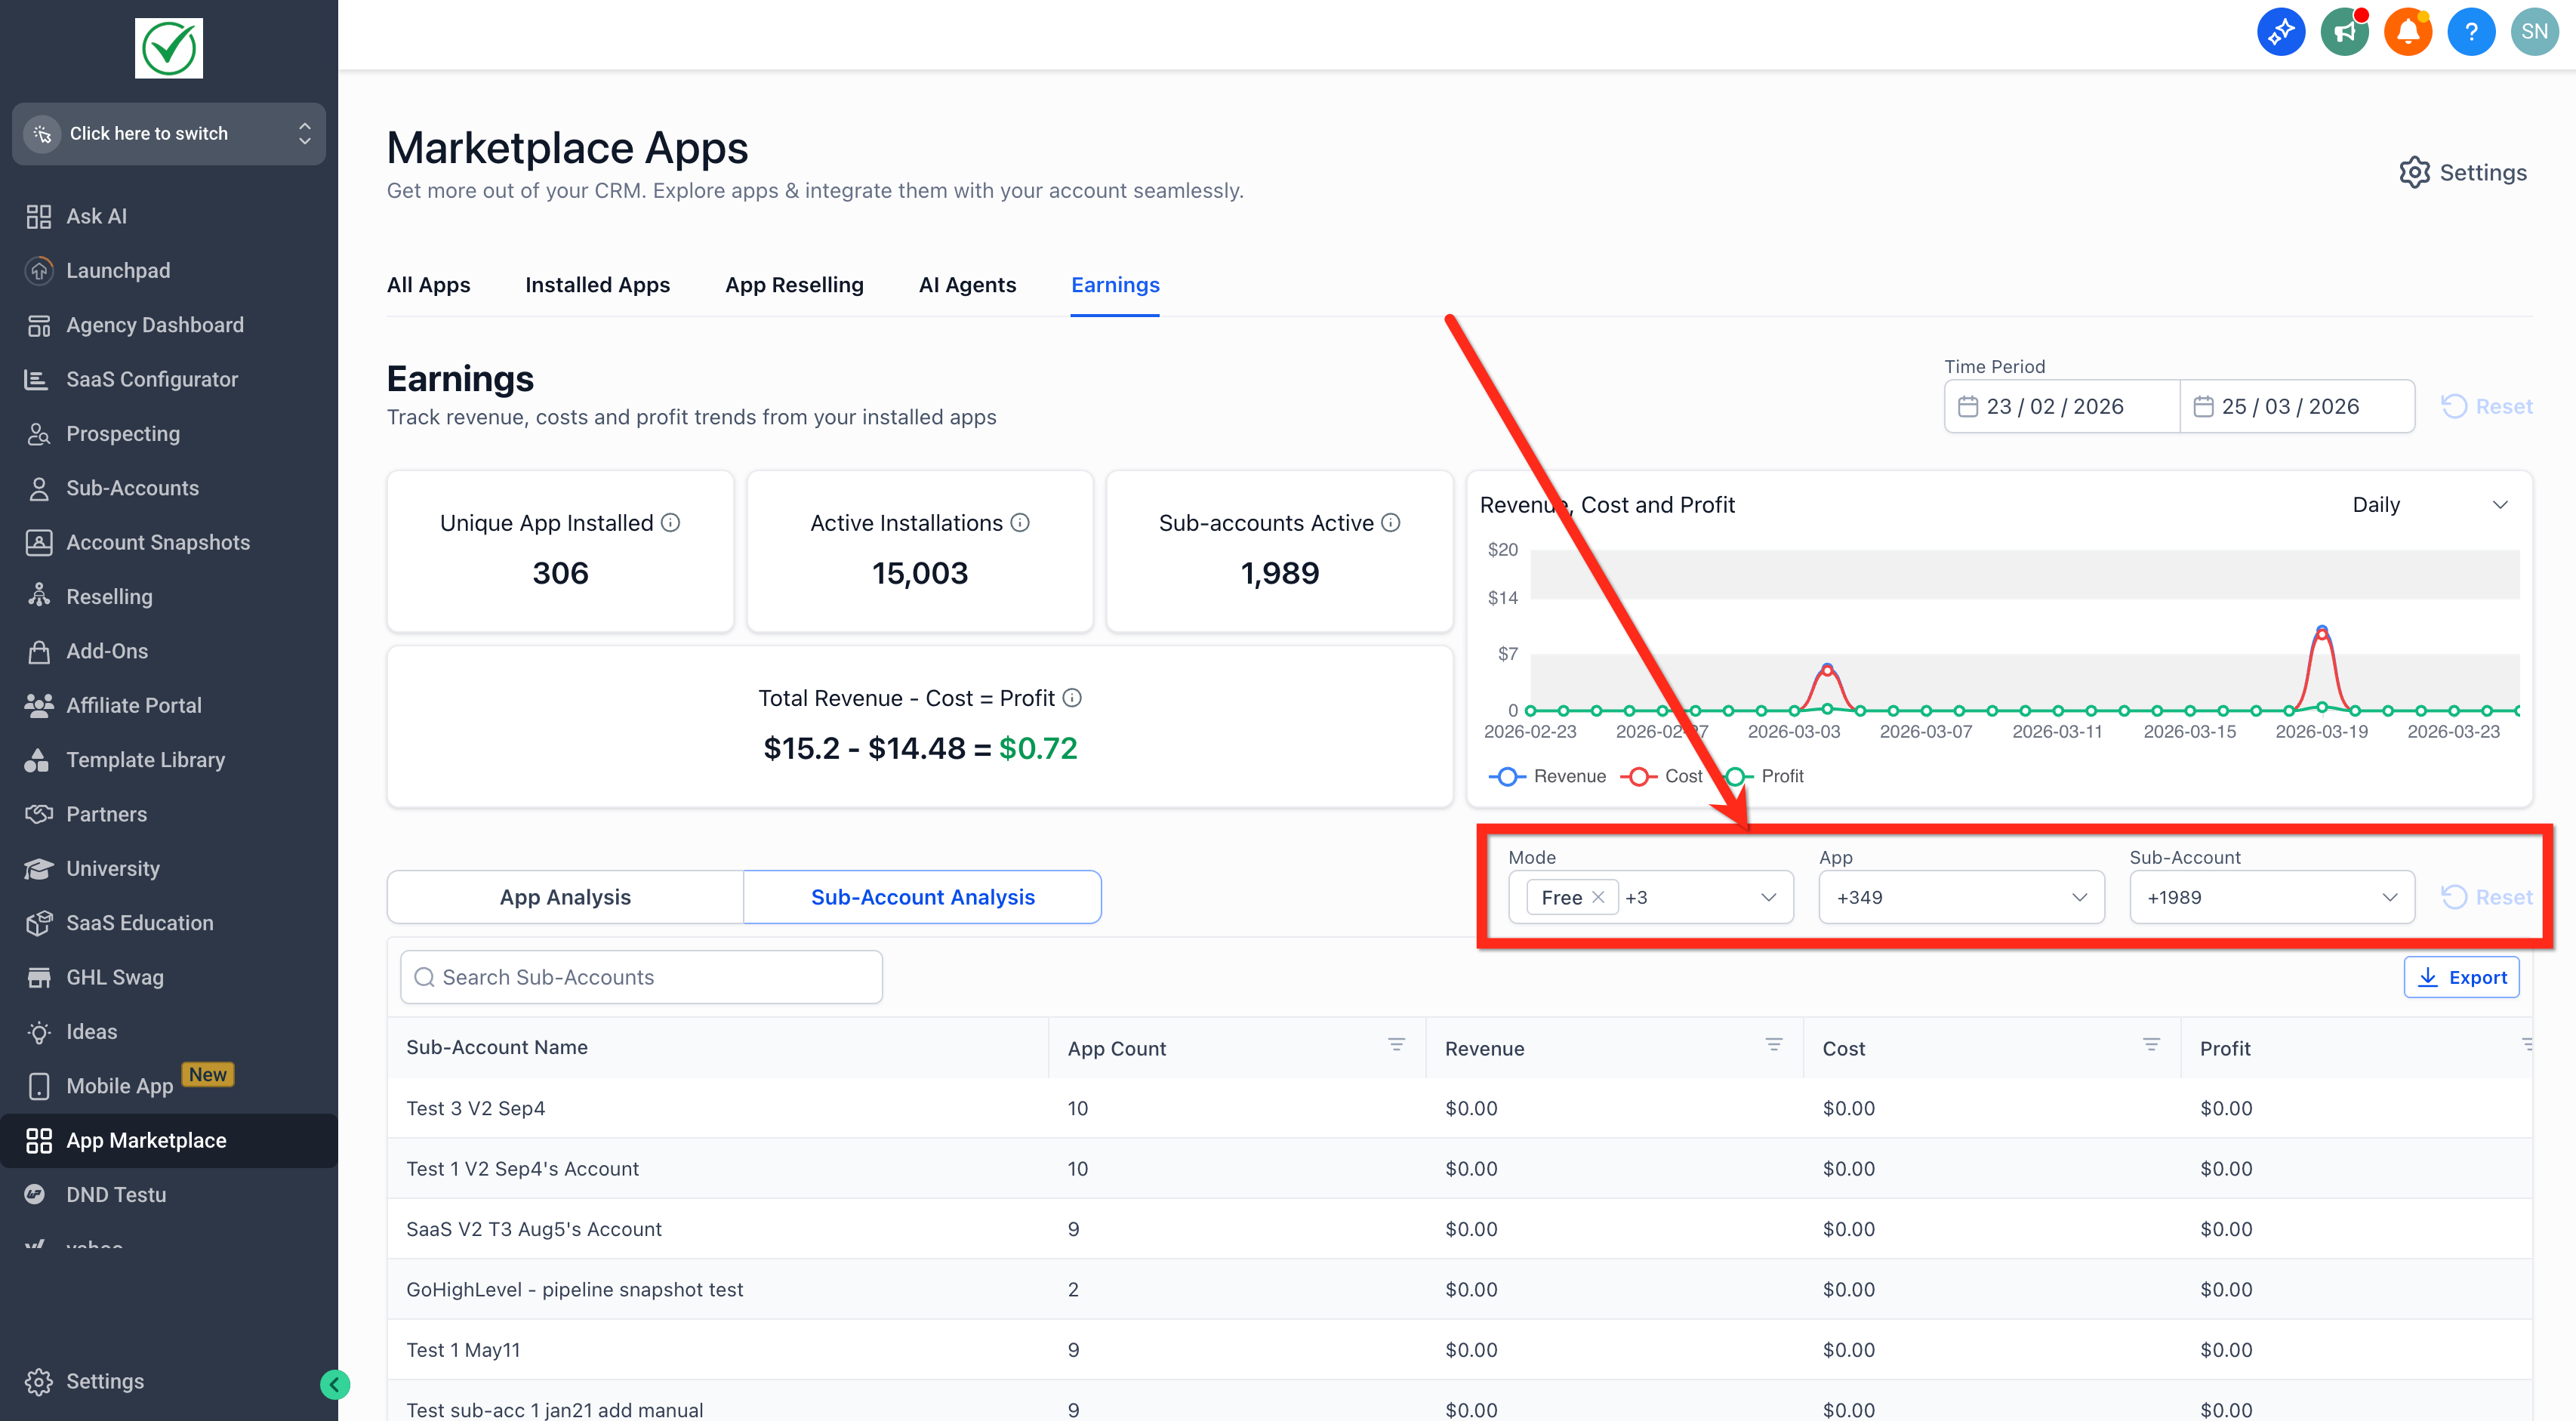
- Filters supported: Time Period, Mode (Free, Usage based, One time & Subscription), App, Subaccount, Search, Reset.
05How to set up and use marketplace earnings dashboard in HighLevel
Navigate the Marketplace Earnings Dashboard
- Log in to the HighLevel agency account.
- Go to the App Marketplace section.
- Click the Earnings tab.
- View the summary cards showing unique apps installed, active installations, subaccounts active and profit.
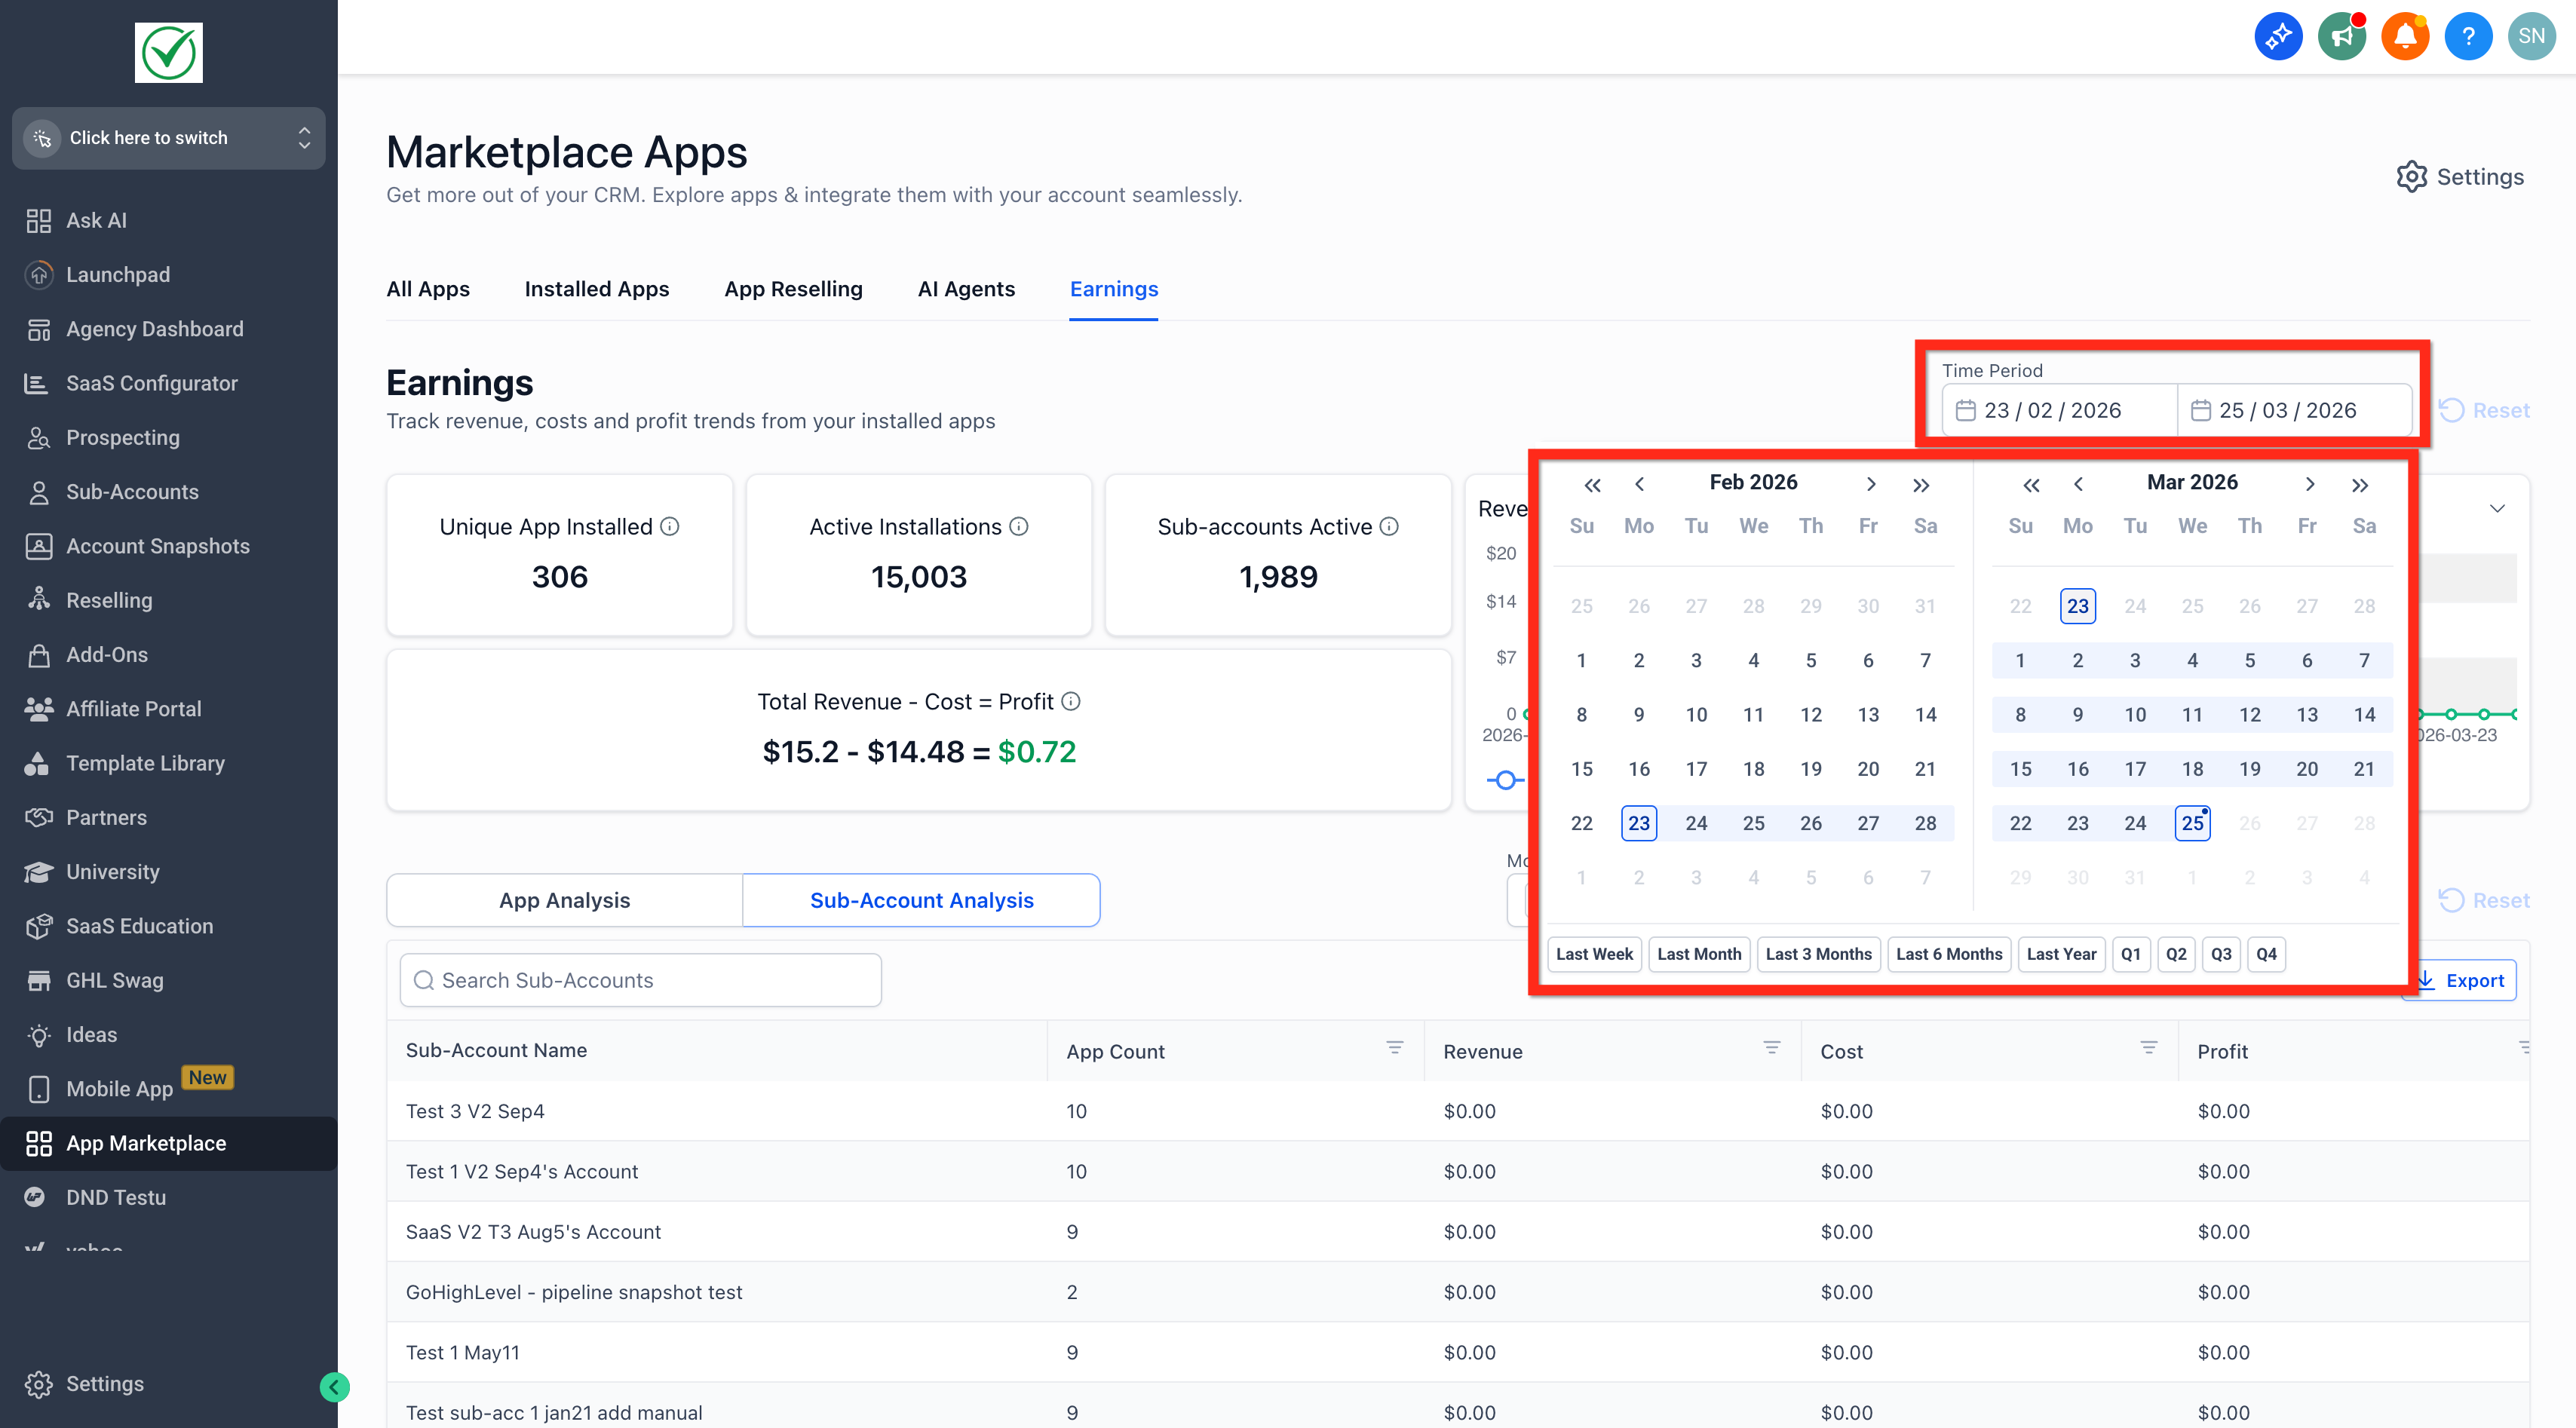
- Select a time period using the date selector; note that the unique app and active installation numbers do not depend on the selected time period.
- Apply filters such as Mode, App and Subaccount to narrow the data.
- Toggle between the App Analysis and Subaccount Analysis tabs as needed.
- Examine the summary cards, trend chart and table that reflect the applied filters.
- Click Export to download the current report.
06What it looks like in HighLevel
07How it connects to the rest of HighLevel
- Explore all features available in the App Marketplace. All App marketplace features
- Review pricing options for agency plans and marketplace app usage. HighLevel pricing and plans
- Start a trial to test the Earnings Dashboard in a new agency account. Start a 30 day HighLevel trial
Michael's take

Keeping tabs on which marketplace apps actually bring in money can be a headache for an agency that’s juggling dozens of client accounts. The first thing I would get right is the Time Period filter so the revenue, cost and profit numbers line up with the reporting window I care about.
From there I’d jump straight into the Subaccount Analysis view. Seeing which clients are moving the needle lets you focus your upsell conversations and support resources where they matter most.