
01Who this is for
- Agency administrators need a single view of AI consumption to manage costs and allocations.
- Marketing agencies can monitor each client’s subaccount AI usage to ensure billing accuracy.
02AI usage dashboard, explained
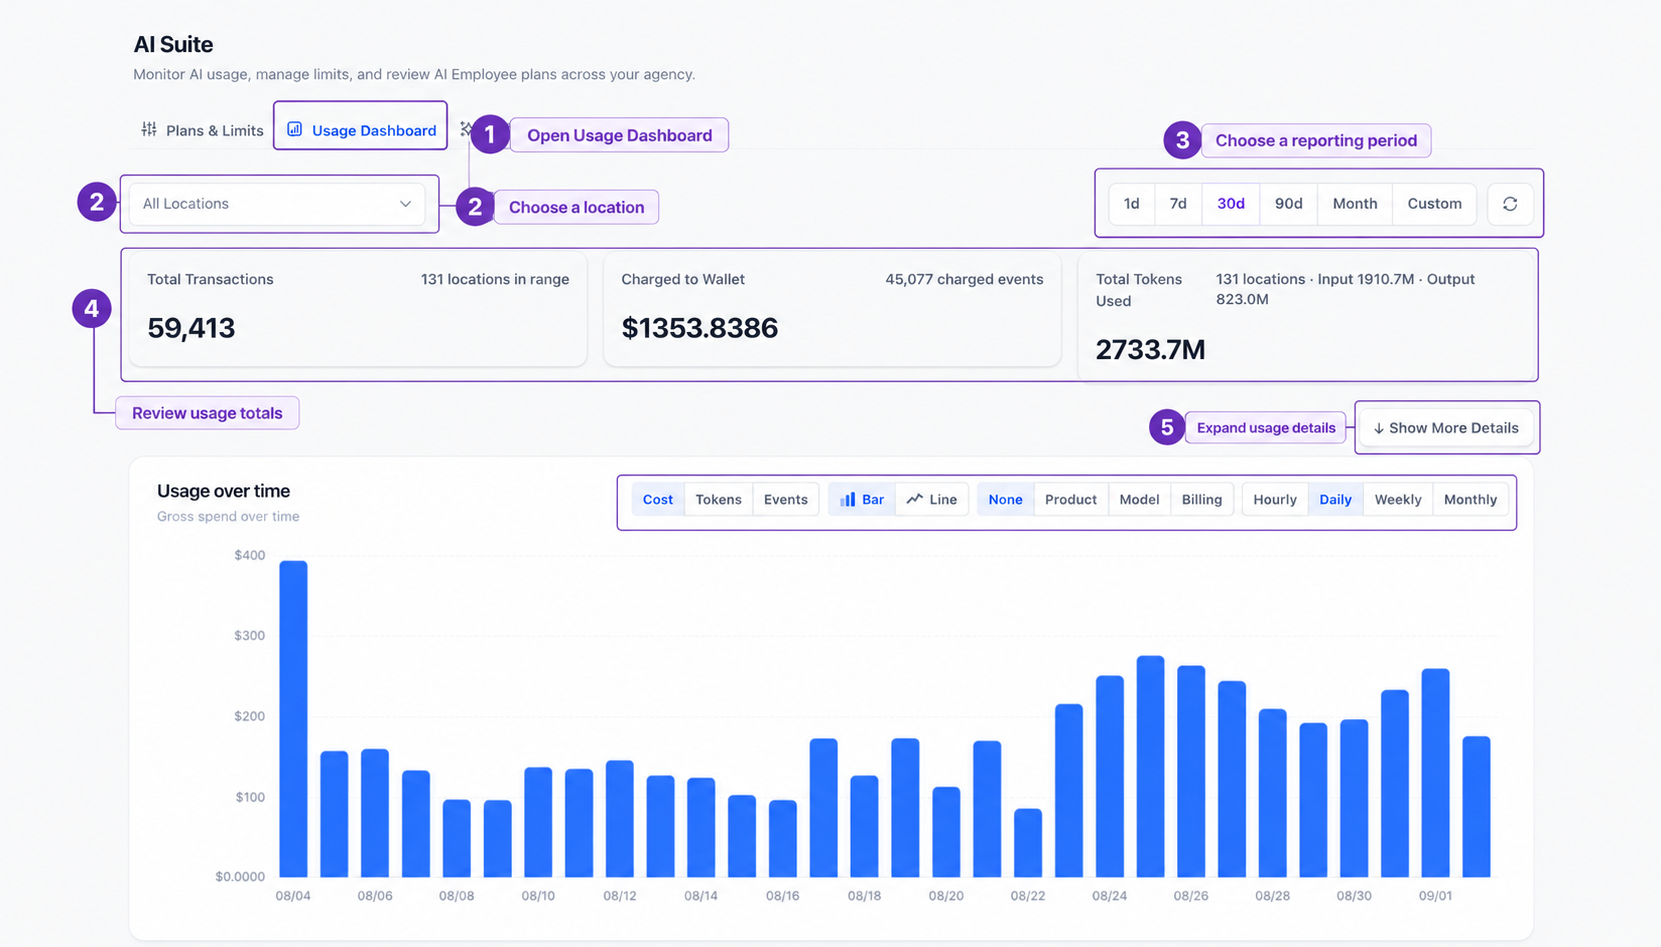
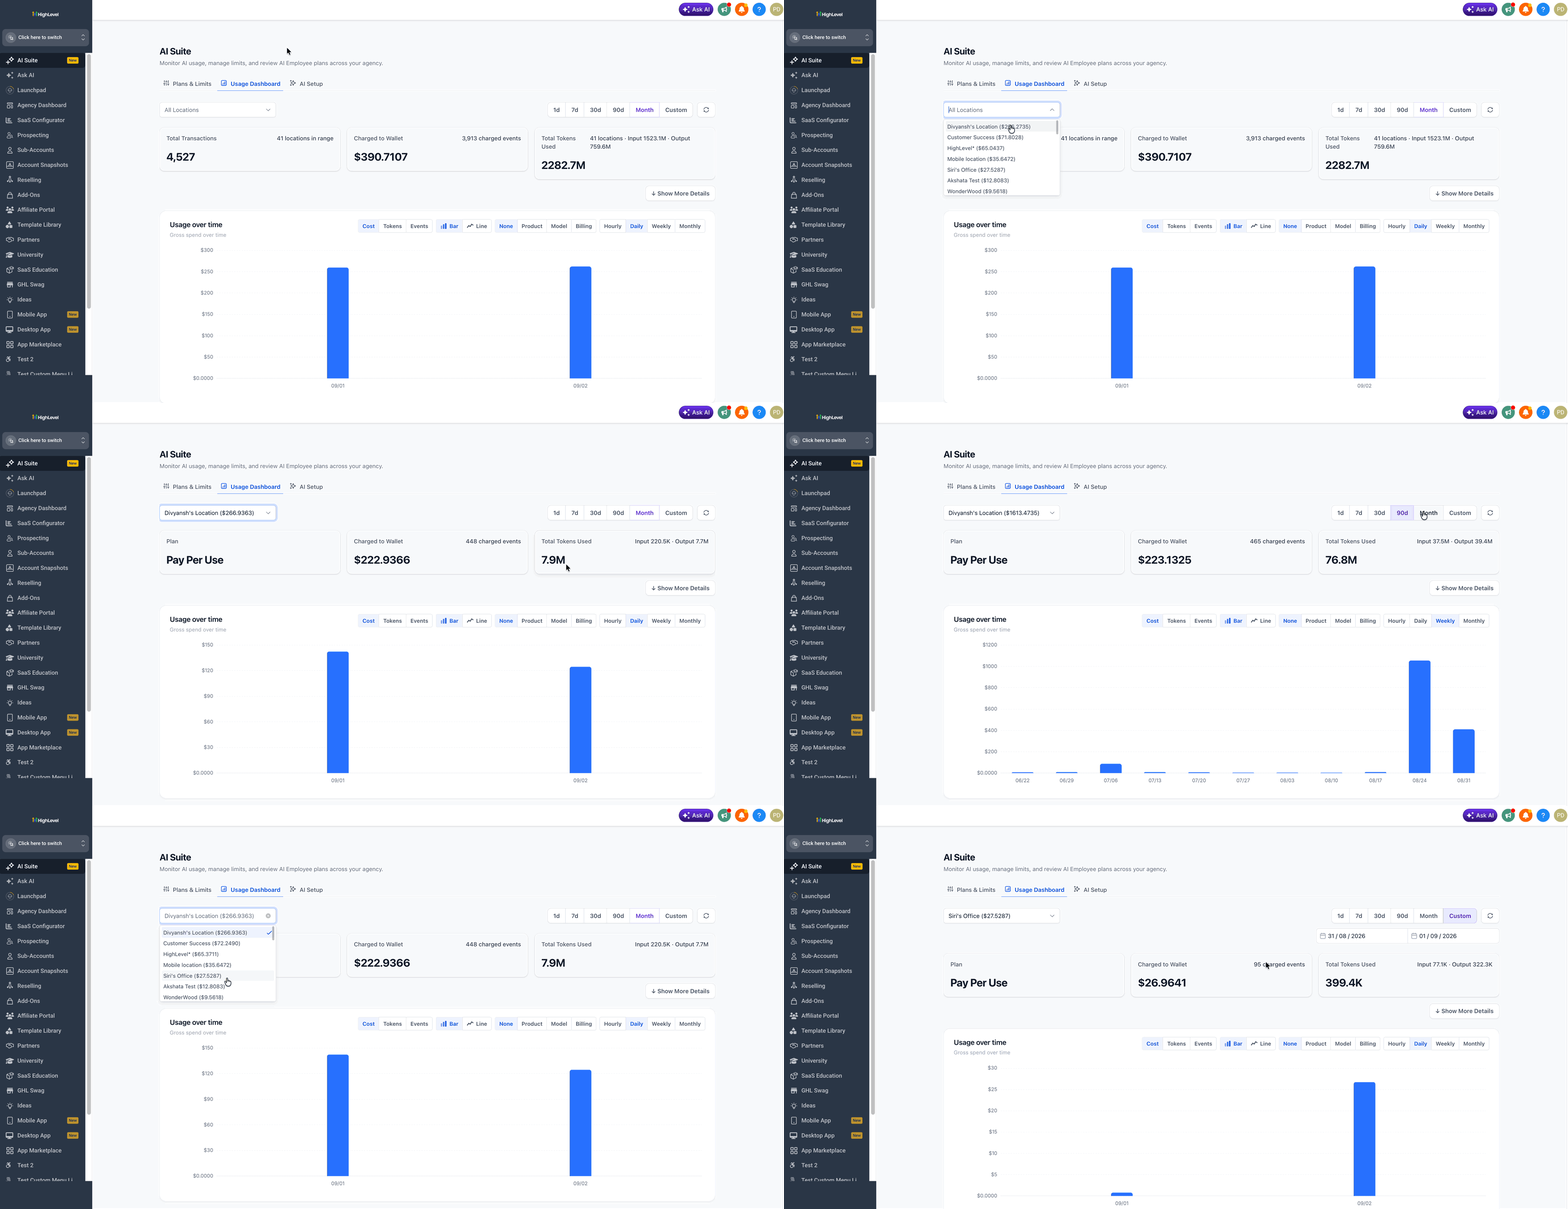
The dashboard lives in the AI Suite section of the platform. From Agency View, select AI Suite and then the Usage Dashboard tab. The screen displays summary cards, a usage over time chart, expanded billing details and a table of individual transactions. Filters at the top let you pick a specific subaccount or an agency wide view and set the reporting period.
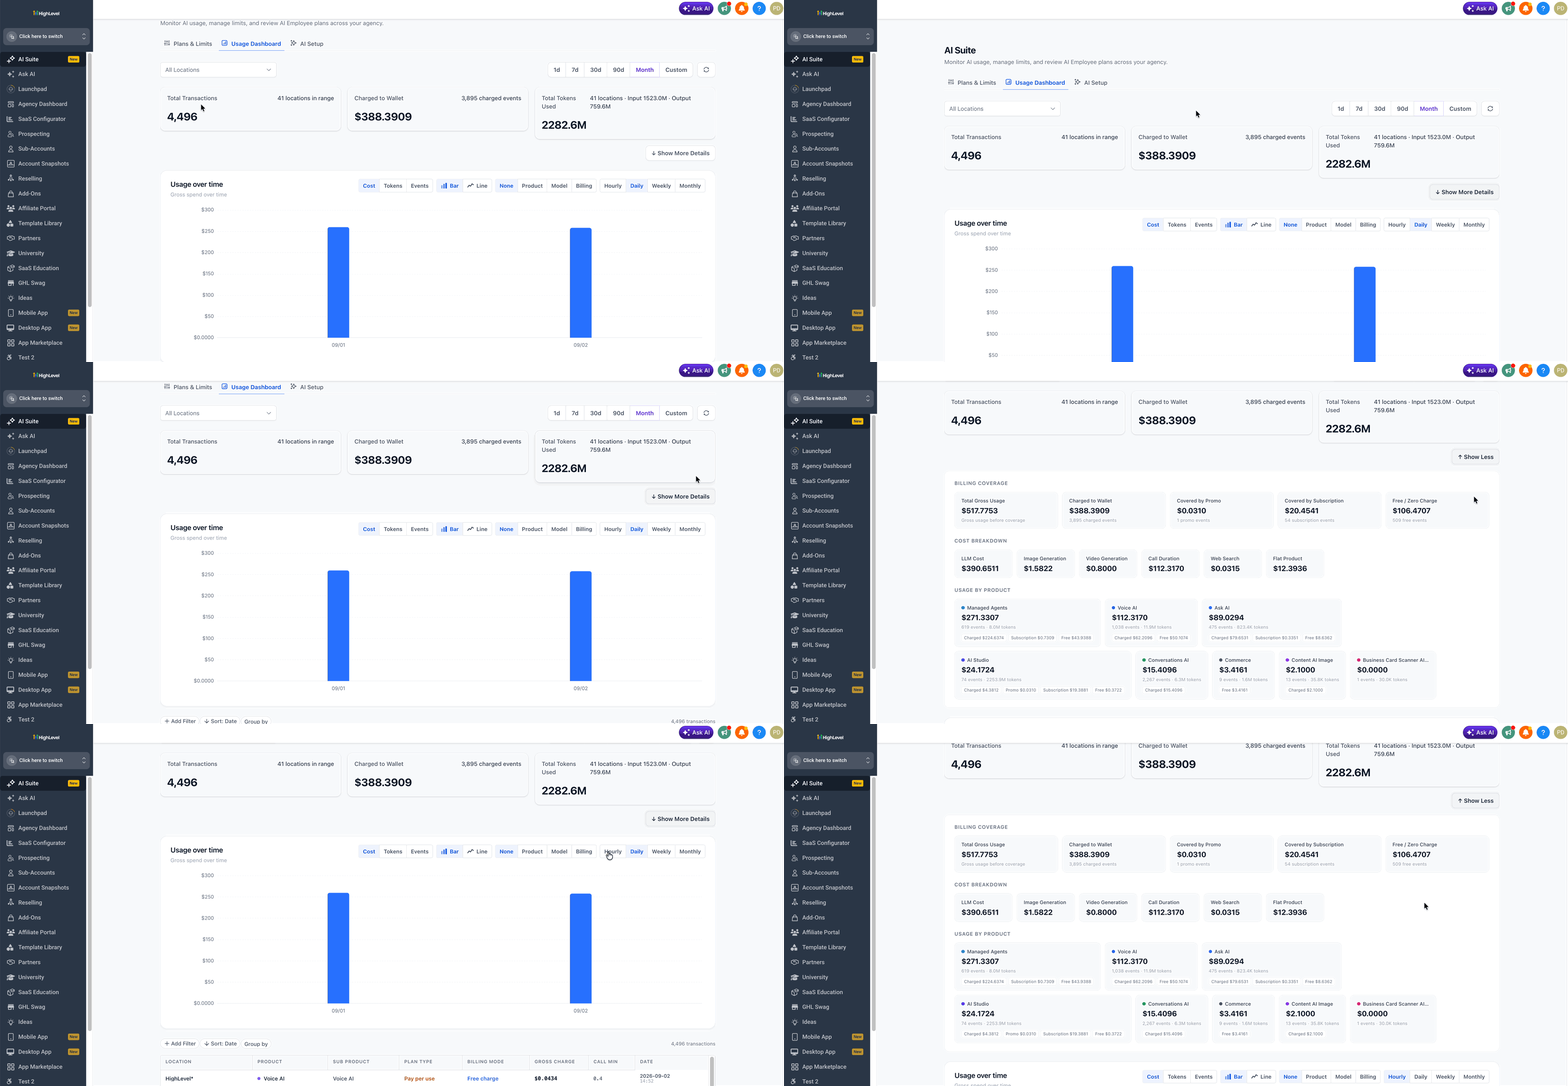
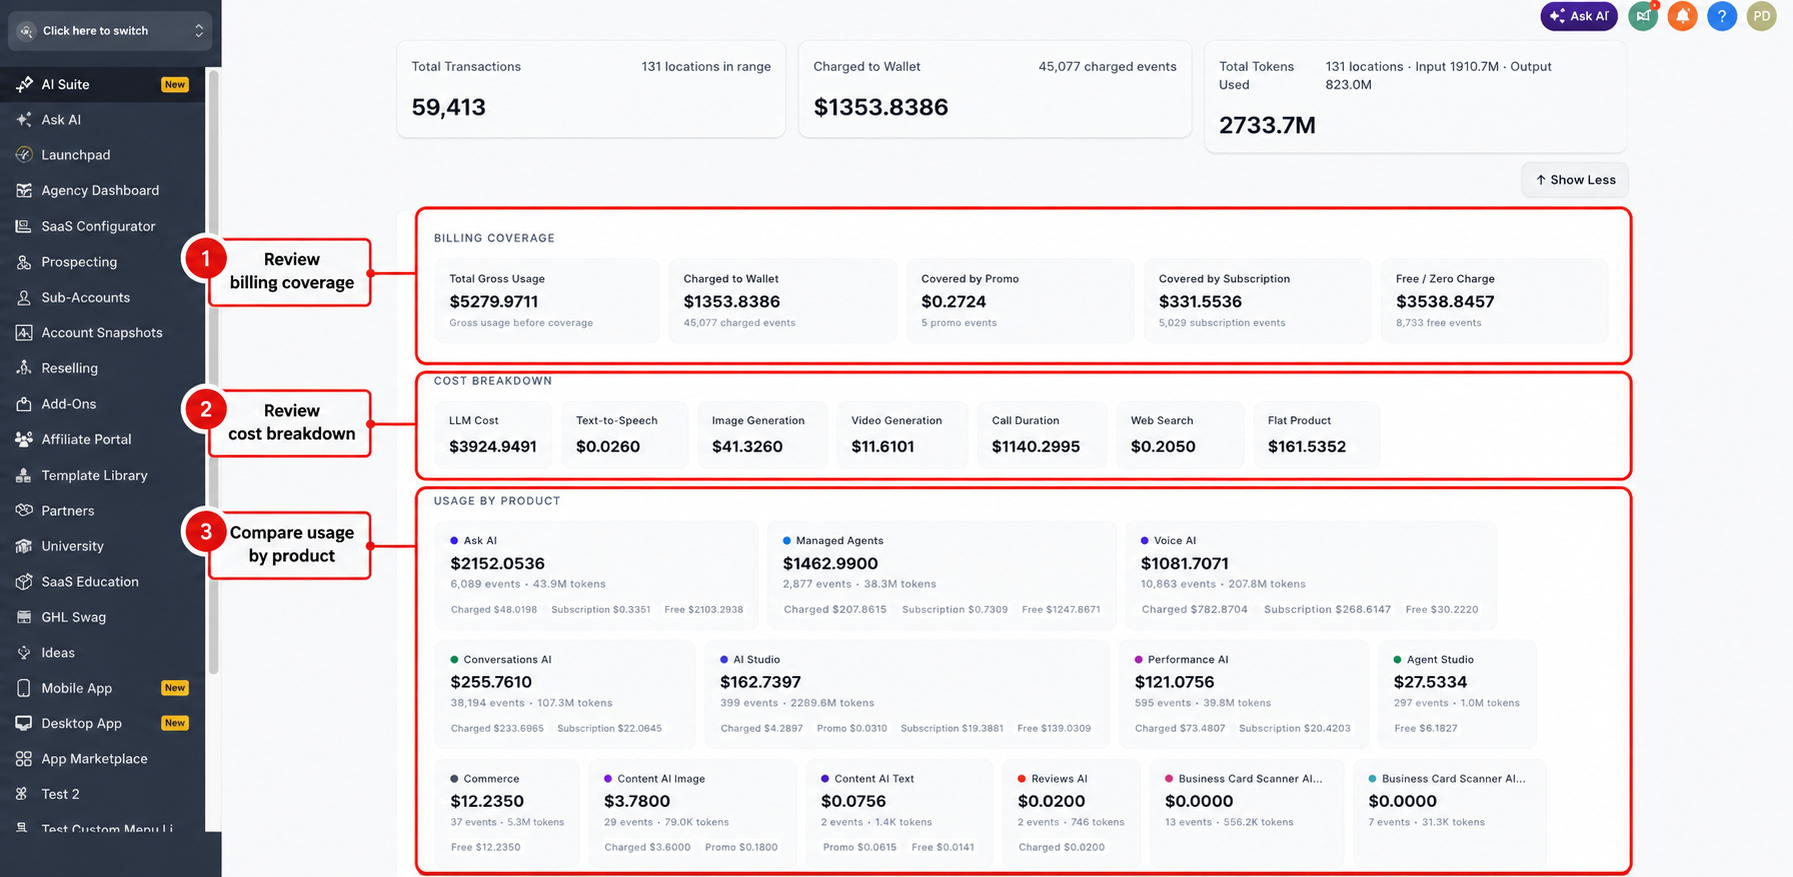
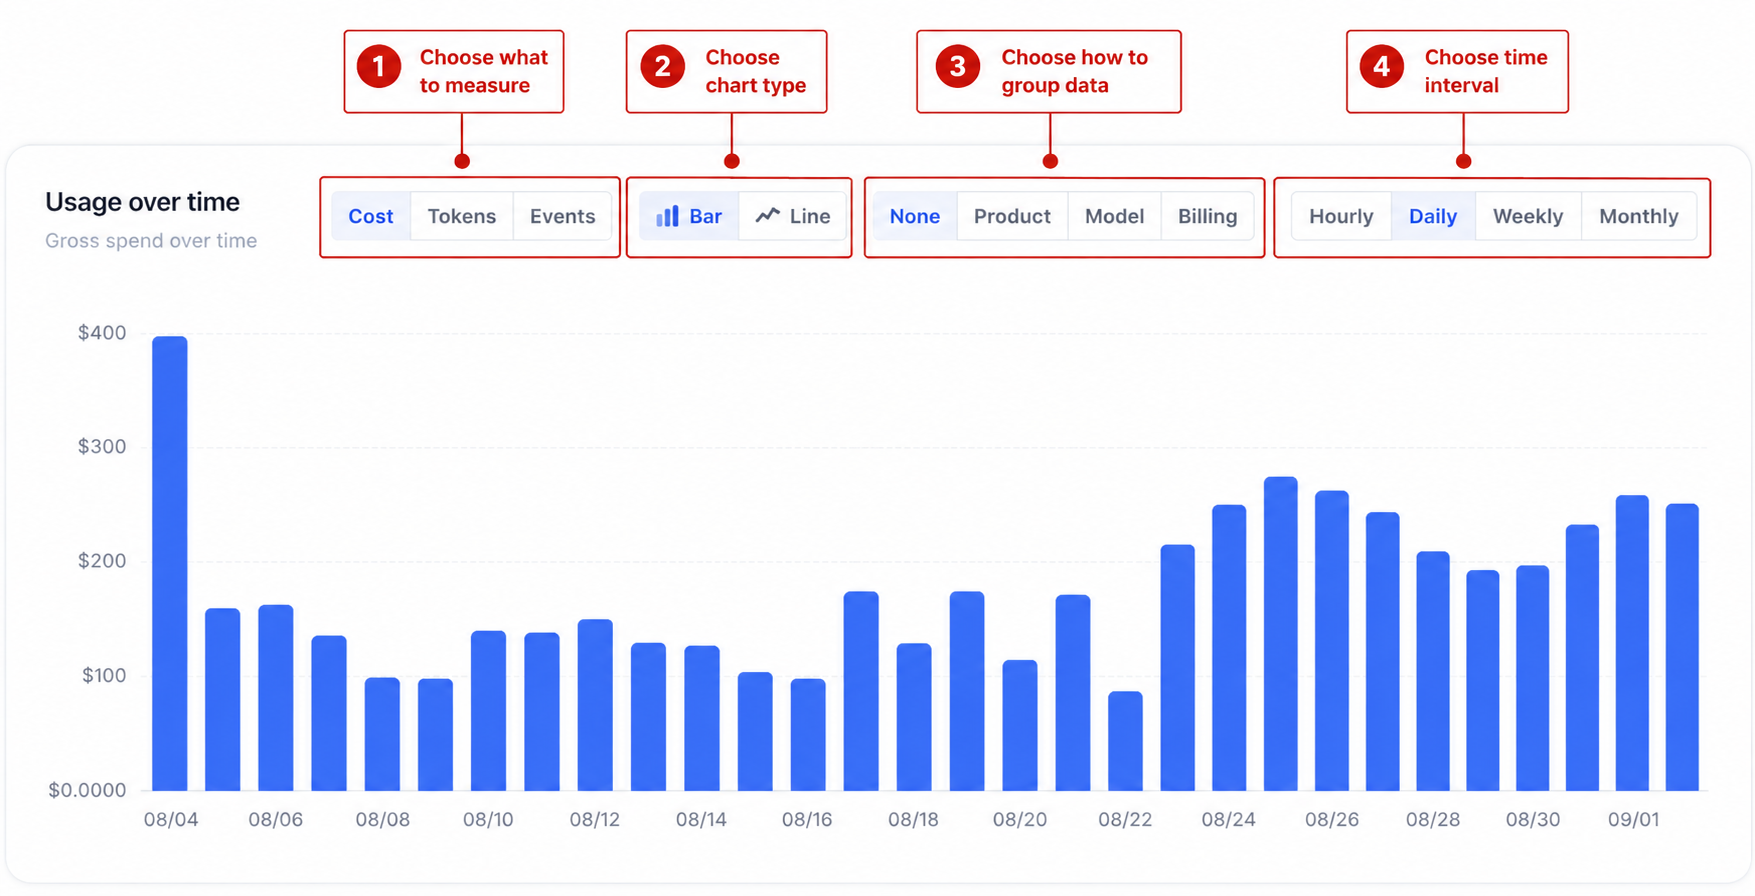
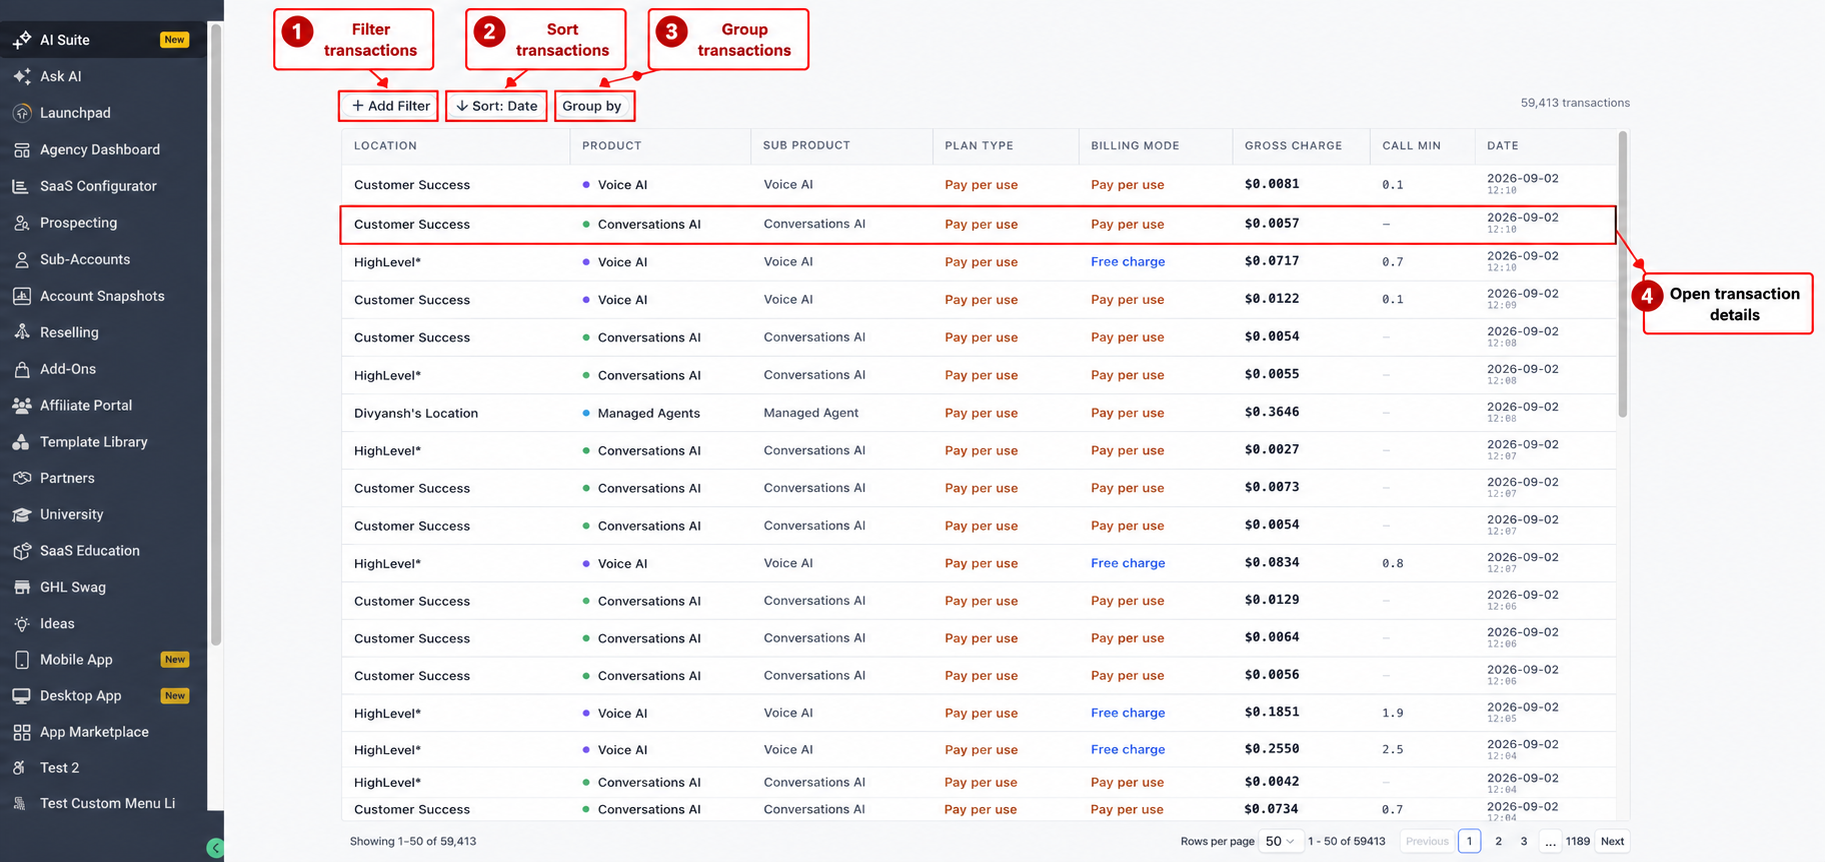
Data updates automatically when you change the location or date range. Summary cards give quick totals for transactions, wallet charges and tokens. By expanding the view you can see how usage is covered by promotions, subscriptions or free tiers, and break down costs by product type. The chart can be configured by metric, chart type, grouping and time interval, while the table lists each AI event with sortable and filterable columns. Clicking a row opens a detailed pane with granular information such as model, tokens, call duration and billing identifiers.
03How businesses use the AI usage dashboard
- Marketing agency. The agency reviews the dashboard to see which AI products each client subaccount is using. By filtering to a client’s subaccount, the admin checks token consumption and wallet charges, then narrows down any unexpected transactions.
- SaaS startup. The startup’s admin selects the agency wide view to monitor overall AI costs across development, support and content generation. The usage over time chart helps spot spikes, and the cost breakdown shows which services, like language models or image generation, are driving spend.
- Real estate brokerage. The brokerage’s admin filters the dashboard to a single office location to track AI usage for property description generation. The transaction table is used to verify that each AI call aligns with the office’s budget and promotion coverage.
04The numbers and rules that matter
- Reporting period options: 1d, 7d, 30d, 90d, Month, Custom.
- Expanded view includes Billing Coverage, Cost Breakdown, Usage by Product.
- Supported AI products include Ask AI, Managed Agents, Voice AI, Conversations AI, AI Studio, Performance AI, Agent Studio, Commerce, Content AI Image, Content AI Text, Reviews AI, Business Card Scanner AI.
05Before you start
- You must be logged in as an Agency Admin with access to Agency View.
06How to set up and use the AI usage dashboard in HighLevel
View AI usage dashboard
- Open Agency View.
- Navigate to AI Suite.
- Select the Usage Dashboard tab.
- Choose All Locations or pick a specific subaccount.
- Pick a reporting period such as 1d, 7d, 30d, 90d, Month or Custom.
- If Custom, set the start and end dates.
- Allow the dashboard to refresh with the selected data.
- Review the Total Transactions, Charged to Wallet and Total Tokens Used cards.
- Click Show More Details to see Billing Coverage, Cost Breakdown and Usage by Product.
- Scroll to the Transactions Table and, if needed, use Add Filter, Sort: Date or Group by to refine the list.
- Select any transaction row to open its detailed record.
07What it looks like in HighLevel
08Things to know before you rely on it
- The dashboard is only available at the Agency level for users with Agency Admin rights.
- Products that have no reportable activity in the chosen location and period will not appear in the Usage by Product section.
09How it connects to the rest of HighLevel
- Configure AI usage limits for the agency. AI Usage Limits
- Check current pricing for each AI product. AI Product Pricing
- Learn how to set up AI Employee access and rebilling. AI Employee Access
Michael's take

Agencies often lose track of how AI services add up, especially when multiple subaccounts are involved. The first thing I would set right is the location filter. Pick the subaccount that matters most so the numbers you see truly reflect that part of the business.
From there I would explore the summary cards and then dive into the Transactions Table. The detail panel shows which product, model and billing mode created each charge, which helps identify usage patterns.