
01Who this is for
- Agency owners who oversee many client subaccounts and need a quick view of prospecting results.
- Founders of marketing firms that want to track report engagement and lead flow across campaigns.
- Consultants delivering prospecting services who must monitor conversion counts for each client.
02Analytics dashboards for prospecting, explained
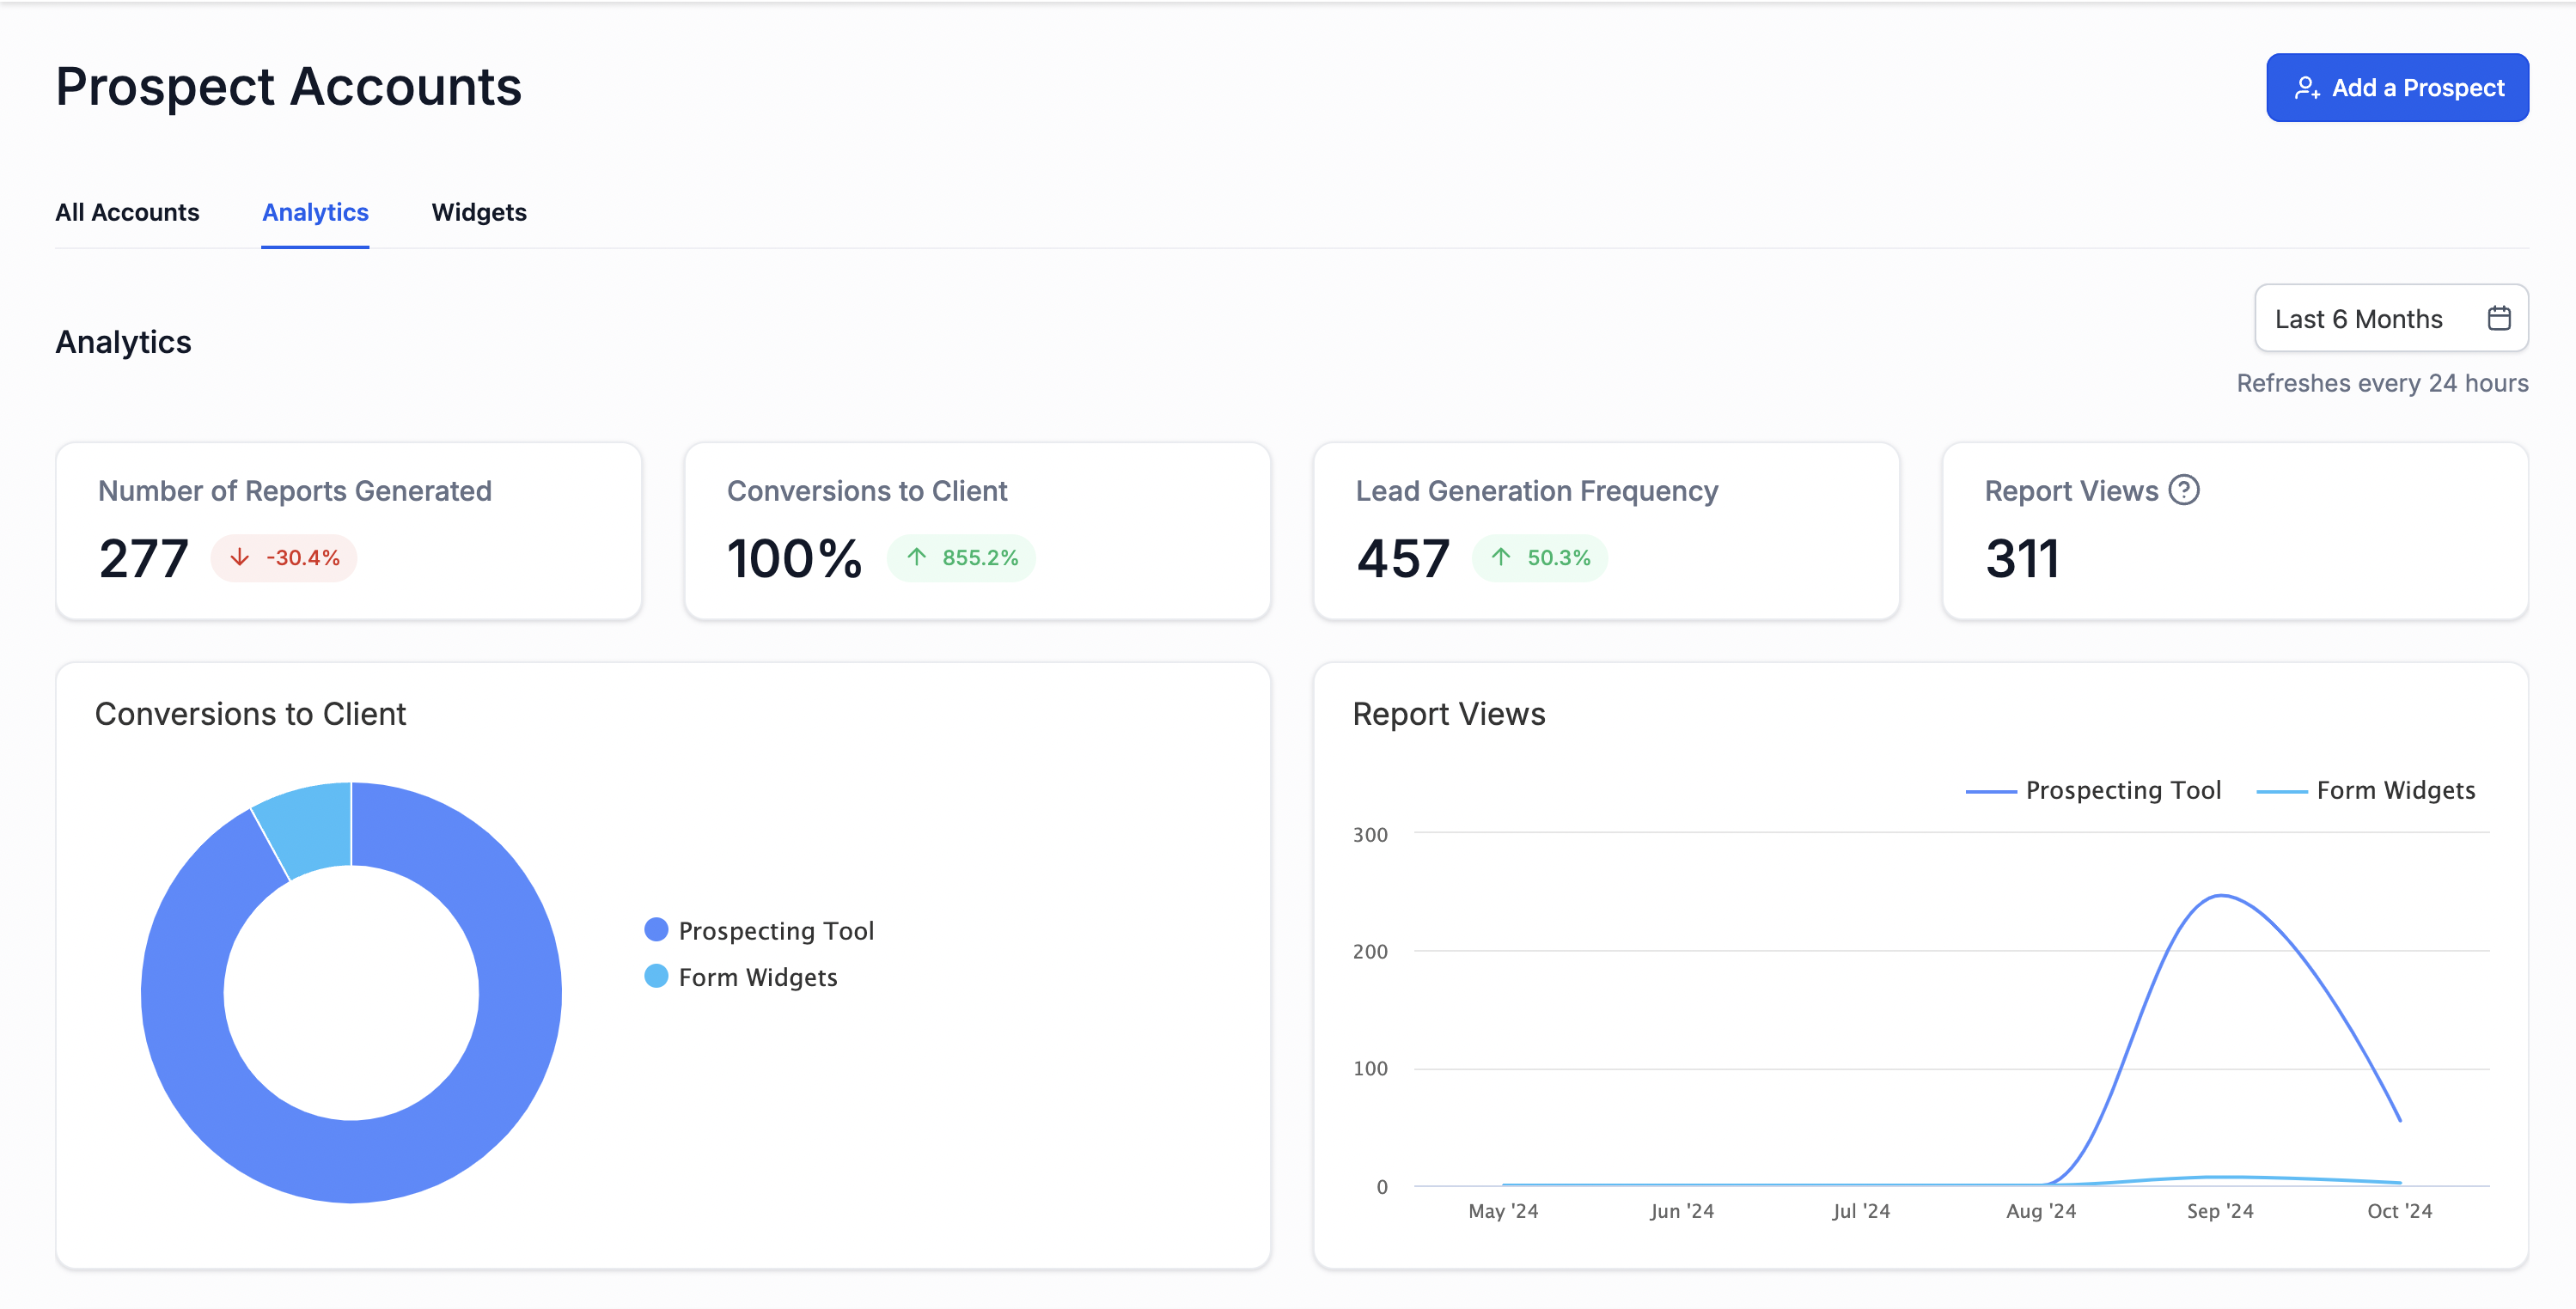
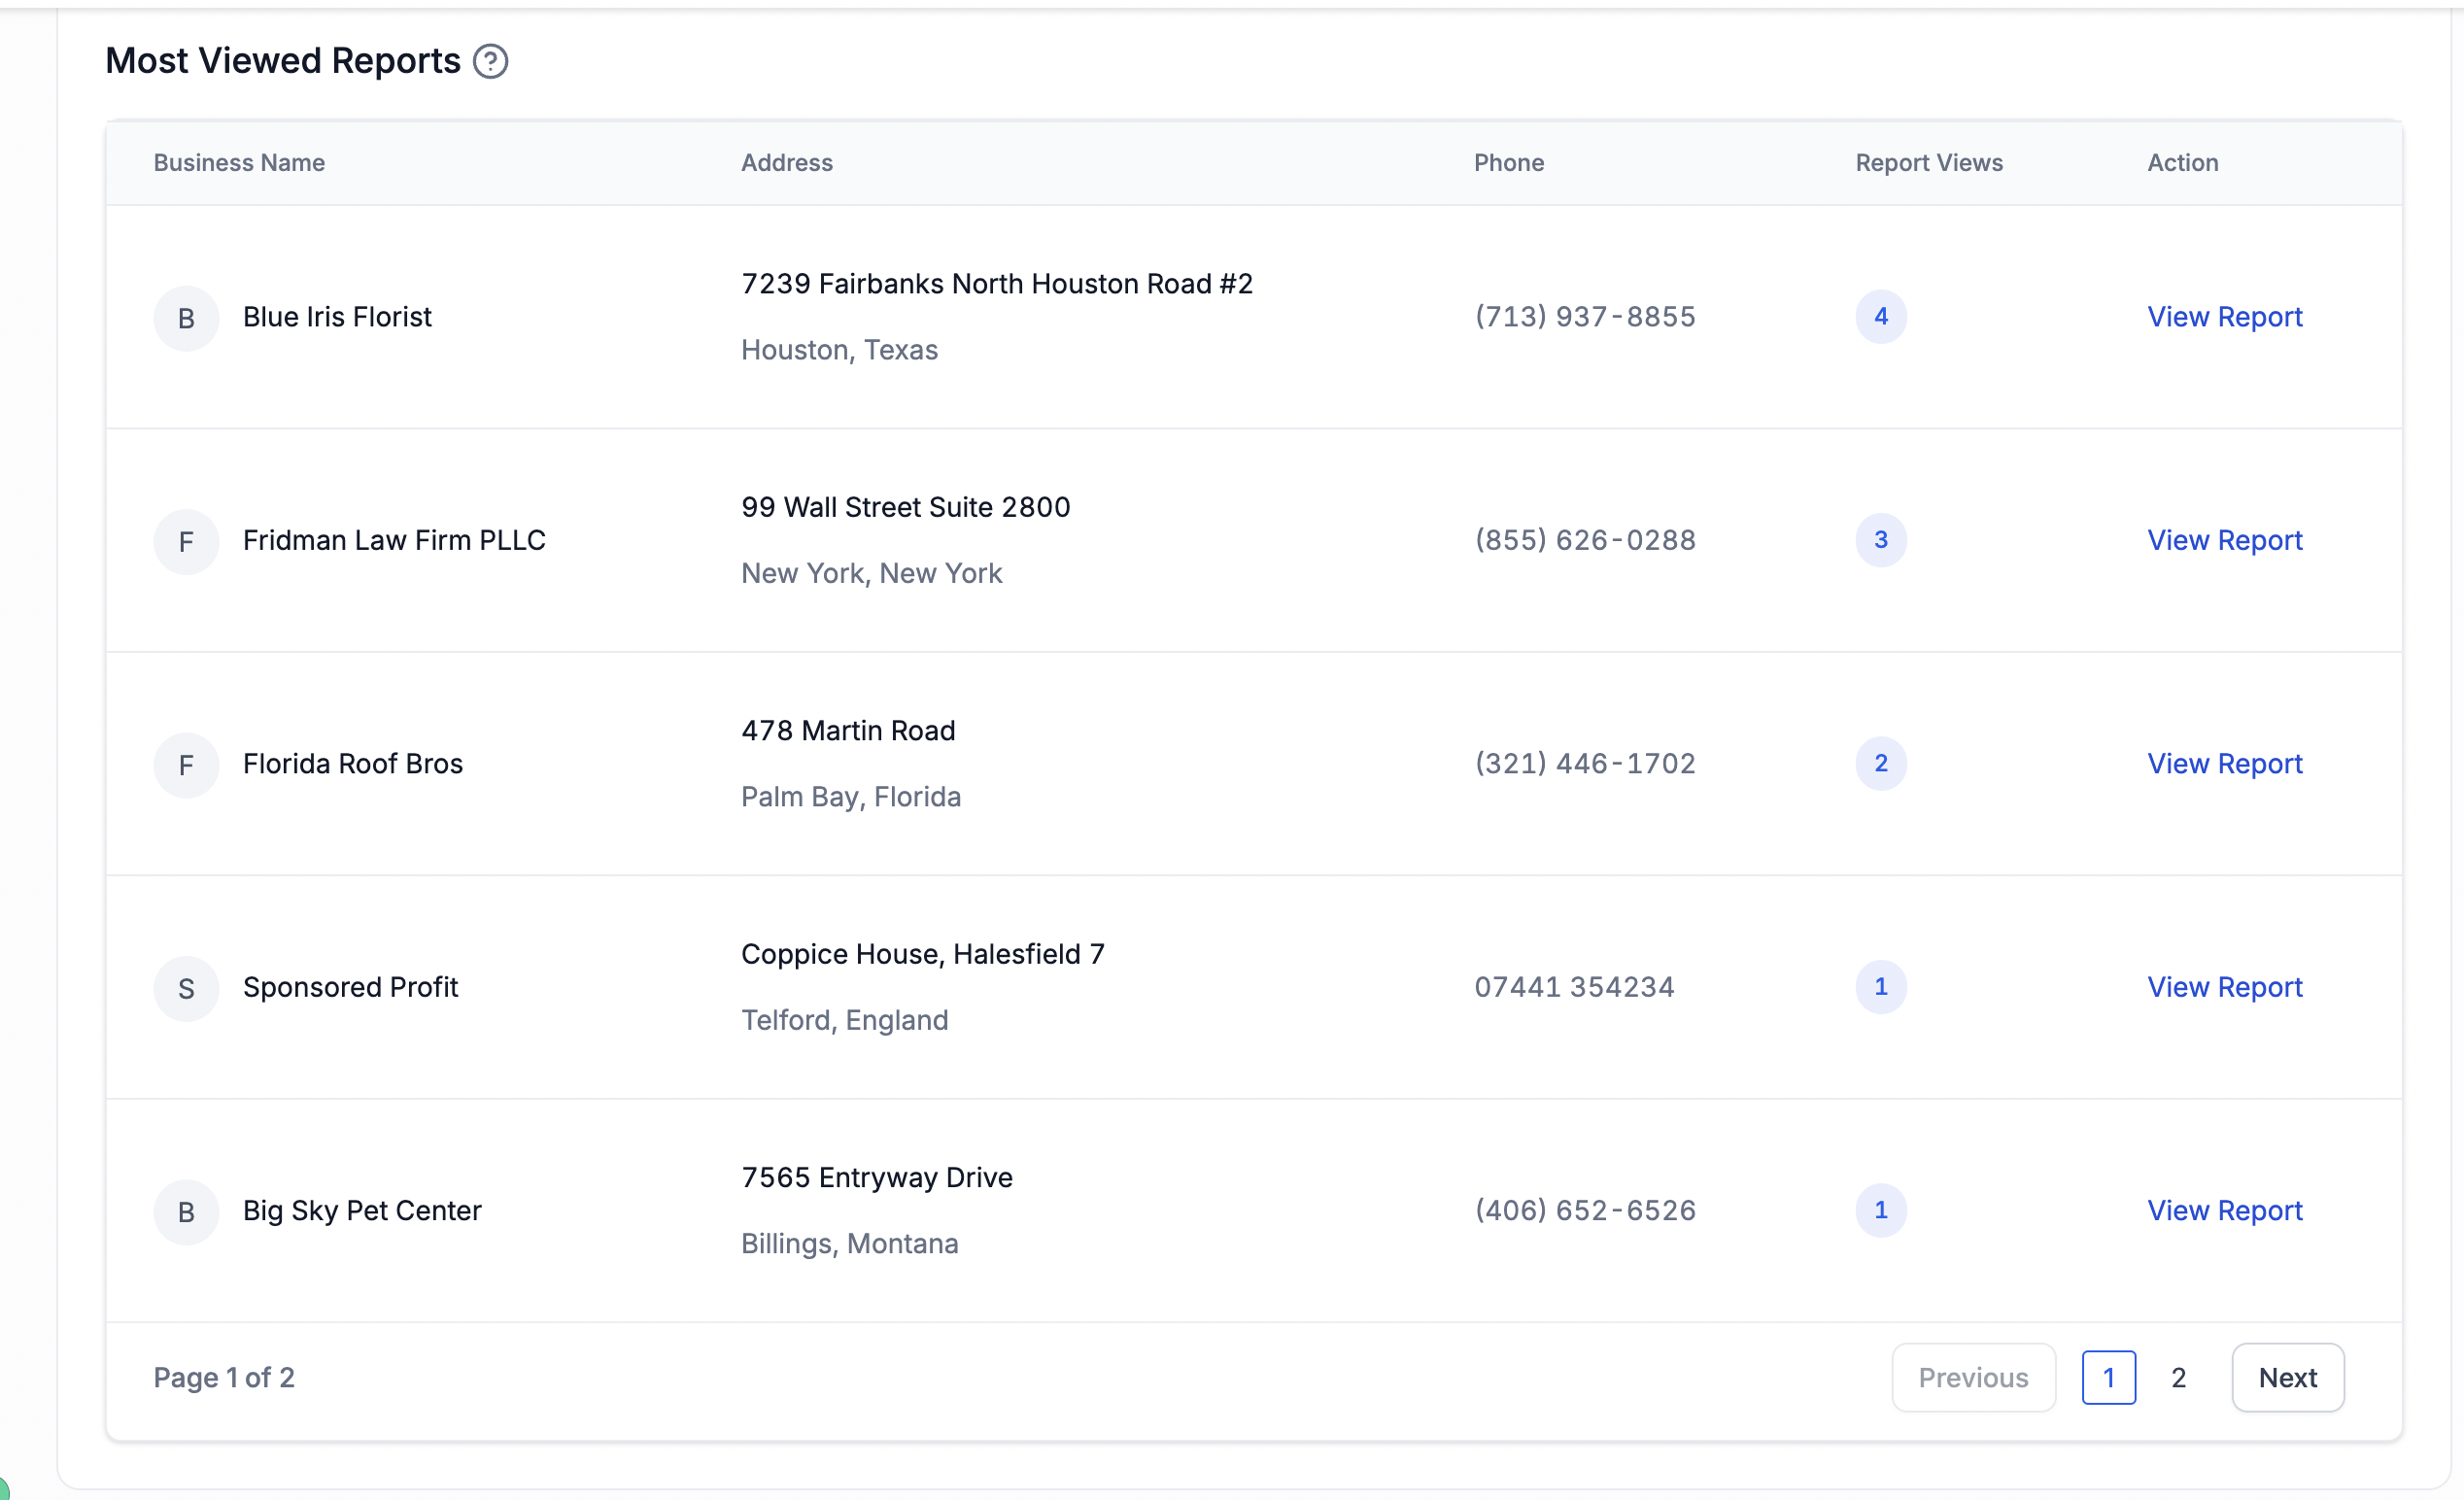
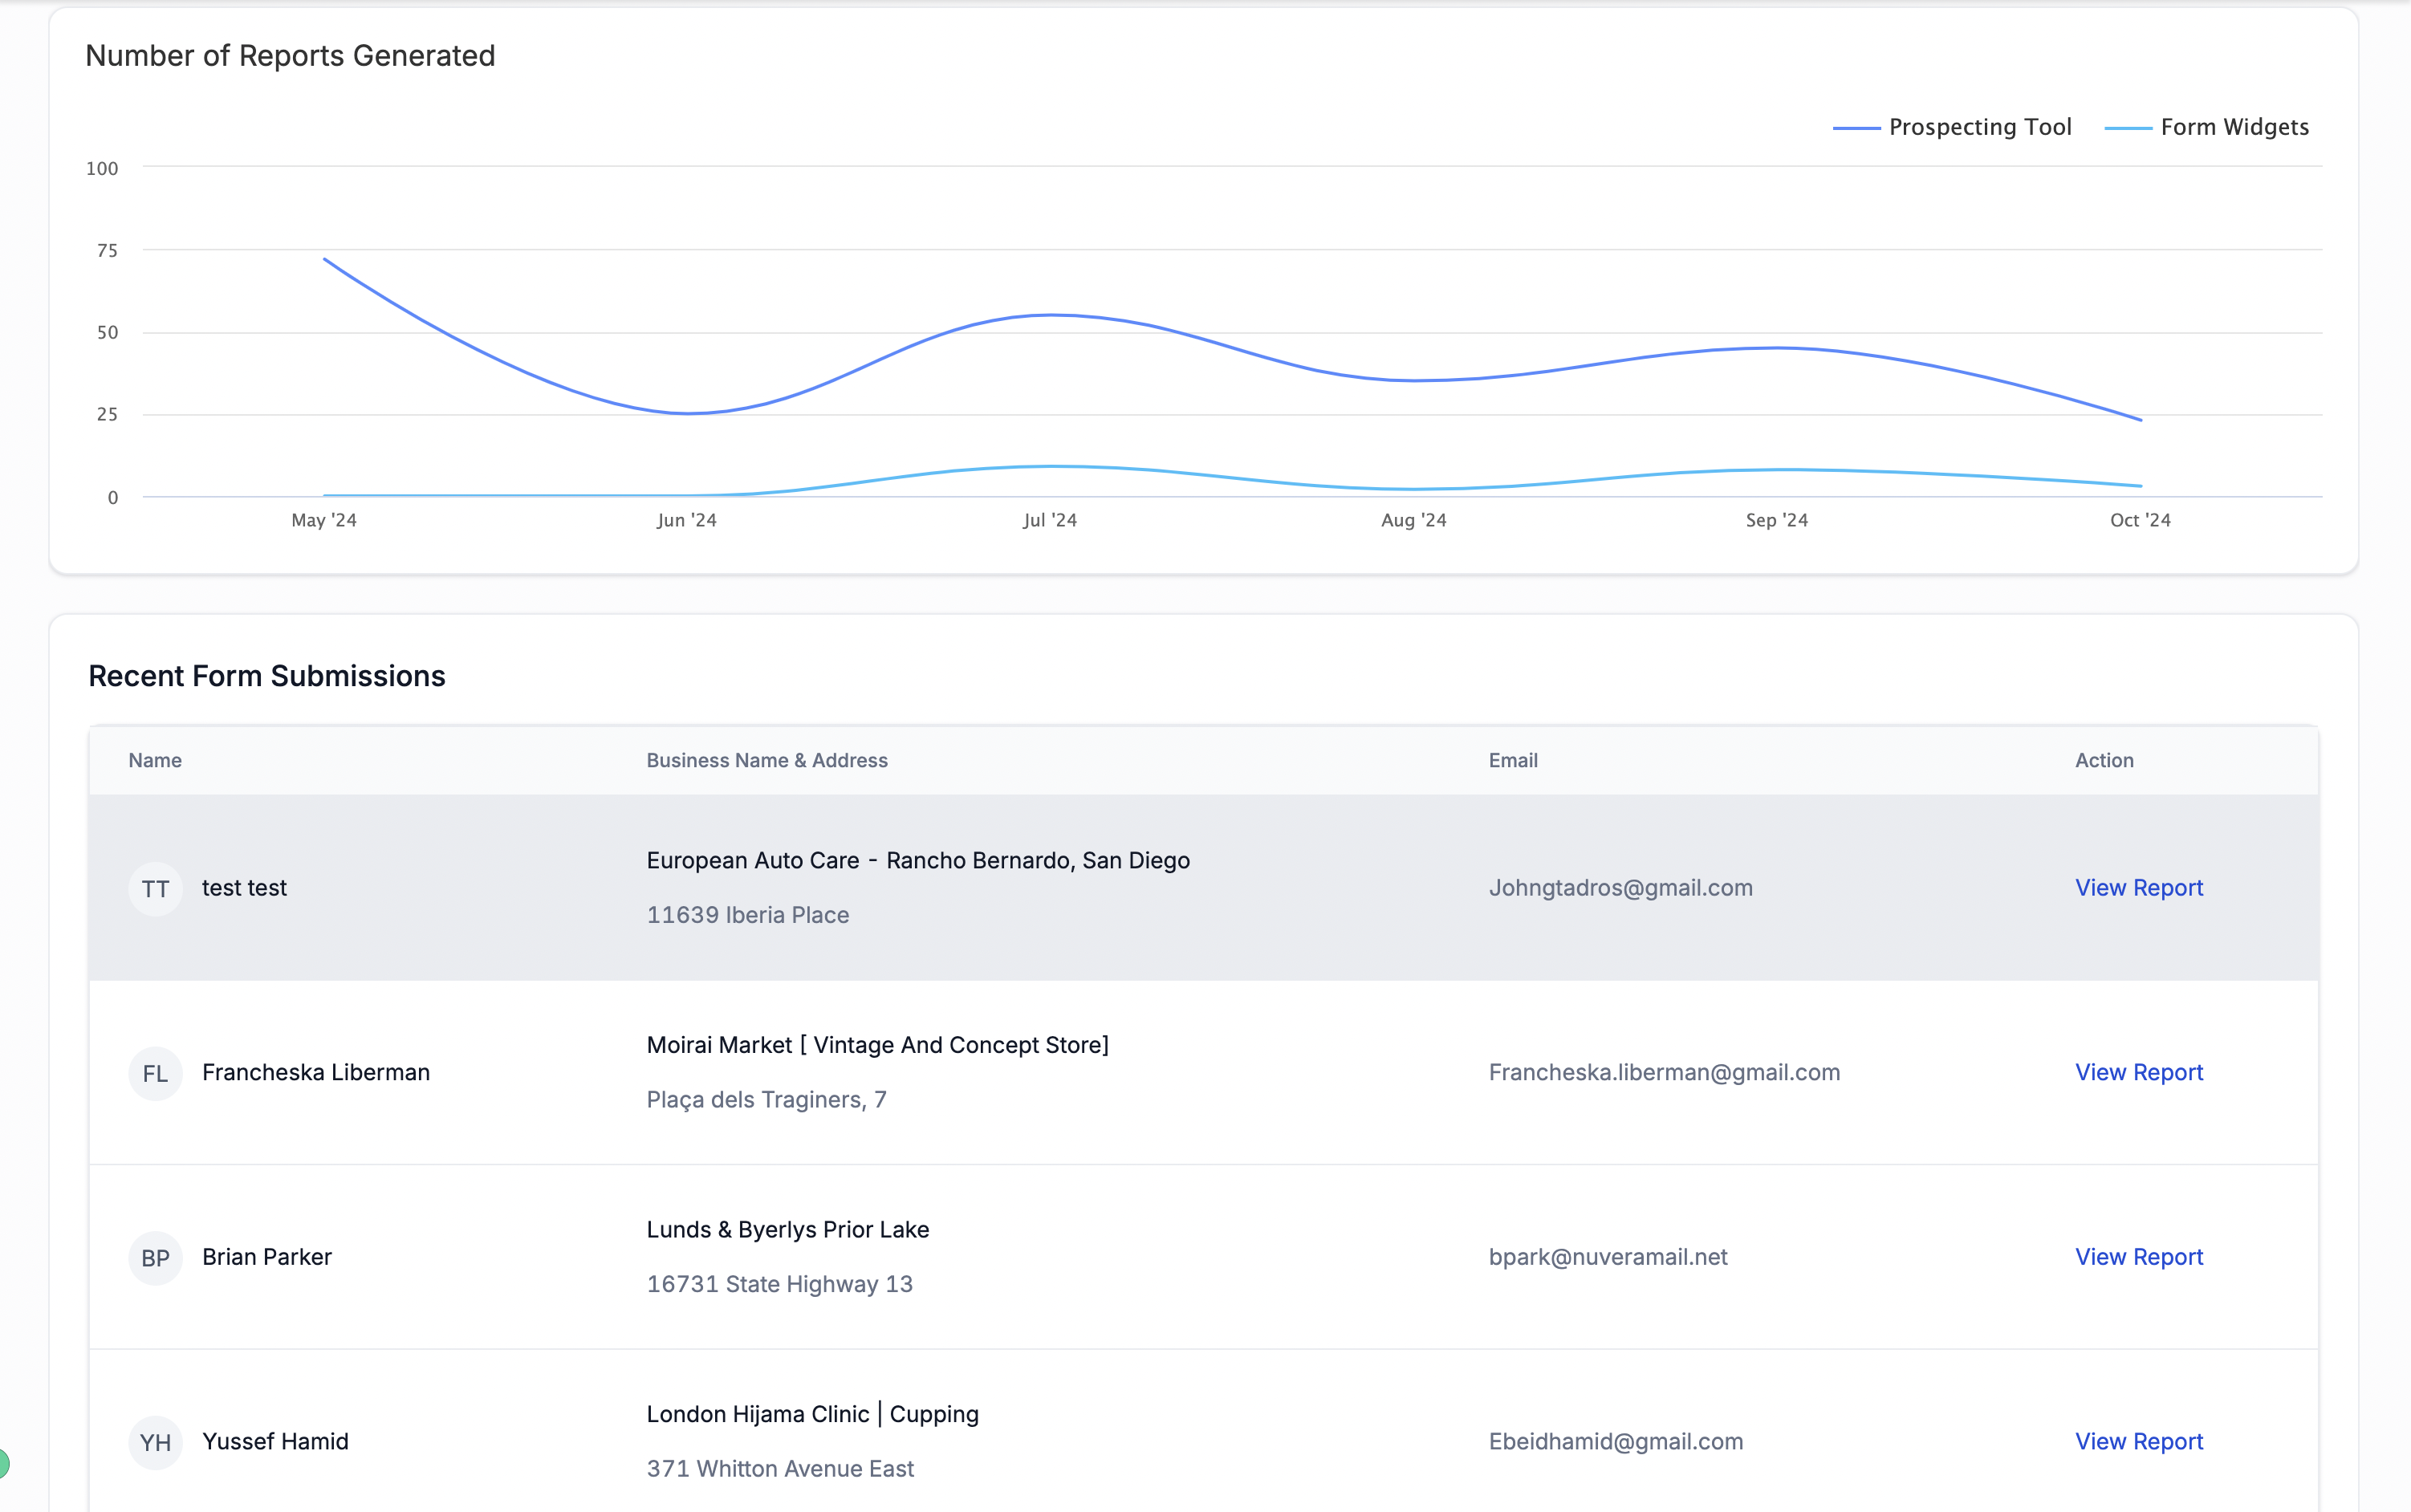
The Analytics Dashboard aggregates data from the Prospecting Tool and presents it in one place. It shows how many prospect reports have been generated, how many leads those reports produced, the total number of conversions, which reports receive the most views, and reports that originated from embedded forms. The dashboard updates as data is refreshed, giving a current snapshot of activity.
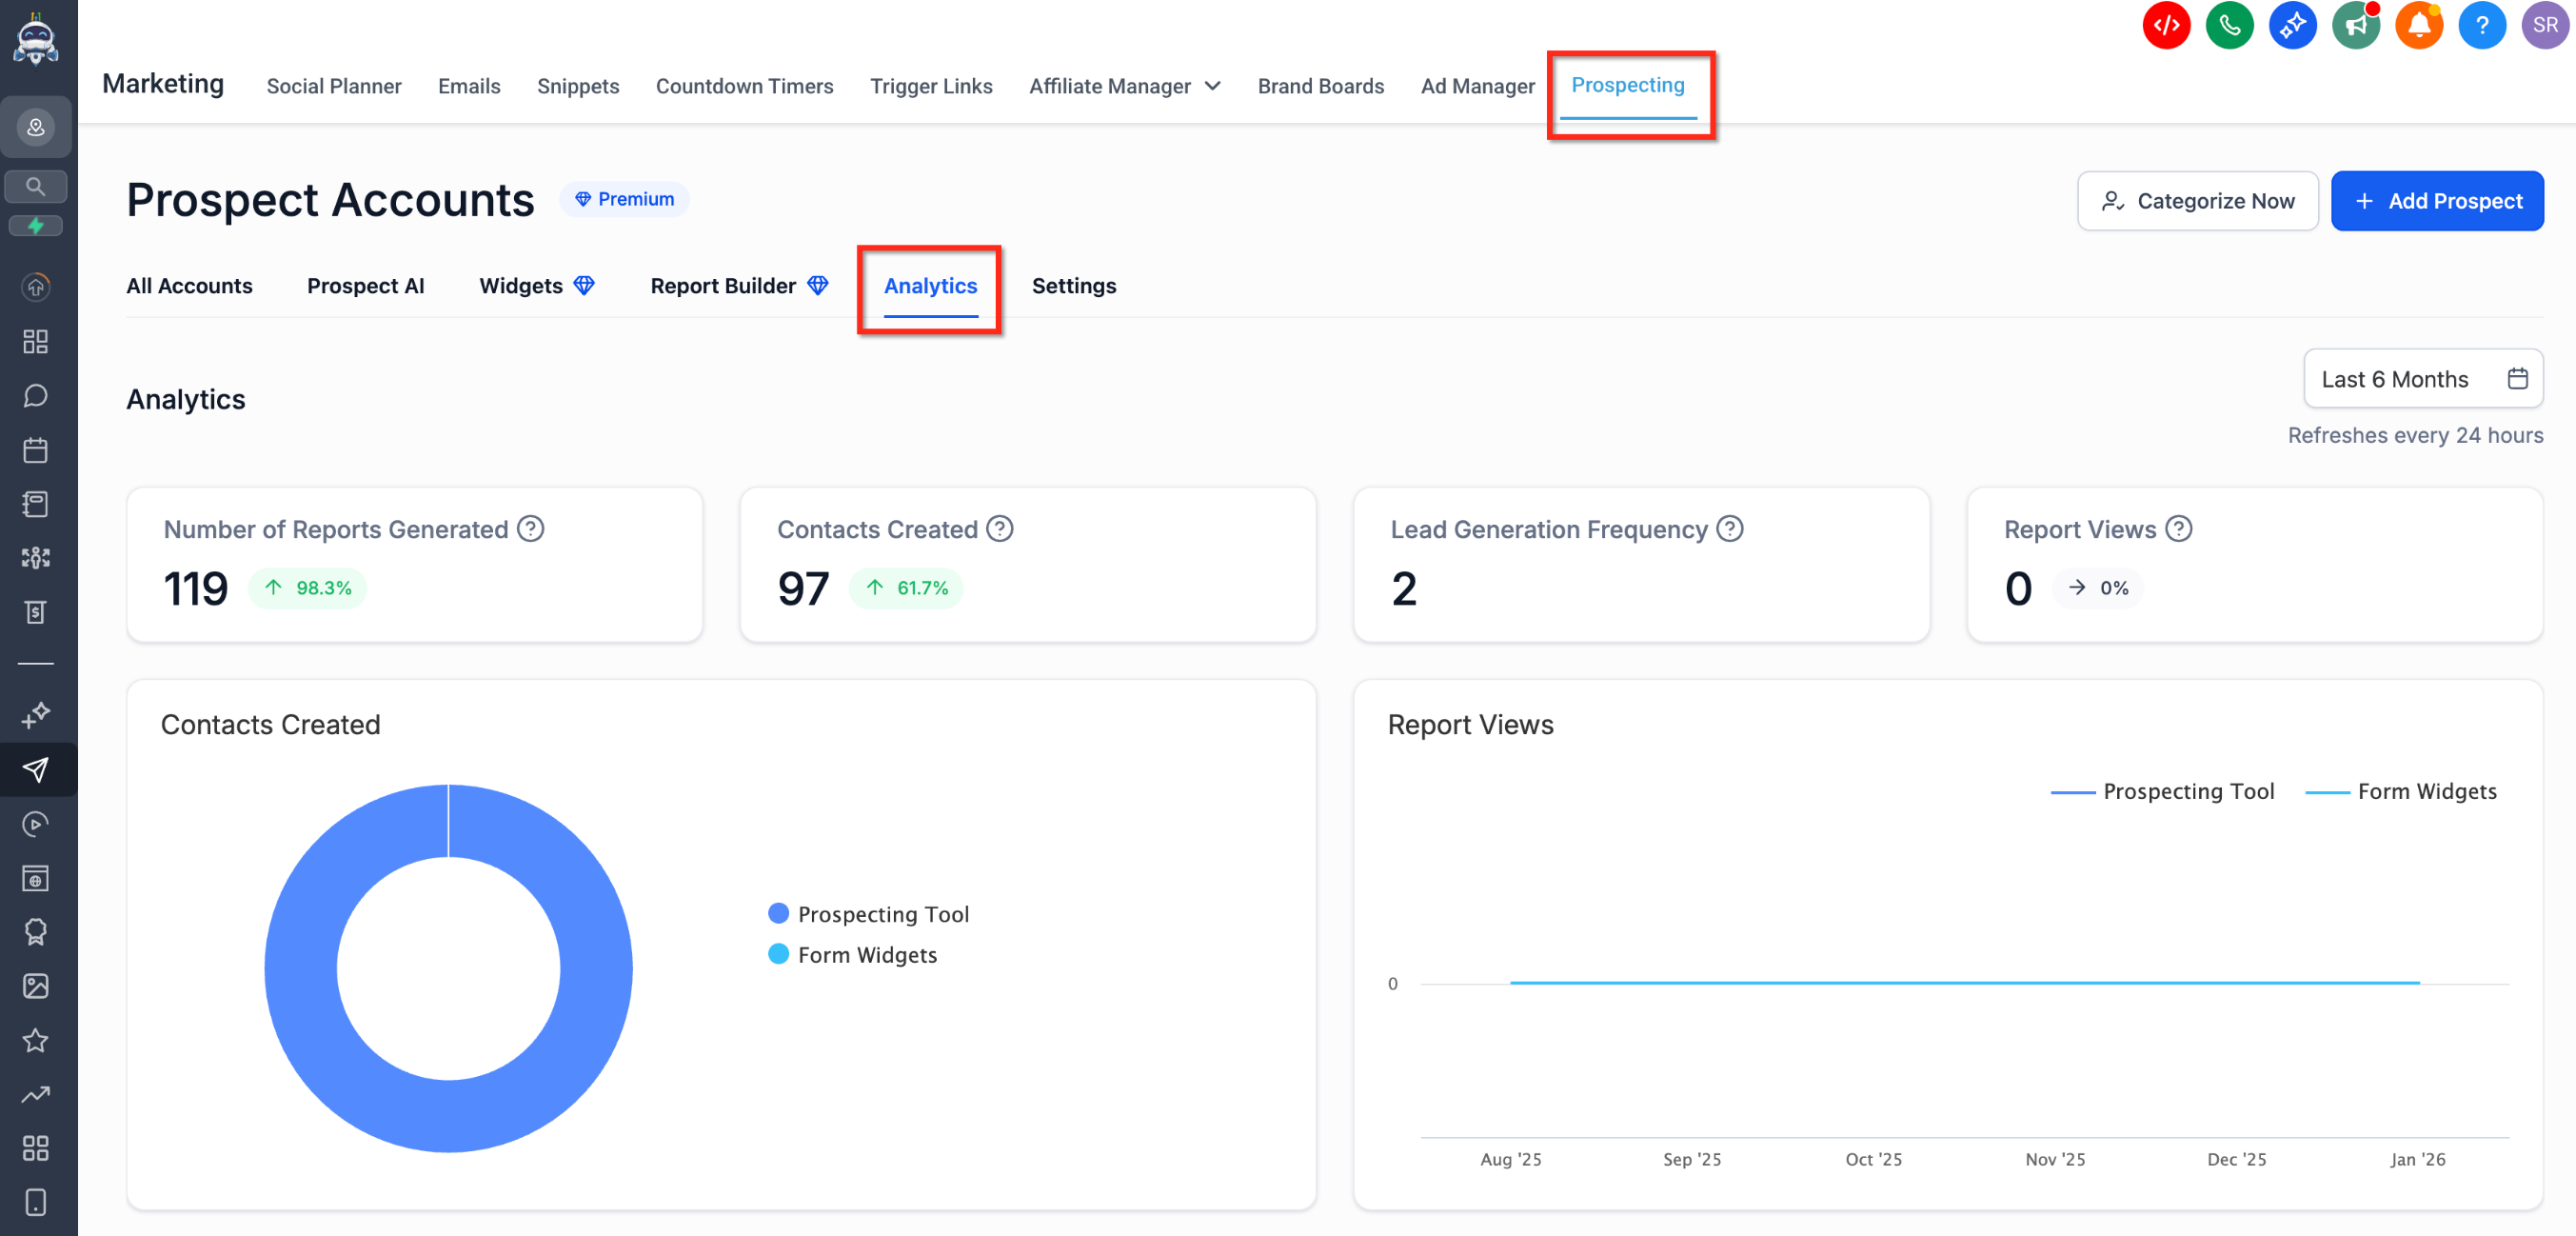
The dashboard is accessed by navigating to Prospecting Tool under the Marketing menu, then selecting the Analytics section where cards and charts display each metric. Deleted prospects are removed from all dashboard cards and charts, so the view reflects only active data.
03How businesses use analytics dashboards for prospecting
- Digital marketing agency. The agency opens the dashboard to see the count of reports each client subaccount has generated. By reviewing the highest viewed reports, the team can highlight successful content and suggest similar approaches for other clients.
- Real estate brokerage. The brokerage checks the leads generated metric to understand how many property prospects came from reports. It also looks at total conversions to gauge how many of those leads became customers, informing agent coaching.
- SaaS startup. The startup examines the reports generated through forms metric to evaluate how effective its website capture forms are. The view of report engagement helps refine the messaging on landing pages.
04How to set up and use analytics dashboards for prospecting in HighLevel
Access the Analytics Dashboard
- Navigate to Prospecting Tool under the Marketing menu.
- Click the "Analytics" section in the main Dashboard.
- You will be taken to the Analytics Dashboard where key metrics are displayed.
05What it looks like in HighLevel
06Things to know before you rely on it
- Data cannot be exported from the dashboard in PDF or CSV formats; export functionality may be added later.
- If a prospect is permanently deleted, its historical data is removed from all dashboard cards and charts.
07How it connects to the rest of HighLevel
- Use the Prospecting tool to generate reports that feed the dashboard. Prospecting in subaccounts
- Learn how prospecting drives lead generation for your campaigns. Lead generation with prospecting
- Review pricing options if you need the Agency View features. HighLevel pricing
Michael's take

I find the Analytics Dashboard useful for seeing prospecting activity across subaccounts.
Don’t assume the data is static; it changes with integrations, so check that your forms and reporting sources stay connected.