
01Who this is for
- Agency owners who manage multiple client sites can view uptime data from a single dashboard.
- SaaS Founders running a WordPress based product can monitor performance and investigate incidents quickly.
- IT managers of small businesses can share uptime history with clients for transparency.
02WordPress uptime monitor, explained
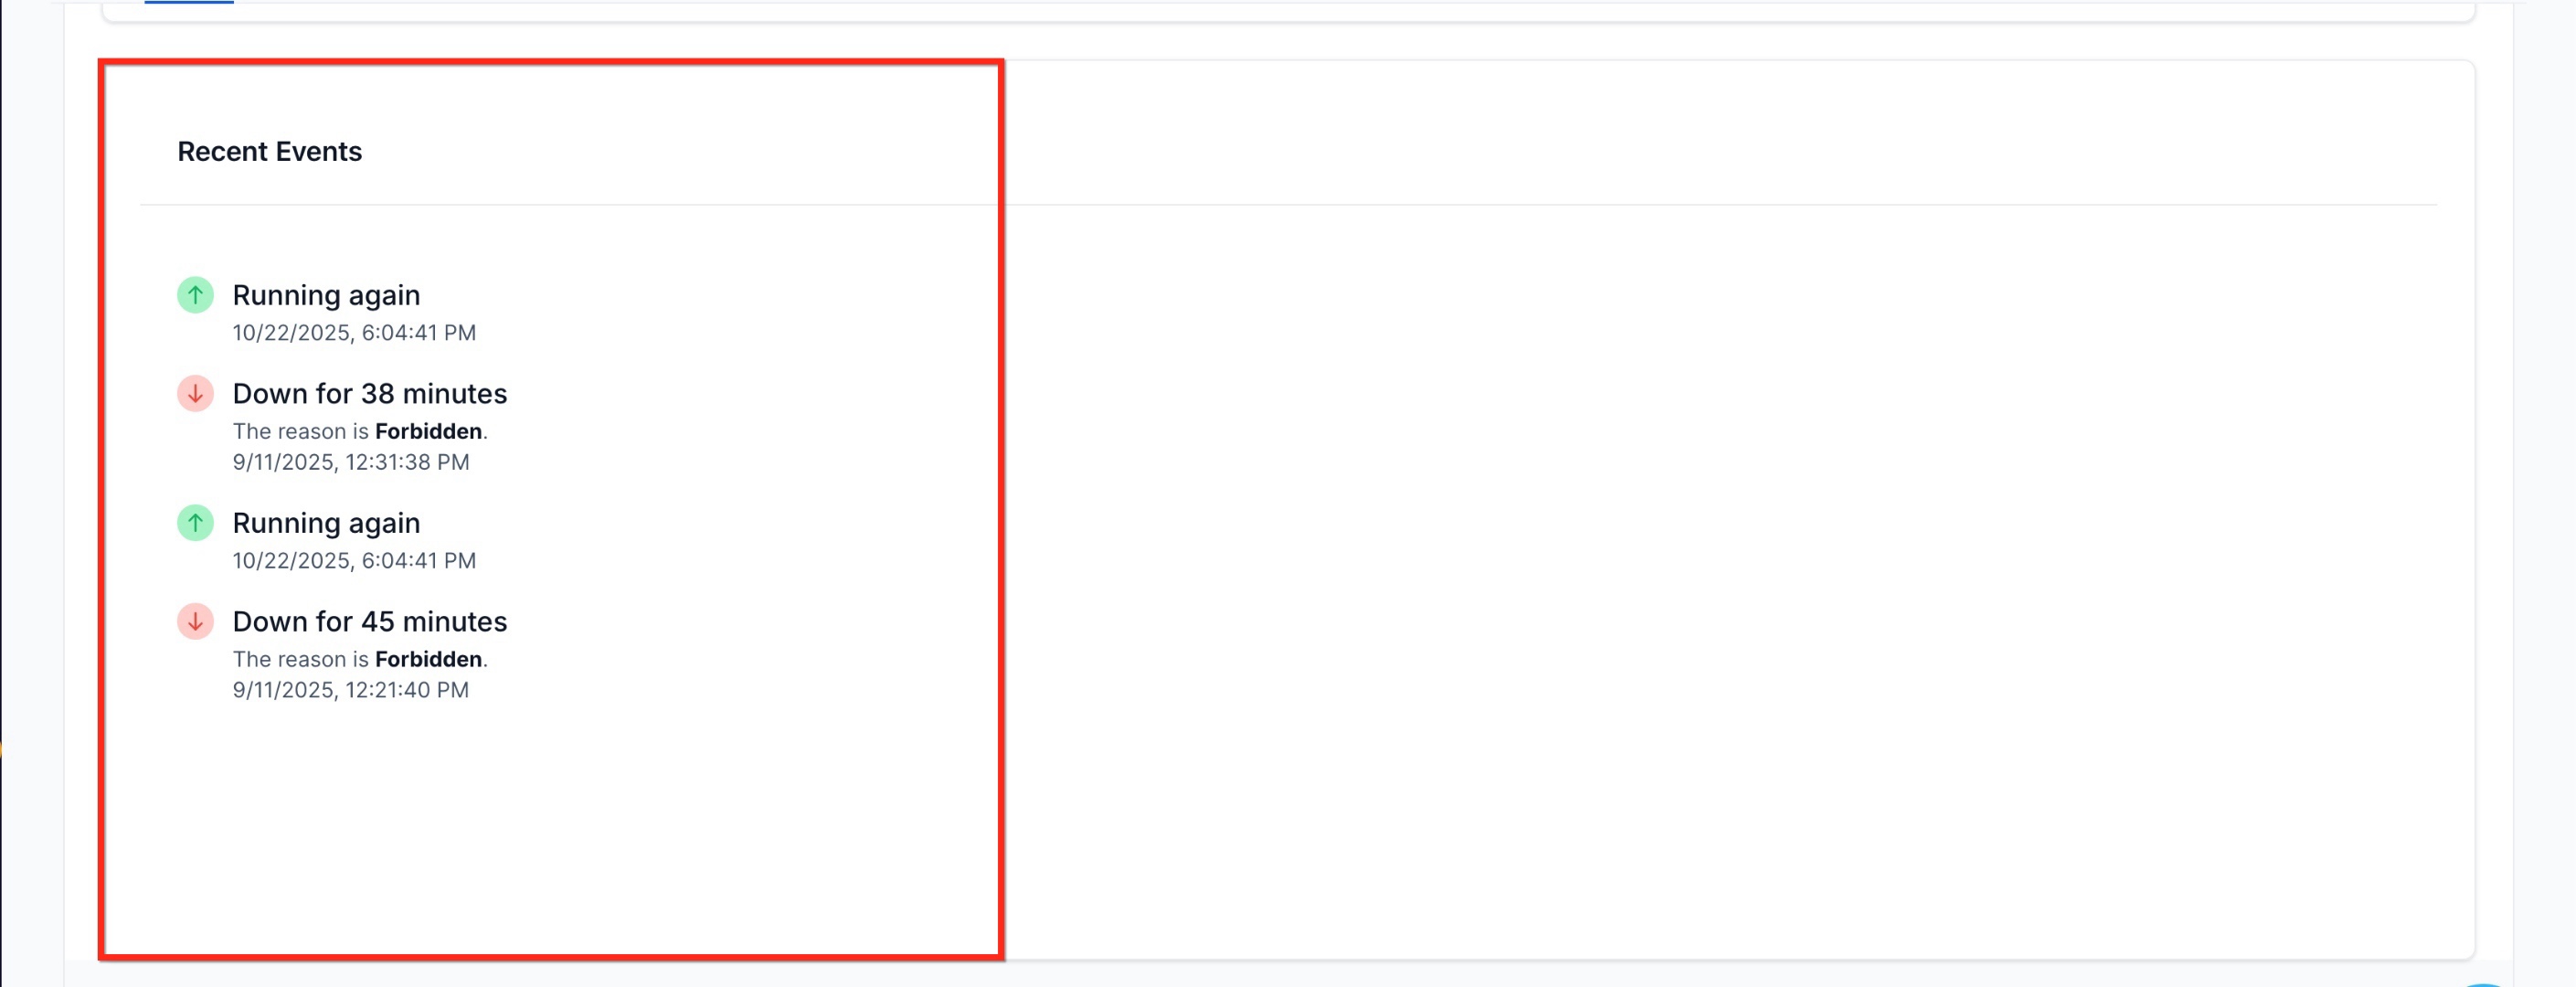
The WordPress Uptime Monitor runs periodic checks on every hosted WordPress site. It verifies that the site is reachable and records how long each response takes. It also logs any downtime events and the moment the site recovers, adding timestamps and context.
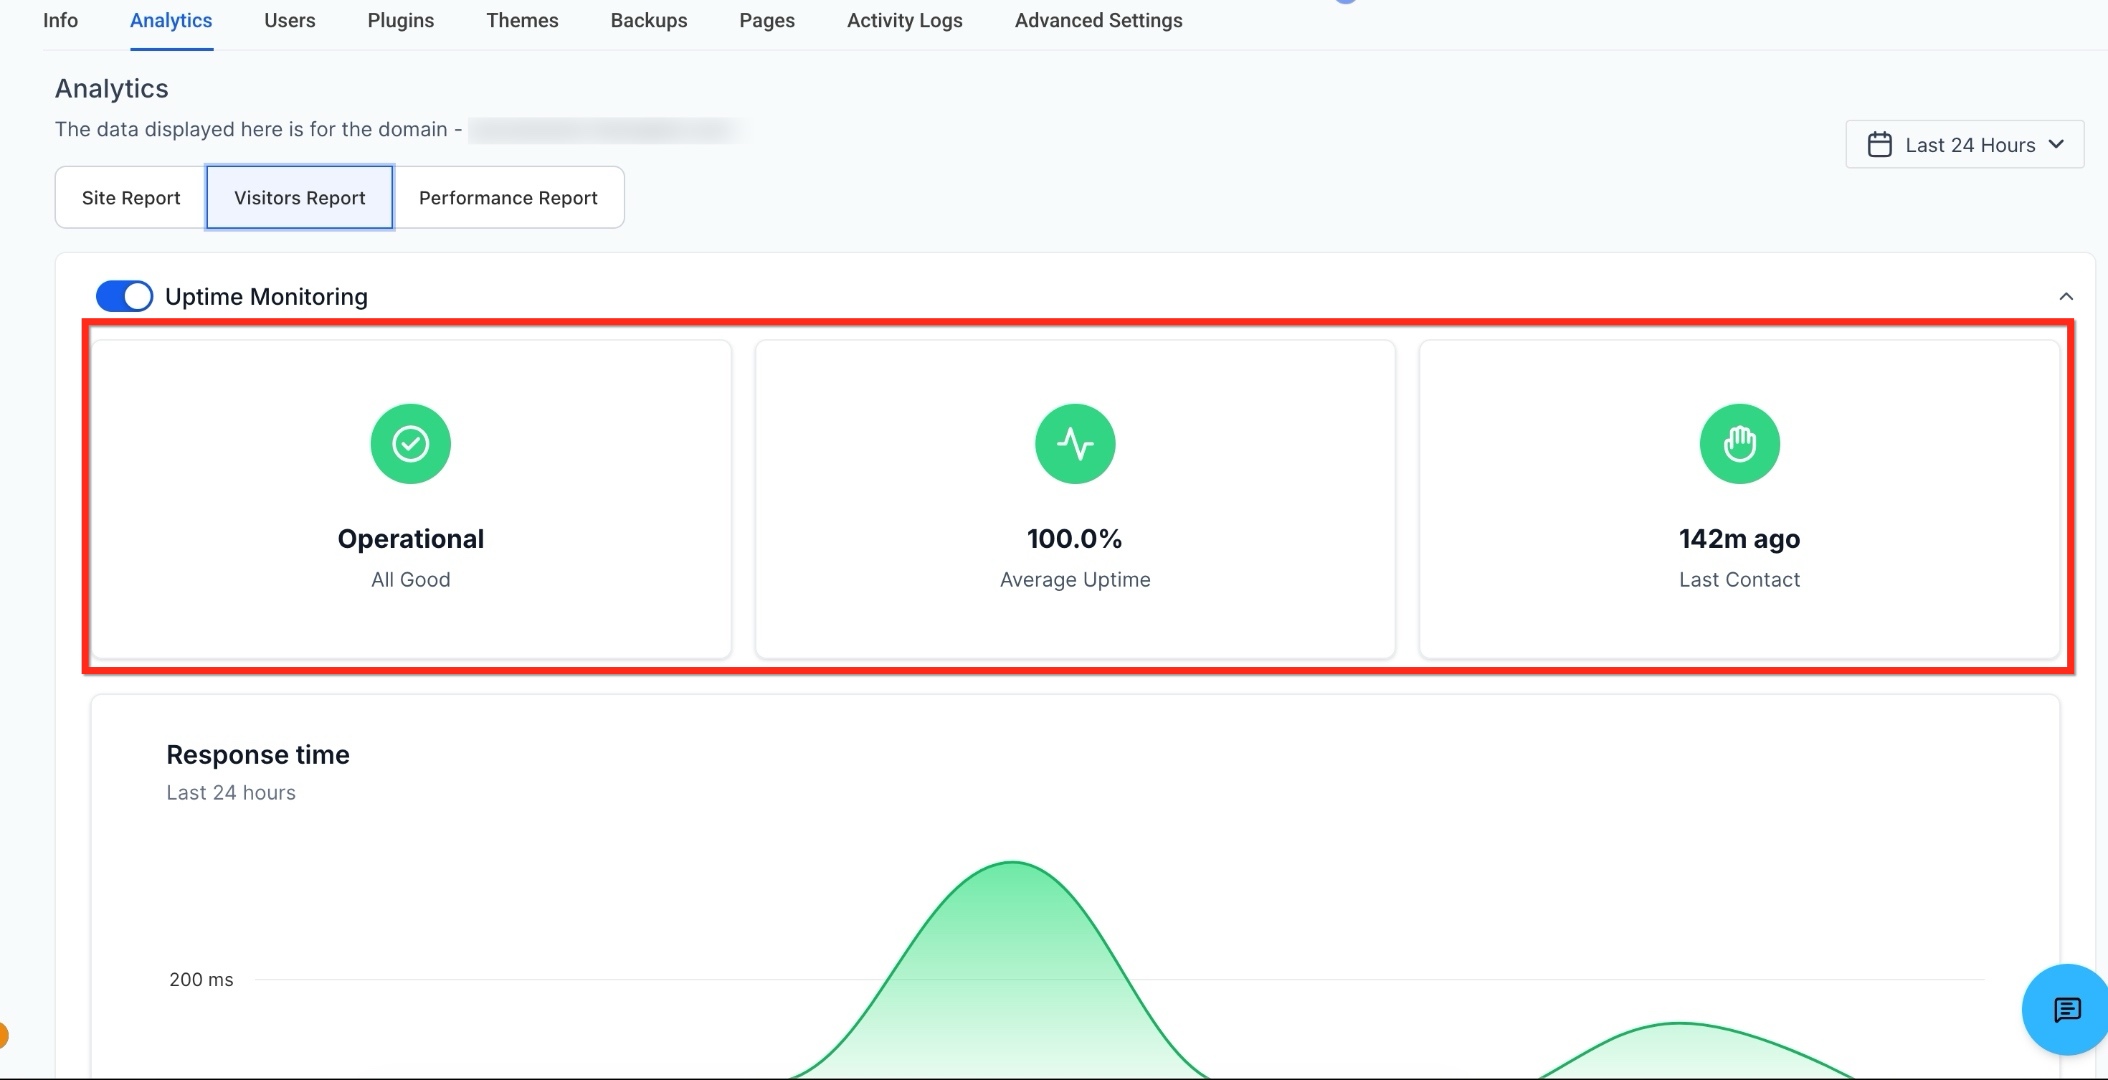
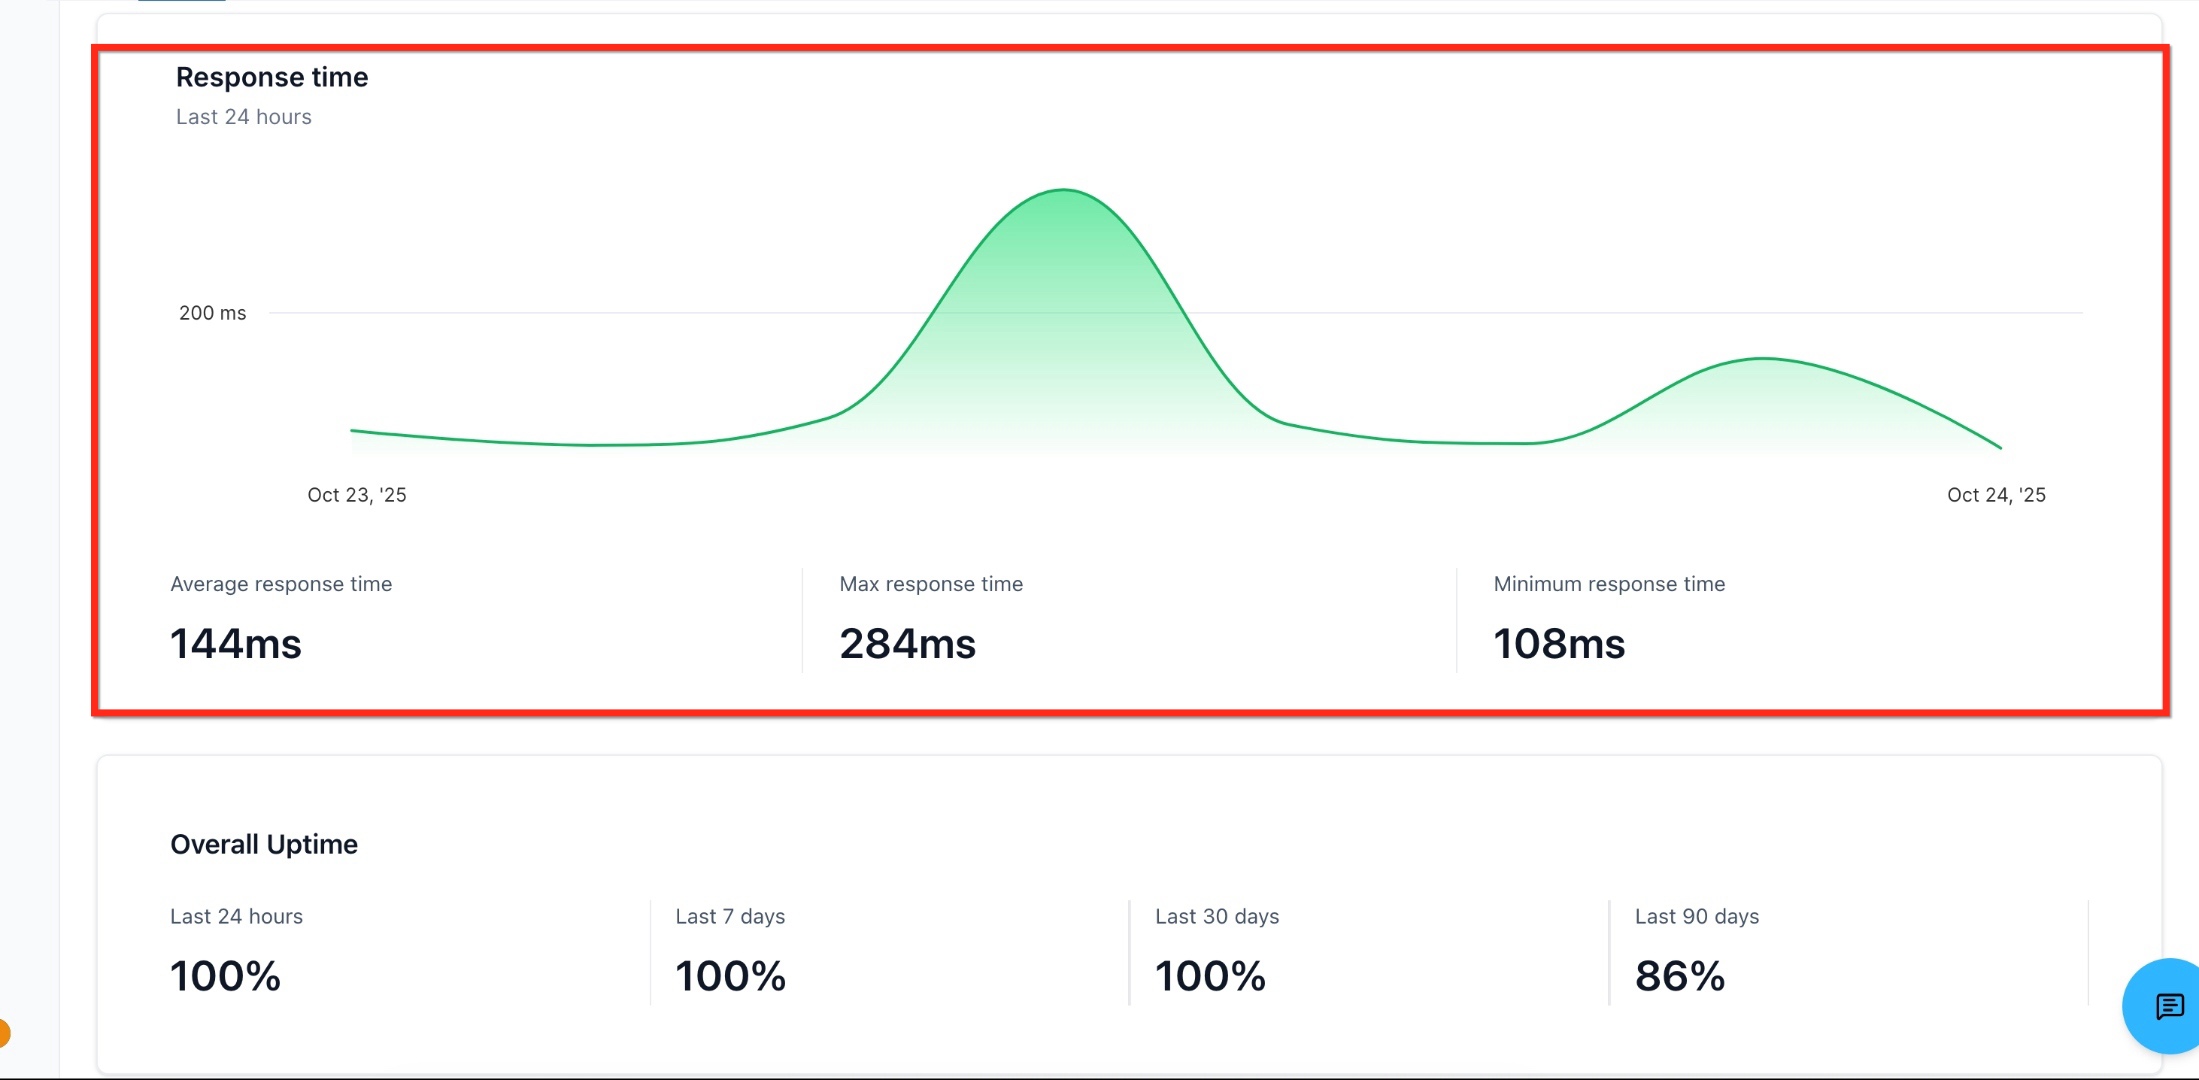
The monitor updates a modern dashboard inside the HighLevel WordPress hosting UI. The dashboard shows status and health cards, response time analytics, and a feed of recent events. Data appears in real time, so users can see current reachability, average uptime for a selected period, and the last time the monitor ran.
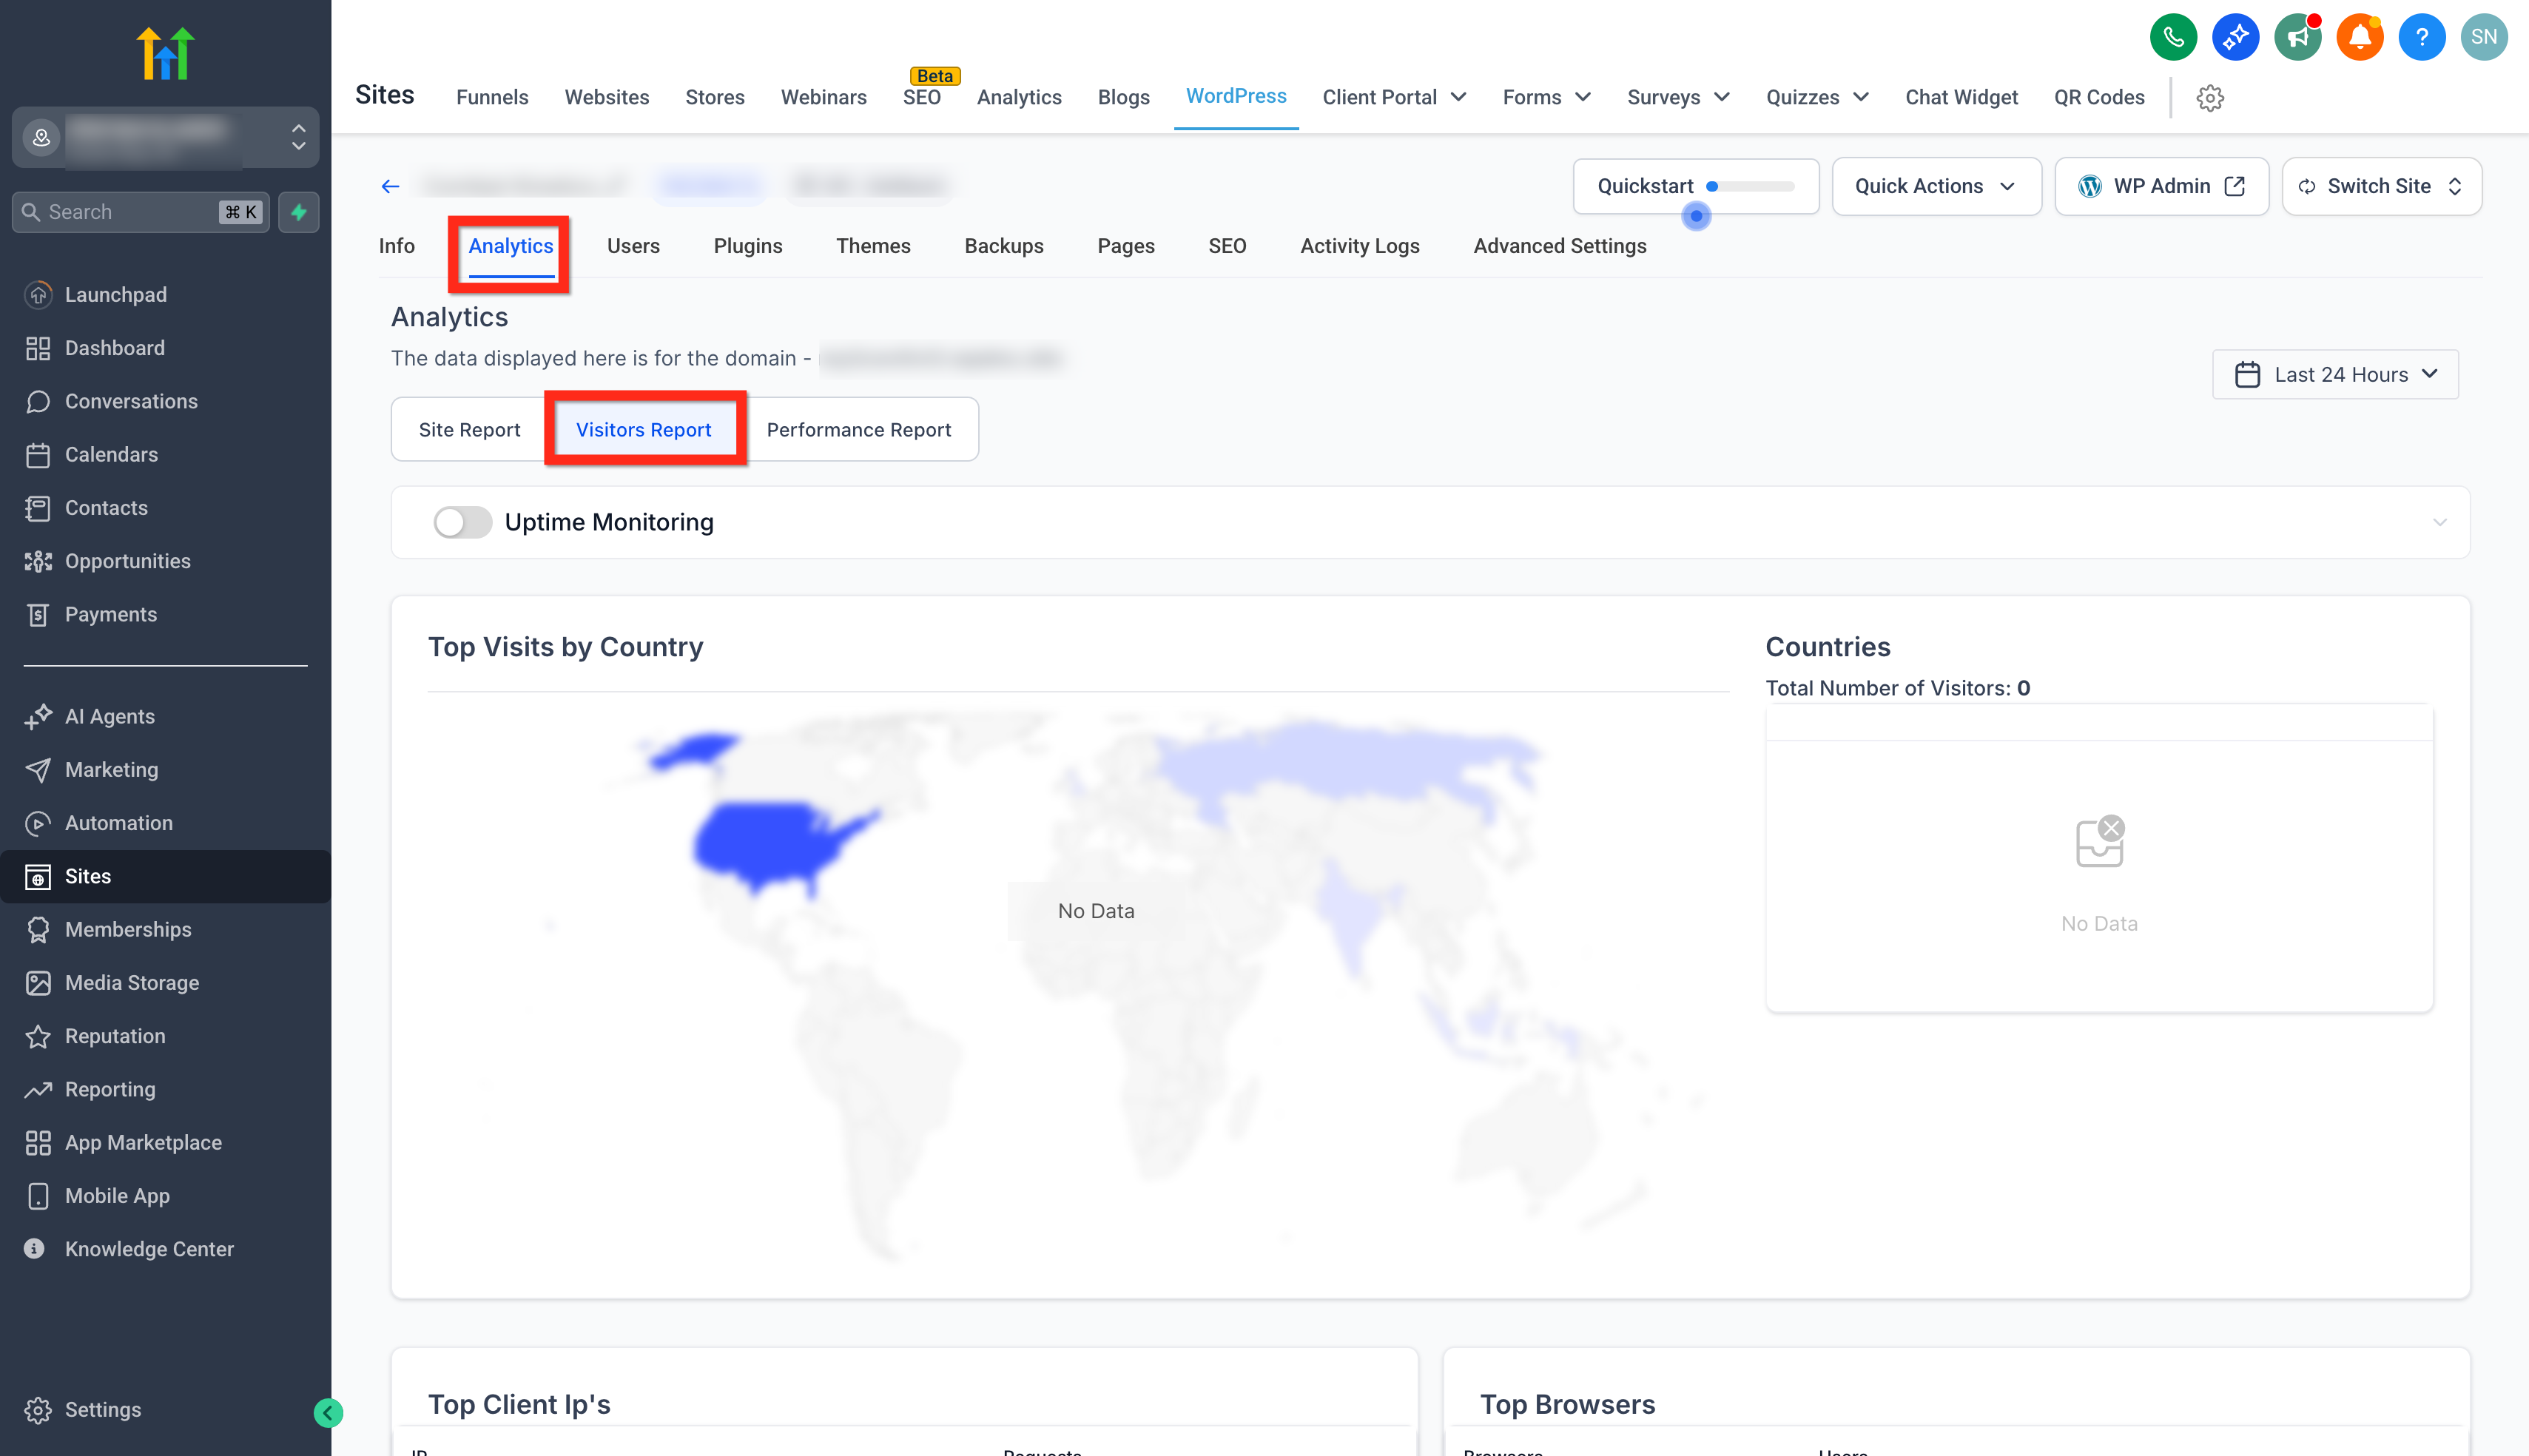
All information lives in the same area where you manage hosting, backups, and other WordPress tools. You can access it by opening the Visitors Report under Analytics for a specific site.
03How businesses use the WordPress uptime monitor
- Digital marketing agency. The agency enables the monitor for each client site from the Visitors Report. It then checks the status cards each morning to confirm sites are operational. If a card shows downtime, the team opens the recent events feed to see when the issue began.
- Ecommerce store. The store turns the monitor on for its storefront site in HighLevel. It reviews the response time analytics to spot performance spikes after product launches. The analytics help decide whether to investigate plugins or server resources.
- SaaS startup. The startup activates the monitor on its WordPress based dashboard. It uses the average uptime card during stakeholder meetings to demonstrate reliability. When a downtime event appears, the startup copies the timestamp from the recent events list into its internal ticket.
04The numbers and rules that matter
- Tracks minimum, average, maximum response times over the last 24 hours.
05How to set up and use the WordPress uptime monitor in HighLevel
Enable the WordPress Uptime Monitor
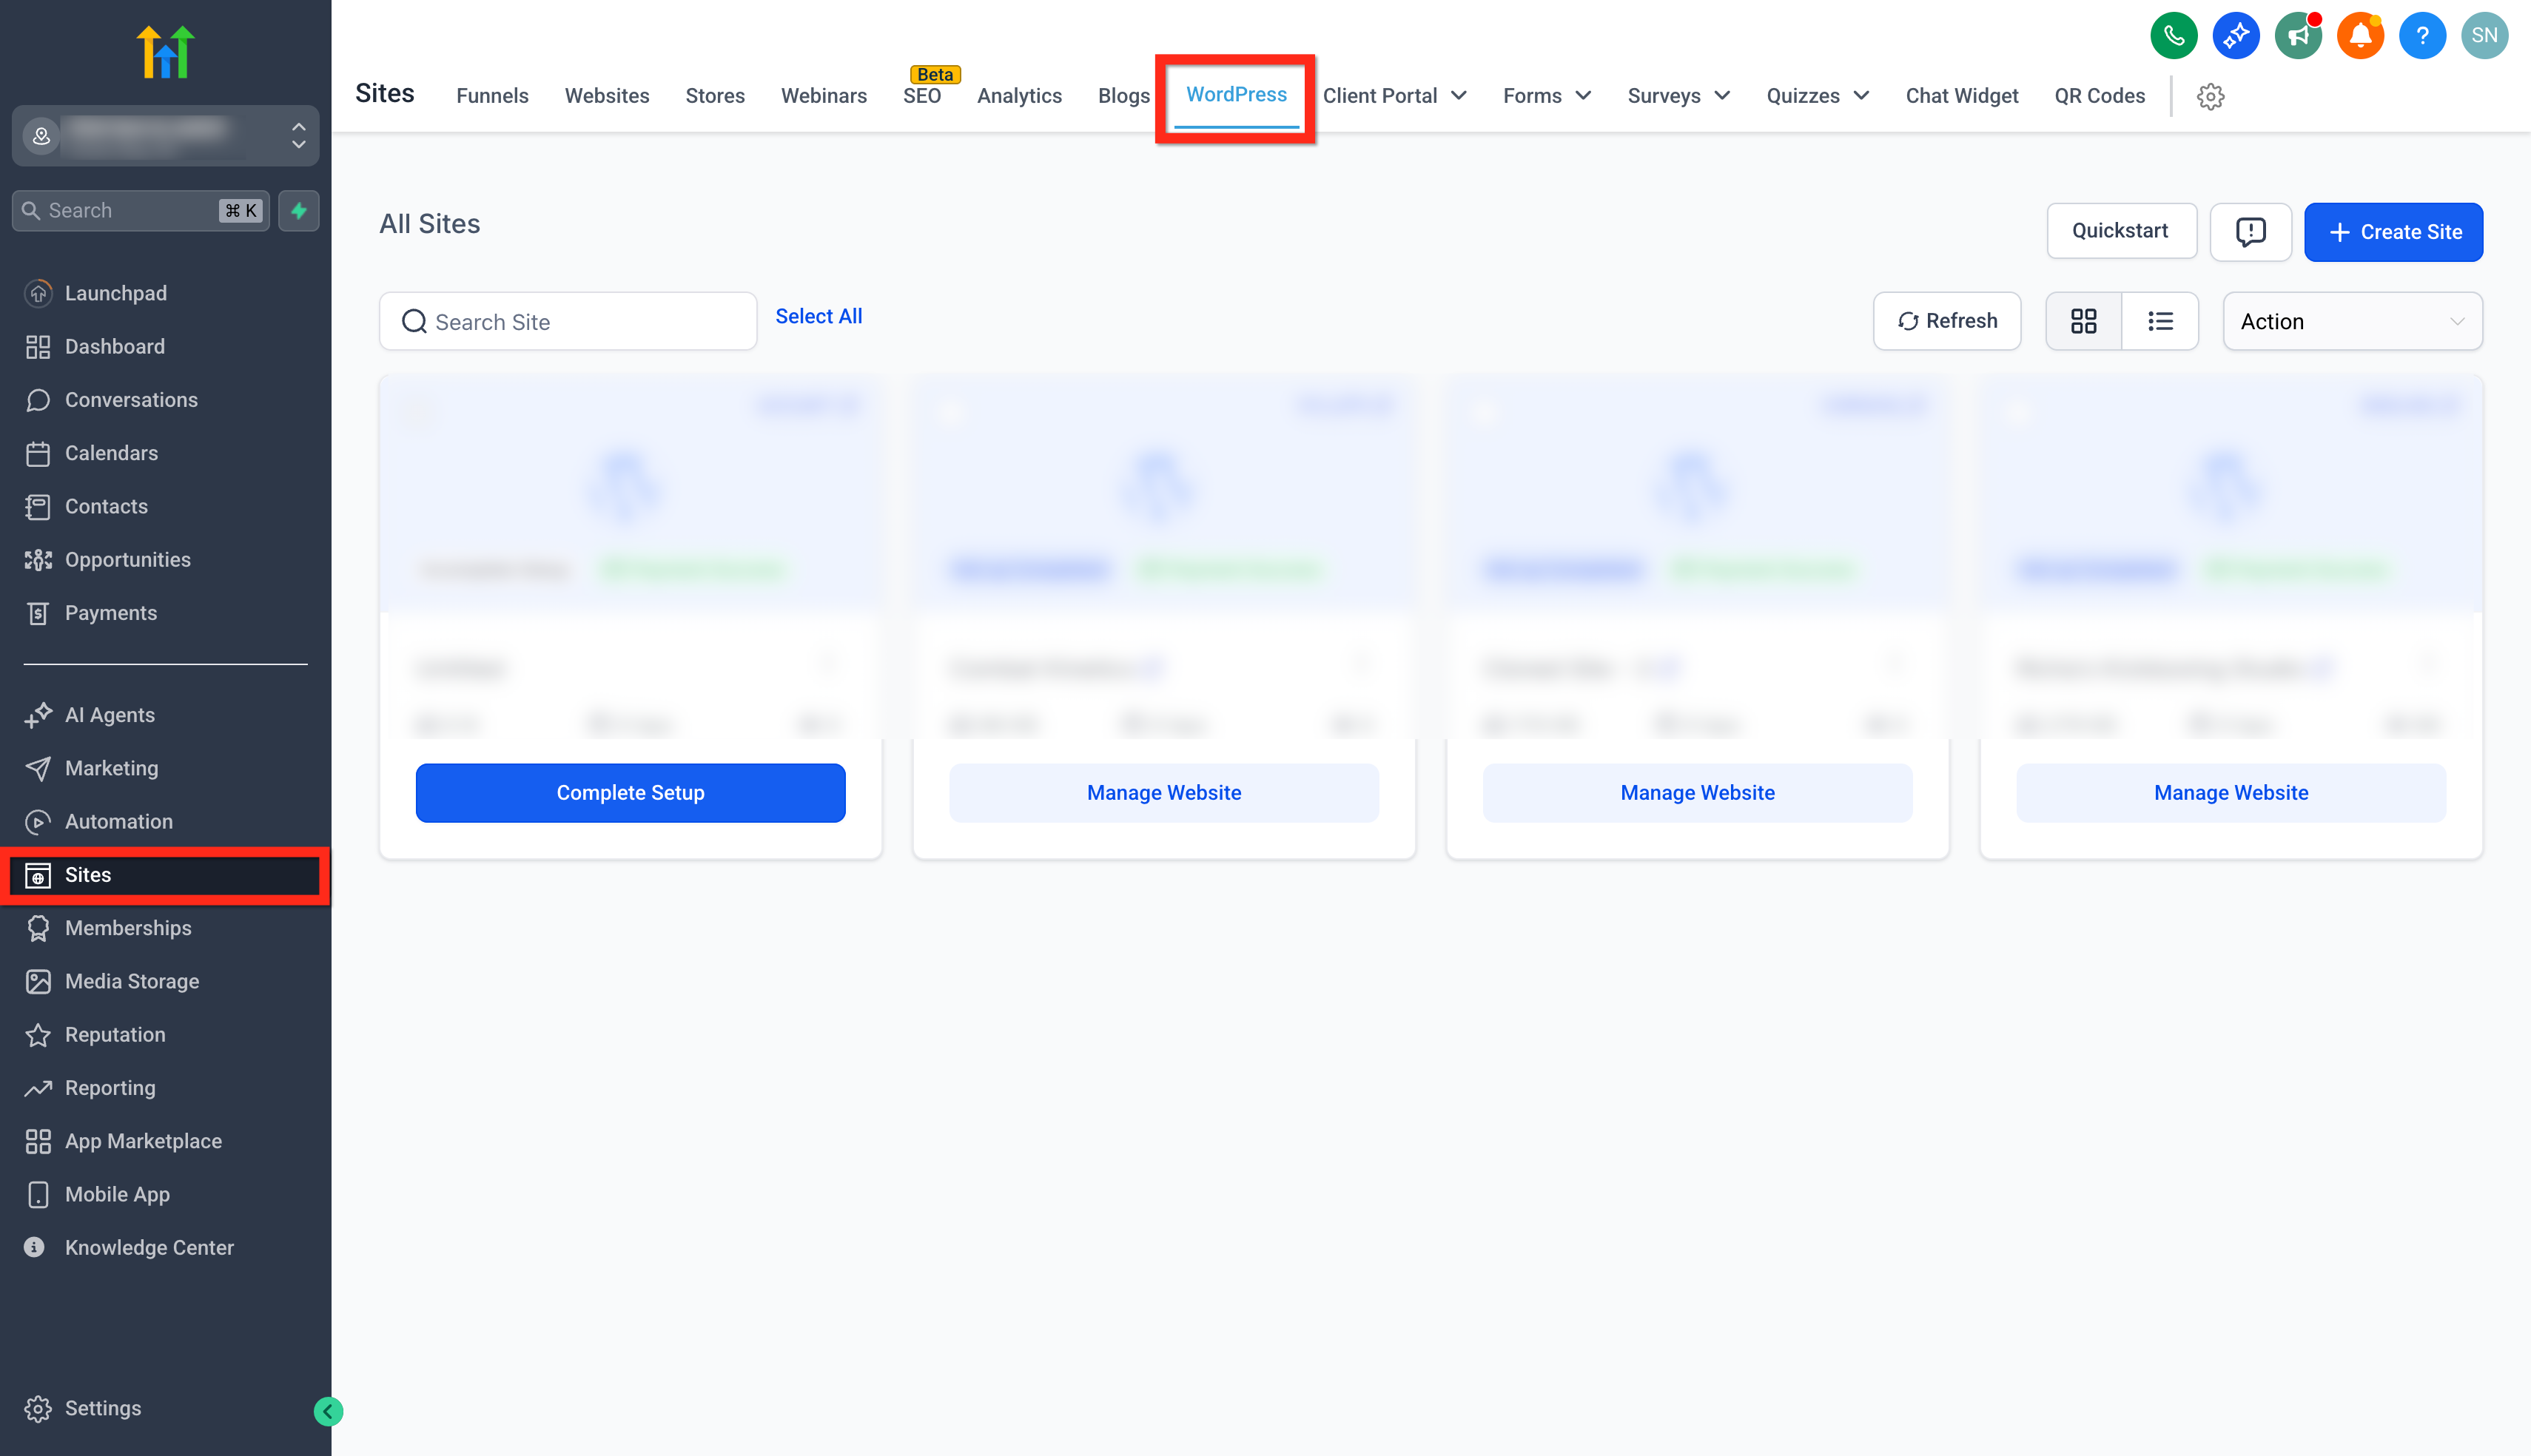
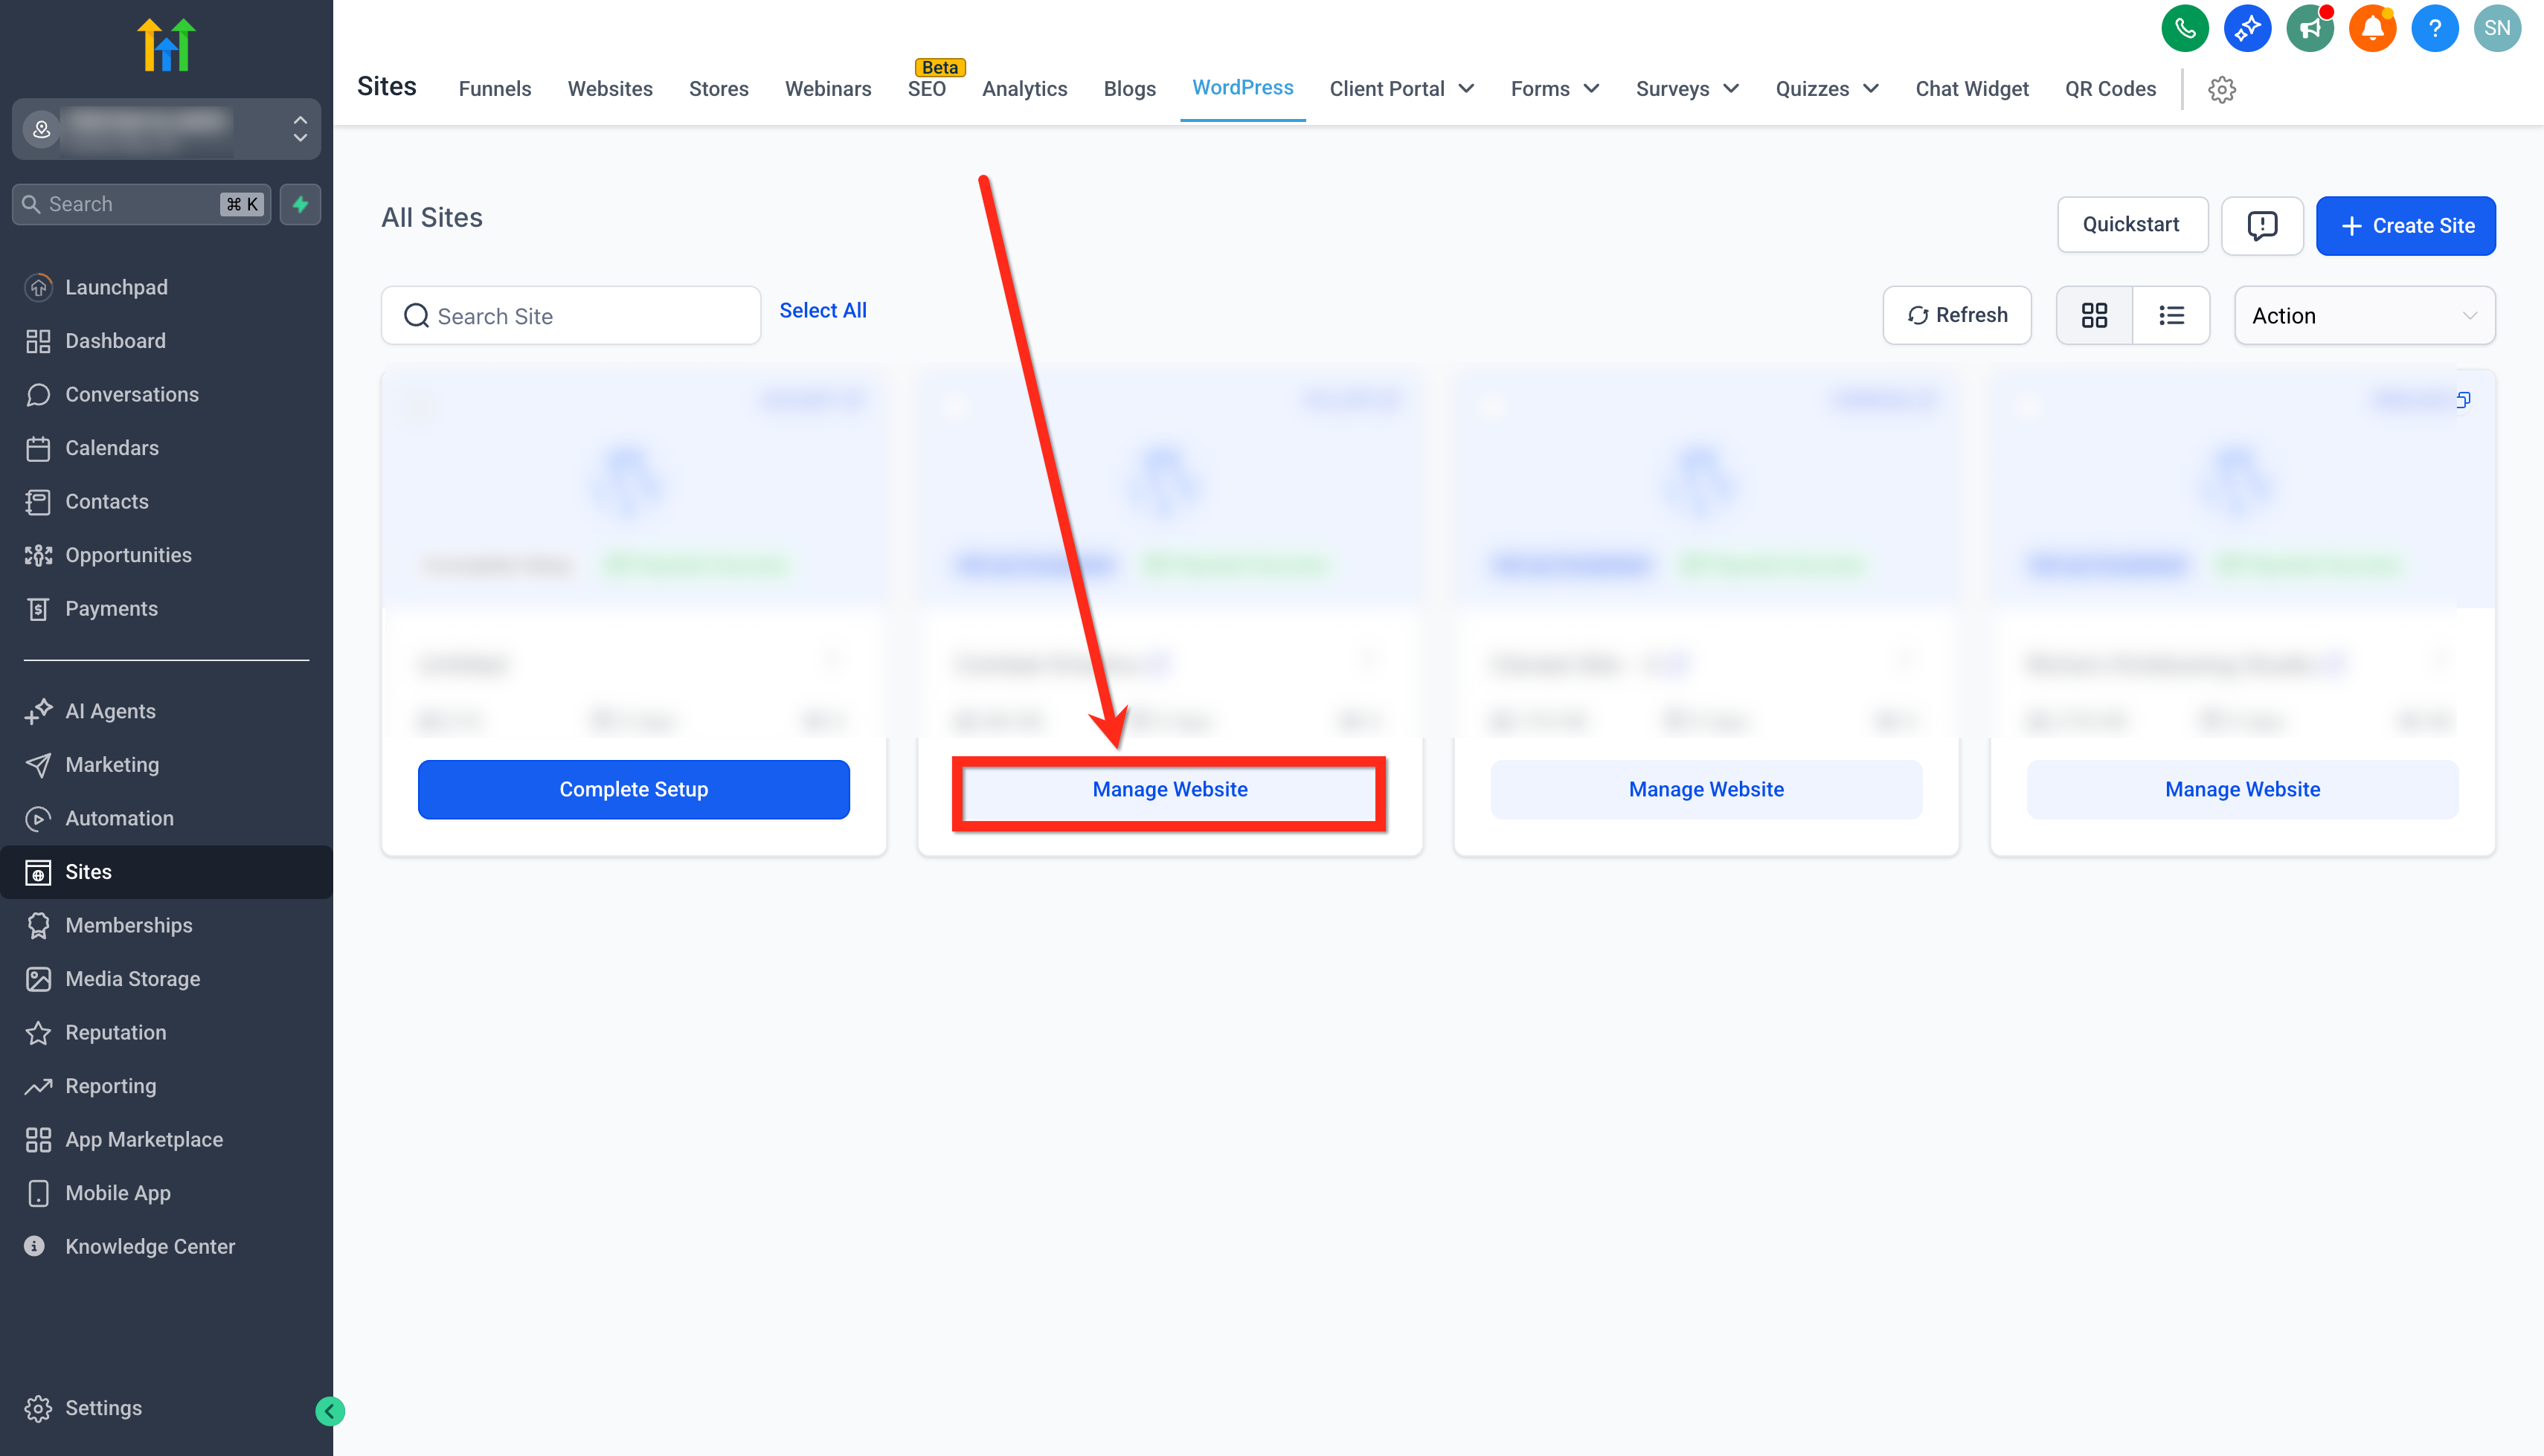
- Open the Sites section and select WordPress.
- Click Manage Website for the site you wish to monitor.
- Navigate to Analytics and open the Visitors Report.
- Find the Uptime Monitor toggle and flip it on.
06What it looks like in HighLevel
07Settings that matter
- Uptime Monitor toggle. Controls whether the automatic availability and response time checks run for the selected WordPress site.
08Things to know before you rely on it
- The initial release only provides visibility inside the app; no email, SMS, or in app alerts are sent.
- The monitor checks the primary endpoint defined in hosting and cannot be changed.
- All timestamps follow the account or subaccount time zone set in HighLevel.
09How it connects to the rest of HighLevel
- Manage plugins and themes for your WordPress sites in HighLevel. Plugin and theme management
- Learn how to set up WordPress hosting for clients and access the hosting dashboard. Set up WordPress hosting
- Review plan options and pricing for HighLevel services. Pricing and plans
Michael's take

Wondering if you really need a separate uptime view inside HighLevel? The WordPress Uptime Monitor gives you a quick pulse on every site you host without leaving the dashboard.
I’d flip the toggle on for the most critical client site and keep an eye on the status cards during a busy launch. It’s a low effort way to add transparency and help troubleshooting when something goes wrong.